Effect of Fortification of De-oiled Bottle Gourd (Lagenaria siceraria) Seed on the Functional and Chemical Characteristics of the Biscuit: A Nutritional Assessment.
 , , , ,
 1Division of Food Science, Postharvest Technology, ICAR - Indian Agricultural Research Institute, New Delhi, 110012, India
2Department of Food Process Engineering, National Institute of Technology Rourkela, Rourkela,Odisha, 769 008, India
3Centre of Food Science and Technology, Institute of Agricultural Sciences, Banaras Hindu University, Varanasi, 221005 India
4Department of Farm Engineering, Institute of Agricultural Sciences, Banaras Hindu University,Varanasi, 221005, India
5Agricultural Produce Processing Division, ICAR-Central Institute of Agricultural Engineering, Bhopal, 462038 India.
Corresponding Author Email: aspsingh23@gmail.com
DOI : http://dx.doi.org/10.12944/CRNFSJ.6.3.14
Download this article as:
![]()
De-oiled bottle gourd (Lagenaria siceraria) seed is a highly nutritious by-product of edible oil industries. The seed contains a substantial amount of quality protein, dietary fiber, minerals, and essential amino acids. The present study is undertaken to improve the quality of commercial biscuit through replacement traditional wheat flour with de-oiled bottle guard seed cake powder. Response surface methodology was used to carry out experimental layout with two independent variables viz; de-oiled bottle guard seed coded as bottle guard seed cake powder (BGSCP) and whole wheat flour (WWF) against five dependent responses viz., swelling capacity (SC), water absorption capacity (WAC), oil absorption capacity (OAC), protein, insoluble and soluble fiber. The most desirable (R2 - 0.899) solution was found at the formulation level of 50g BGSCP and 40g WWF. Nutritional assessment of optimized biscuit heightened a significant (p<0.05) rise in the amount of crude protein, ash content, and soluble fiber as in comparison with the control group sample. BGSCP fortification revealed significant improvement (43.22) in terms of essential amino acid availability as compared to control biscuit. However, the fatty acid compositions of optimized biscuit were insignificantly (p>0.05) different.
KEYWORDS:Biscuit; Bottle Guard (Lagenaria Siceraria) Seed; Functional Characteristic; Nutritional Assessment; Response Surface Mythology (RSM).
Introduction
Since decades food security has been a highly focused research area. An instantaneous increase in the population globally forecasted to increase by its three times by the end of the year 2050, will require increasing current food production scenario up to 70%.1 In particular, alternative food resources and improved food production techniques will be required to accomplish the prerequisite. With an enormous number of genera (120) and species (800), Cucurbitaceae is an important family of plants which are mainly grown for green vegetable purposes in the tropical and subtropical region of the world. Bottle gourd (Lagenaria siceraria) is an herbaceous plant widely cultivated and consumed in the tropical region of the world.2,3 Mature fruit has ample amount of seeds which comprises substantial amount of protein (37.1%), lipid (39.22%), crude fibre (4.29%), ash (3.91%), essential amino acids per gram of protein such as ARG (58.6 mg) LYS (56.2 mg), VAL (40.6 mg), TYR (34.9 mg), THR (mg), LUE (65.8mg) & MET (15.1 mg) and minerals such as K (3001 mg/100g), Mg (568 mg/100g), Fe (57.4 mg/100g) and P (1250 mg/100g)3,4,5 are commercially used for production of edible oil.6,7 Additionally, Developing functional ingredients and its formulation into food products to enhance the functional properties is under considerations.8-12 In particular, it is necessary to develop multiple processing techniques whereby bottle guard seed and its byproduct (de-oil seed) from edible oil industries can utilize efficiently. Subsequently developed technology could be an alternative to provide the highly nutritious foods or food ingredients for fortification, which might be helpful to tackle the problem of malnutrition especially for children, the elderly and low-income groups.
It is globally well known that biscuit is maximumly consumed ready-to-eat baked food product.13-15 Traditionally made up of wheat flour, milk, fat, salt, egg, emulsifiers and flavoring agent. Nowadays, biscuits are available with a different flavor, taste, texture, and nutritional level through the incorporation of a variety of food ingredients with functional and nutritional attributes.13-16 Incorporation of fibers and proteinaceous ingredients have been one of the best avenues.16-18 In a previous study, we tried to evaluate the sensory characteristics of biscuit fortified with bottle gourd seed cake powder (BGSCP) using the fuzzy logic method and we also optimized the ratio of BGSCP and whole wheat flour (WWF) using some physical and chemical parameters as dependent responses.16
However, this study is undertaken to optimize the level of BGSCP and WWF the same considering different dependent variables such as swelling property (also known as swelling capacity), water absorbing capacity (WAC), oil absorbing capacity (OAC) protein, insoluble fiber, and insoluble fiber. Additionally, the optimized ratio was also investigated for its nutritional assessment with respect to control biscuit.
Materials and Methods
Chemical and Ingredients
De-oiled bottle gourd seed cake powder (BGSCP) was obtained from the Department of Farm Engineering, Institute of Agricultural Sciences, Banaras Hindu University, Varanasi, India. The BGSCP were dried at 50±5oC for about 5 hours. The dried samples were ground in a blender. The powder obtained was then sieved through 150 µm sieve. The powder was sealed in airtight PE bag and stored in a refrigerator at 4oC. Whole wheat flour, refined palm oil, sugar, sodium chloride (NaCl), sodium bicarbonate (NaHCO3) and ammonium bicarbonate (NH4HCO3) were obtained from the local market. Analytical standards viz., Calibration mix majors and Calibration mix2 (ICP-OES Wavecal Conc.) for mineral profile analysis was procured from Agilent Technologies, USA; Fatty Acid Methyl Esters (FAME) kit was procured from Sigma-Aldrich, Germany and amino acids essay kit was ordered from Waters Inc., USA. Other organic solvents and chemicals were purchased from Fisher Scientific, USA,
Preparation of Dough and Biscuit
The dough and biscuit were prepared using the method followed for previous study.16 As given in table 1 different level of BGSCP (X1) and WWF(X2) with fixed amount of sugar (20 g), refined palm oil (20g, had density of 0.92 g/cm3 at 20˚C), sodium chloride (1 g), NaHCO3 (0.8 g) and NH5CO3 (0.5 g) were mixed manually. Control biscuit was prepared using the same ingredients and additional WWF was added instead of BGSCP. After baking, biscuits were cooled until room temperature and packed in LDPE zip lock bags. Prepared biscuits were stored at room temperature and the entire analysis was performed within a month.
Characterization of Biscuit
Proximate Analysis of BGSCP Biscuit
Proximate composition of the biscuit was analyzed by following the method suggested by Abdel-Moemin.19 Moisture content was estimated at 105±5°C and weight kinetics were recorded until constant weight achieved. Fat content was determined using SOCS PLUS automatic solvent fat extraction system (SCS 4 AS, Pelican equipment, Chennai, India) and crude protein was determined using Kjeldahl method (AKA 11, Automated Kjeldahl Nitrogen Analyser, USA). Ash content was estimated through scorching the at 550 °C for 6 hrs and subsequent desiccator cooling and weighing. Value of carbohydrate was analyzed through the proximate content differential technique.16
Functional Properties Analysis.
Swelling capacity, water absorbing capacity (WAC) and oil absorbing capacity (OAC), soluble and insoluble fiber contents of biscuit were evaluated according to the method suggested by Sangeetha priya and Perumal.20
Mineral Analysis
Mineral analysis of samples was performed using the method suggested by Li et al.,21 on Microwave Plasma-Atomic Emission Spectrometer (MPAES – Agilent Technologies 4100, USA), constituting of microwave-induced plasma (produced using nitrogen gas) and interfaced with anatomic emission spectrophotometer (AES).
Fatty Acids Profile
The fatty acid profile of the biscuits was determined by GC-FID analysis. Oil was extracted for fatty acid analysis using ten grams of the sample by dissolving in 50 ml n-hexane. The sample was centrifuged at 6000 rpm for 10 minutes. The supernatant was collected, and the solvent was removed under a vacuum evaporator. The oil obtained was converted to corresponding fatty acid methyl esters (FAMEs) using the method given by Pradhan et al.,22 GC-FID analysis of FAMEs was carried out on a Varian 450-GC equipped with a flame ionization detector (FID) and a 30m × 0.25mm GsBP-Innowax column coated with 0.25 µm film thickness of polyethylene glycol.
Amino Acids Profile
The amino acid profile was analyzed as method proposed by Mohapatra et al.,23 on H-Class UPLC (ACQUITY UPLC H-Class, Water Corporation, Milford, USA) coupled with tunable UV detector and BEH C18 (100mm x 2.1mm x 1.7µm) column at a fixed detection wavelength of 260 nm. However, tryptophan is high acid intolerant in nature was analyzed separately using the method suggested by Mohapatra et al., 23
The average percent relative standard deviation (%RSD) for retention time for six injections was < 0.10 and < 0.5 for area with 0.9998 R2 value.
Statistical analysis
Design-Expert® Software Version 11 – State-Ease, RSM was applied to derive the best formulation composition using two factors even response central composite rotatable design (CCRD) which had 13 experimental trials. Table 1 displays the values of the variables used independently to evaluate the efficacy and the optimum conditions for developing BGSCP biscuit. Dependent responses such as swelling capacity (g/g), WAC (g/g), OAC (g/g), protein (g/100g), insoluble fiber (g/100g) and soluble fiber (g/100g) were used to optimize the level of BGSCP and WWF. The effects of the independent parameters on the dependent responses were evaluated using the second order polynomial regression Eq:
![]()
Where Y refers to the measured predicted responses; intercept:β0; linear terms:β1 and β2; interaction coefficients:β12 and quadratic terms:β11 and β22. The experimental data were analyzed using the PROC SAS software and ANOVA at the level of significance (P <0.05).
Results and Discussion
Design of Experiments and Statistical Analysis
Experimental setup for a different level of dependent and independent with coded and decoded variables as designed by RSM tool are given in Table 1.
Table 1: Setup of Different Levels of Dependent and Independent (BGSCP and WWF) Variables.
| X1 | X2 | Y1 | Y2 | Y3 | Y4 | Y5 | Y6 | |
| Run | BGSCP (g) | WWF (g) | Swelling capacity(g/g) | WAC(g/g) | OAC(g/g) | Protein(g/100g) | Insoluble fibre (g/100g) | Soluble fiber (g/100g) |
| 1 | 50 | 60 | 20.34 | 8.34 | 0.82 | 22.64 | 2.86 | 9.27 |
| 2 | 40 | 50 | 19.01 | 12.83 | 0.73 | 18.28 | 3.87 | 7.08 |
| 3 | 30 | 40 | 18.34 | 7.72 | 0.72 | 11.57 | 4.73 | 5.87 |
| 4 | 50 | 40 | 22.83 | 9.12 | 1.04 | 21.08 | 2.21 | 6.92 |
| 5 | 40 | 35.8579 | 21.56 | 8.94 | 0.87 | 16.75 | 2.34 | 6.27 |
| 6 | 40 | 64.1421 | 16.35 | 6.92 | 0.67 | 19.42 | 6.23 | 8.45 |
| 7 | 54.1421 | 50 | 21.64 | 9.45 | 1.01 | 23.84 | 2.12 | 9.16 |
| 8 | 40 | 50 | 19.56 | 13.28 | 0.75 | 17.89 | 2.96 | 7.62 |
| 9 | 40 | 50 | 19.28 | 12.94 | 0.71 | 17.24 | 3.56 | 7.37 |
| 10 | 40 | 50 | 19.14 | 13.26 | 0.74 | 18.26 | 3.12 | 8.11 |
| 11 | 40 | 50 | 19.62 | 13.53 | 0.73 | 17.45 | 3.44 | 7.51 |
| 12 | 30 | 60 | 13.56 | 6.23 | 0.61 | 16.15 | 7.12 | 4.24 |
| 13 | 25.8579 | 50 | 15.12 | 6.73 | 0.64 | 13.57 | 6.34 | 4.07 |
Note: X1 and X2 independent variables; Y1-Y6 dependent responses; WAC, water absorbing capacity; OAC, oil absorbing capacity.
Regression analysis and analysis of variance were used to examine the statistical significance of model terms. Table 2 displayed that the F-values for lack of fit terms was insignificant (P > 0.05) implied that prediction for the response model was accurate. However, the F-values for models were significant (p < 0.05). These regression models implied that the independent variable displayed a significant effect on the dependent variables.
Note: X1 and X2 independent variables; Y1-Y6 dependent responses; WAC, water absorbing capacity; OAC, oil absorbing capacity.
Table 2: Coefficient Estimate and Model Statistics for BGSCP and WWF Fortified Biscuit.
|
Prob. > F |
||||||
| Swelling capacity(g/g) | WAC(g/g) | OAC(g/g) | Protein(g/100g) | Insoluble fibre (g/100g) | Soluble fiber (g/100g) | |
| Intercept | 19.322 | 13.168 | 0.732 | 17.824 | 3.39 | 6.234 |
| X1 | 2.561334* | 0.919583* | 0.131657* | 3.815497* | -2.19705* | 0.99392* |
| X2 | -1.82976* | -0.64084* | -0.07661* | 1.239494* | 1.317661* | 0.351883* |
| X1X2 | 0.5725* | 0.1775** | -0.0275* | -0.755* | -0.935** | -0.089* |
| X1^2 | -0.446* | -2.57838* | 0.0465* | 0.30675** | 0.913125* | -0.04113* |
| X2^2 | -0.1585** | -2.65837* | 0.019* | -0.00325* | 0.440625* | -0.1386** |
| Model (quadratic) | < 0.0001 | < 0.0001 | < 0.0001 | < 0.0001 | < 0.0001 | <0.0003 |
| F value | 139.4028 | 311.4999 | 246.476 | 75.98155 | 159.8352 | 97.73 |
| Mean | 18.95 | 9.945385 | 0.7723 | 18.01077 | 2.16404 | 6.78529 |
| Std. Dev. | 0.343064 | 0.246428 | 0.01289 | 0.588787 | 0.279731 | 0.3554 |
| C.V. % | 1.810363 | 2.477817 | 1.66944 | 3.269085 | 6.62386 | 4.76614 |
| Adj. R2 | 0.982955 | 0.99233 | 0.99031 | 0.968985 | 0.985115 | 0.89146 |
| Pred. R2 | 0.947889 | 0.986771 | 0.98353 | 0.907885 | 0.983957 | 0.7773 |
| APV | 37.68109 | 41.66093 | 47.5526 | 28.78964 | 37.27809 | 14.75 |
| Lack of fit | 0.1873NS | 0.7326NS | 0.7431NS | 0.2159NS | 0.9718NS | 0.7724NS |
Note: *Significant at p < 0.05 level, **Insignificant at p > 0.05 APV: Adequate precision value; Std. Dev. – standard deviation; C.V. – coefficient of variation; Adj. R2 – adjusted R2; Pred. R2 – predicted R2.
The relative dispersion of the experimental point from the prediction point of the model was indicated by the coefficient of variation (CV). CV values less than the 10% is an indication of the desirable model. However, in the present study, the overall CV was less than 7%, implied that the experimental values of the predicted point had been carried out precisely.
Effect on Swelling Capacity
Swelling capacity of the samples was recorded in the range of 13.56 to 22.83 g/g. The minimum ratio value was obtained for the formulation was 30 g of BGSCP and 60 g of WWP while the maximum value for the formulation was 50 g of BGSCP and 40 g of WWF. Coefficient estimation of the model (Table 2) implies a positive effect of BGSCP on the swelling capacity of biscuit at the level of linear and interactive and a slight negative effect at the level of quadratic. However, WWF displayed a negative effect on the entire level of the regression model. Replacement of WWP with BGSCP displayed significant effect (p < 0.0001) on the swelling capacity of biscuit. The coefficients of the first order term variables indicate that the swelling capacity of fortified biscuit increased gradually with increasing the BGSCP ratio, however, increasing the WWF ratio displayed a negative effect (Fig. 1A). Correia and Beirao-da Costa24 reported that higher processing temperature facilitates hydration of present soluble fiber subsequently increased the swelling capacity. Similarly, Sangeetha priya and Perumal20 also reported the effect of soluble and insoluble fiber on the hydration capacity of mucilage dietary fiber isolated from Jujube (Zizyphus mauritiana) fruits. As it can be seen from the chemical characteristics section BGSCP had much higher soluble fiber content than the WWF biscuit. Which might have resulted increased the swelling capacity of with increasing the BGSCP concentration. The quadratic equation data obtained from the RSM of the data showing the effect of BGSCP and WWF on the biscuit swelling capacity resulted in the equation:
![]()
The model F-value of 139.40 (Table 2) implied that the model was significant (p < 0.0001) and lack of fit was insignificant (p < 0.1873). The adequate precision value (APV) was 37.68 which was much higher than the minimum desirable ratio of signal to noise (4). The ratio of 37.68 indicates an adequate signal.
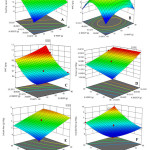 |
Figure 1: A-F. 3D response surface plots showing the effect of BGSCP and WWF on the quality attributes of fortified biscuit. |
Effect on Water Absorption Capacity
The WAC of products mainly depends upon the dipolar moment of organic constituents (such as protein and carbohydrate). Higher the hydrophilic in nature increases the WAC.25,26 It also directly influenced by fiber content, increases interaction between macromolecules of polysaccharides and hydroxyl groups of other constituents.20, 27 The WAC of the biscuit was recorded in the range of 6.23 to 13.53 g/g. A formulation ratio of 30g BGSCP and 60g WWF displayed the minimum score while the formulation 40g BGSCP and 50g WWF resulted in the maximum score. APV value of regression analysis presented in Table 2 was much higher (41.66) than the minimum desirable value for high precision. The effect of BGSCP and WWF on the WAC of the fortified biscuit was examined using the following quadratic regression equation:
![]()
BGSCP had significant positive effect at the level of linear and interactive and quadratic model displayed a significant (p < 0.05) on WAC. However, a significant negative effect of WWF was recorded a the level of linear & quadratic and positive at the interactive model. The coefficients of the first order term variables indicate that with an increase in the level of BGSCP till 40g there was an increase in the WAC which may be due to the presence of high amount of polar amino acids in BGSCP (Table 5) compared to WWF based control biscuit(Fig. 1B) and comparable hydrophilic nature of dietary fibers20
Effect on Oil Absorbing Capacity
Oil absorbing capacity (OAC) is a measure of the improved flavor and mouthfeel of the products.28,29 OAC of the BGSCP fortified biscuit observed in the range of 0.61 to 1.04 g/g (Table 2). Similar to the WAC a formulation ratio of 30g BGSCP and 60g WWF displayed the minimum OAC score, however, the formulation ratio of 50g BGSCP and 40g WWF secured the maximum score. Following the quadratic regression equation obtained from the RSM ANOVA showing the effect of BGSCP and WWF on the OAC:
![]()
The regression of analysis presented in Table 2 reveals that the calculated APV was 47.55 which was fairly higher than the required value for adequate precision, Furthermore, the model F-value: 246.48 of statistical analysis implied that the model was fitted to the data fairly. A slight positive significant (p < 0.05) effect was indicated by BGSCP at the linear and quadratic level and slight negative at an interactive level. However, WWF displayed moderate negative effect at the linear and interactive level and slight positive at quadratic level. Figure 1C displays that increasing the concentration of BGSCP resulted in an increased OAC. Similar observations were recorded in different types of flours by the Kaushal and research team.30 Therefore, it was hypothesized that the conceivable cause for the surge in the OAC of fortified biscuit may be due to the alteration in the presence of characteristics of BGSCP constituents, which might attract the non-polar hydrophobic hydrocarbon of the oil. Protein is the main constituent which affects the OAC of the products which have been characterized for polar and non-polar side chain (Table 5). Monomer units of protein such as hydrophobic amino acid play a crucial role in the significant interaction with lipids hydrocarbon.31 Moreover, Sangeetha priya and Perumal20 assumed that the OAC in mucilage dietary fiber isolated from Zizyphus mauritiana fruits was due to the presence of hydrophobic dietary fibers.
Effect on Protein Content
The protein content of fortified biscuit was ranged from 11.57 to 23.84 g/100g. A formulation of 30 g BGSCP and 40 g WWF displayed the minimum protein content (11.57 g/100g) and the formulation of 54.14 g BGSCP and 50 g WWF resulted in highest protein content (23.84 g/100g). It can be inferred from the table 2 that the BGSCP and WWF had a positive effect on the protein content at the level of linear and quadratic and slight negative at the interactive level, showing a significant effect (p <0.05) at linear, interactive and quadratic level. However, WWF had a positive effect on protein value at linear, and negative at interactive and quadratic level. Replacement of WWP with BGSCP displayed significant effect (p < 0.05) on the protein content of fortified biscuit. The coefficients of the first order term variables indicate that the protein content of fortified biscuit increased gradually with increasing the BGSCP proportion, however, increasing the WWF content displayed negative effect (Fig. 1D). As it can be seen from the Table 4 BGSCP had approximately 7 times higher protein content than the WWF biscuit (control), approx. 2 times higher than the cake prepared using potato peel Jaddou et al.,18 Which might have been resulted in an increase in the protein content of fortified biscuit due to increasing the BGSCP concentration. The quadratic equation obtained from the RSM data for the effect of BGSCP and WWF on the biscuit protein is given below:
![]()
The model F-value of 75.98 (Table 2) revealed that lack of fit was insignificant (p < 0.2159) and the model was significant (p < 0.0001). The higher APV of 20.79 also inferred the best suitability of the model compared to the minimum required value of the signal to noise (4). The ratio of 28.79 indicates an adequate signal.
Effect on Insoluble Fiber Content
The insoluble fiber content of biscuit ranged from 2.12 to 9.12 g/100g. A formulation level of 54.14 g BGSCP and 50 g WWF displayed minimum insoluble value while the formulation level of 30 g BGSCP and 60g WWF resulted in maximum value. A degree of precision of the designed experimental setup was confirmed through the APV of 37.27 obtained by statistical regression. Further the statistical analysis model F-value of 159.84 also implied that the model fitted to the data well. Following the quadratic regression equation was used to investigate the effect of BGSCP and WWF on the biscuit insoluble fiber:
![]()
There was a negative effect of BGSCP at the linear and interactive level and the positive at the quadratic level. However, WWF displayed significant (p < 0.05) positive effect at the linear and quadratic level and negative at an interactive level. Figure 1E displays that increasing the concentration of BGSCP resulted in a decrease in insoluble content, however increasing the WWF resulted in an increase same. It was due to lower insoluble fiber content in BGSCP (Table 4). Jabbou et al.,18 reported that the insoluble fiber content (19.59 %) in potato peel fortified cake which is around ten times higher than our findings.
Effect on Soluble Fiber Content
The soluble fiber content of fortified biscuit was observed in the range of 6.07 to 9.27 g/100g. The minimum value was obtained for the formulation which had 25.86g BGSCP and 50g WWP while the maximum value obtained for the formulation ratio of 50 g BGSCP and 60 g WWF. Table 2 reveals that both BGSCP and WWF had a positive effect on soluble fiber at linear and negative at the interactive level and quadratic level. Replacement of WWP with BGSCP displayed significant effect (p < 0.0003) on the soluble fiber content of biscuit. The coefficients of the first order term variables indicate that the soluble fiber content of fortified biscuit increased gradually with increasing the BGSCP proportion, however, increasing the WWF ratio displayed negative effect (Fig. 1F). As it can be seen from the Table 4 BGSCP had approx. three times higher soluble fiber content than the WWF biscuit. Which might have increased the same with increasing the BGSCP concentration. Following the quadratic regression equation was used to investigate the effect of BGSCP and WWF on the biscuit soluble fiber:
![]()
The model F-value of 139.40 (Table 2) depicted that the model was significant (p < 0.0003) and lack of fit was insignificant (p < 0.7724). The APV was 14.75 which was higher than the lowest required ratio of signal to noise (4).
Optimization of the BGSCP and WWF level and validation of the model
To optimize the optimum level of formulation for BGSCP and WWF RSM tool was used. In order to arrive at the optimum Design Expert software (Trial version 11) was carried out. Independent variable BGSCP and dependent responses were, OAC, protein and soluble fiber were given the highest priority during the optimization process, while WWF and swelling capacity at average and insoluble fiber at a minimum. Optimized solutions obtained for the biscuit quality attributes were determined as BGSCP 50 g and WWF 40 g level (Table 3). The desirability of independent variables and dependent responses are given in Fig. 2 displayed that optimized level of BGSCP,
Table 3: Most desirable solution of the experiment.
| Soln | BGSCP | WWF | Swelling capacity | WAC | OAC | Protein | Insoluble fiber | Soluble fiber | Desirability |
| 1 | 50.00 | 40.00 | 22.536 | 9.314 | 1.033 | 21.459 | 2.164 | 6.785 | 0.899 |
| 2 | 49.9 | 40.00 | 22.528 | 9.348 | 1.031 | 21.419 | 2.160 | 6.778 | 0.897 |
| 3 | 50.00 | 41.19 | 22.422 | 9.856 | 1.017 | 21.517 | 2.111 | 6.848 | 0.882 |
| 4 | 48.87 | 40.00 | 22.407 | 9.779 | 1.005 | 20.878 | 2.112 | 6.672 | 0.867 |
| 5 | 50.00 | 45.75 | 21.943 | 11.225 | 0.958 | 21.740 | 2.023 | 7.050 | 0.809 |
WWF and responses had a desirable correlation coefficient above its acceptable limit.32 The model predicted value was performed four times to validate the predicted optima and there was no significant (p < 0.1) difference between the predicted and experimental value.
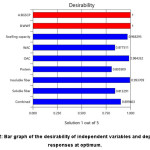 |
Figure 2: Bar graph of the desirability of independent variables and dependent responses at optimum. Click here to View figure |
Nutritional Assessment of Optimized Biscuit with Control Biscuit
Proximate Composition
The Nutritional values of optimized biscuit and control biscuit are given in Table 4. The primary aim of this work was to enhance the nutritional value of commercial biscuit through the incorporation of de-oiled BGSCP and effluent utilization of de-oiled BGSCP which a by-product of edible oil industries. It can be seen from Table 4 that the optimized biscuit had a high level of protein (21 g/100g), ash (3.86 g/100g) and soluble fiber(6.79 g/100g) compared to control biscuit protein (5.87 g/100g), ash (0.37 g/100g) and soluble fiber (3.75 g/100) revealed that the fortified biscuit had excellent proximate value and were significantly (p < 0.05) higher. The protein content of fortified biscuit was approx. two times higher than the biscuit prepared by Limonia acidissima fruit powder,15 four-time biscuit prepared using buckwheat flour33 and two times biscuits made with pearl millet flour.13
Table 4: Proximate Composition of Optimized and Control Biscuit.
| Constituents | BGSCP (g/100g) | Control biscuit (g/100g) | BGSCP biscuit (g/100g) |
| Moisture | 11.01±0.41 | 3.78±0.07a | 4.17±0.67b |
| Fat | 4.61±0.23 | 21.15±1.43a | 20.21±1.24a,b |
| Protein | 33.71±1.62 | 5.87±0.83a | 21.46±1.08b |
| Ash | 5.17±0.04 | 0.37±0.05a | 3.86±0.23b |
| Carbohydrate | 45.50±2.72 | 68.83±1.26a | 50.30±1.89b |
| Soluble fiber | 10.52±1.43 | 3.75±0.37a | 6.785±1.12b |
| Insoluble fiber | 3.85±0.72 | 3.19±0.46a | 2.16±0.56b |
Note: Mean values (± standard deviation) were the averages of three independent measurements. Data are significantly different at the level of p < 0.05.
Mineral Composition
As result indicated that fortified biscuit had higher ash content than the control biscuit revealed that the higher mineral content. Phosphorus (P: 1086.34mg/100g) was the abundant mineral in optimized biscuit followed by potassium (K: 657.15mg/100g), magnesium (Mg: 265.38mg/100g) and calcium (Ca: 85.31mg/100g) which were significantly (p < 0.5) higher than the control biscuit(Table5). Limiting minerals such as sodium (Na: 36.18mg/100g), iron (Fe: 15.67mg/100g) and aluminum (Al: 10.74 mg/100g) were also significantly (p < 0.05) higher than the minerals recorded in control biscuit. However, trace minerals such as zinc (Zn: 5.67 mg/100g) and manganese (Mn: 5.67 mg/100g) were similar to the control biscuit. Higher the mineral content was due to BGSCP as it can be seen from Table 5, which displayed an enormous amount of mineral. Findings were similar to the mineral composition of bottle gourd kernel5 and less than the mineral compositions reported by Hassan et al.,4 in whole bottle seed. Similarly, fortified biscuits displayed lower mineral compositions than the values reported by Adebiyi et al.,13 in pear millet flour fortified biscuits. Nevertheless, results depicted that the fortified biscuit had quite a comparable mineral composition to values suggested by RDA.34
Table 5: Mineral Contents of Optimized and Control Biscuits.
| Minerals | BGSCP (mg/100g) | Control biscuit (mg/100g) | BGSCP biscuit (mg/100g) |
| Se | 4.78±0.14 | 0.15±0.04a | 2.35 ± 0.11b |
| As | 1.75±0.24 | 0.06±0.01a | 2.64 ± 0.26b |
| Cu | 4.59±0.11 | 0.6±0.02a | 2.79 ± 0.53b |
| Zn | 3.08±0.23 | 4.1±0.17a | 5.67 ± 0.31a |
| Ni | 4.34±0.62 | 0.08±0.00a | 0.98 ± 0.02b |
| Mn | 3.67±0.15 | 5.89±0.51a | 5.67 ± 0.72a |
| Cr | 54.82±0.67 | 0.84±0.23a | 1.94 ± 0.04b |
| Na | 26.34±1.24 | 1.89±0.45a | 36.18 ± 1.34b |
| Fe | 17.25±1.27 | 5.67±0.28a | 15.67 ± 2.48b |
| Al | 251.14±2.78 | 4.26±0.87a | 10.74 ± 1.01b |
| Mg | 123.84±2.15 | 186.37±5.67a | 264.38 ±10.56b |
| Ca | 119.30±3.46 | 37.94±2.62a | 85.31 ±25.78b |
| P | 1062.4±17.24 | 476.81±4.75a | 1086.34±54.24b |
| K | 472.07±7.07 | 507.34±12.64a | 657.15 ±4.24b |
Note: Mean values (± standard deviation) were the averages of three independent measurements. Data are significantly different at the level of p < 0.05.
Fatty Acids Composition
The fatty acids profile of optimized biscuit was insignificant (p > 0.05) different from the control biscuit. Table 6 displays that fortified contain following unsaturated fatty acids oleate (37.58%), linoleate (14.68%), linolenate (0.58%), arachidonate (0.52%) and docosahexaenoic acid (DHA: 0.51%). Saturated fatty acids (SFA) were palmitate (35.73%) and stearate (6.89%), respectively. The total SFA of the optimized biscuit was recorded up to 42.62 % followed by monounsaturated fatty acids (MUFA(37.58 %) polyunsaturated fatty acids (PUFA) (15.83 %). The ratio of PUFA to SFA in optimized biscuit was found to be 0.37, which was less than the recommended level (>0.4), which depicted that the higher amount of SFA in a biscuit with respect to its PUFA. Similar findings reported by Ganorkar and Jain35 displayed that the cookies fortified with flaxseed flour and refined palmolein oil had PUFA/SFA ratio of 0.05 to 0.2.
Table 6: Fatty Acid Profile of Optimized and Control Biscuits.
| FAME | BGSCP (%) | Control biscuit (%) | BGSCP biscuit (%) |
| Palmitate (C16:0) | 15.80±3.41 | 40.53±2.57a | 35.73 ± 1.35a |
| Stearate (C18:0) | 9.10±1.03 | 7.32±1.14a | 6.89 ± 0.44a |
| Oleate (C18:1) | 16.50±2.28 | 33.67±3.52a | 37.58 ± 2.53a |
| Linoleate (C18:2) | 54.51±2.23 | 15.10±0.19a | 14.68 ± 1.08a |
| Linolenate (C18:3) | 1.5.08±0.5 | 0.28±0.15a | 0.58 ± 0.29a |
| Arachidonate (C20:4) | 0.67±0.04 | 0.08±0.07a | 0.06 ± 0.04a |
| DHA cis-7 (C22:7, cis) | 0.62 ± 0.21 | 0.78±0.05a | 0.51 ± 0.12a |
| ΣSFA | 24.90 | 47.85a | 42.62a |
| ΣMUFA | 16.50 | 33.67a | 37.58a |
| ΣPUFA | 57.30 | 16.24a | 15.83a |
| PUFA/SFA | 2.30 | 0.34a | 0.37a |
| ΣFA | 98.70 | 97.76a | 96.03a |
Note: Mean values (± standard deviation) were the averages of three independent measurements, Percentage of fatty acids presented is the average of three analyses. SFA- saturated fatty acid; MUFA – monounsaturated fatty acid; PUFA – polyunsaturated fatty acid; FA – fatty acid. Data are significantly different at the level of p < 0.05.
Amino Acids Composition
As it is summarized earlier that the major objective of this work was to improve the protein content and quality of commercial biscuit using BGSCP. Taking a kook from the Table 7 BGSCP was a good source of essential amino acids viz., histidine (HIS: 16.97), alanine (ALA: 51.25), arginine (ARG: 87.65), cysteine (CYS: 34.36), lysine (LYS: 46.08), tyrosine (TYR: 54.71), Threonine (THR: 32.12), methionine (MET: 14.93), isoleucine, valine (VAL: 34.62), (ILE: 23.73), leucine (LEU: 66.15), phenylalanine (PHE: 43.80), tryptophan (TRP: 14.71). Nonessential amino
Table 7: Amino Acids (mg/g) Profile of BGSCP, Control and Fortified Biscuit.
| Amino acids | BGSCP (mg/g) | Control biscuit(mg/g) | BGSCP biscuit (mg/g) |
| HISα | 16.97±0.31 | 14.12±0.12a | 11.92±0.8b |
| ALAα | 51.25±1.12 | 21.40±0.34a | 32.70±1.4b |
| ARGα | 87.65±2.54 | 54.12±0.21a | 43.54±0.8b |
| CYSα | 34.36±1.07 | 25.23±0.32a | 19.29±1.1b |
| LYSα | 46.08±1.14 | 14.31±1.00a | 29.79±0.8b |
| TYRα | 54.71±2.24 | 13.07±0.23a | 24.35±0.8b |
| THRα | 32.12±0.42 | 2.11±0.05a | 30.51±0.1b |
| METα | 14.93±0.55 | 1.08±0.11a | 7.76±0.4b |
| VALα | 34.62±0.56 | 14.03±0.32a | 26.89±1.4b |
| ILEα | 23.73±0.35 | 6.83±0.22a | 14.38±0.5b |
| LEUα | 66.15±3.76 | 10.24±0.19a | 34.10±0.9b |
| PHEα | 43.80±0.85 | 6.32±0.31a | 42.11±3.7b |
| TRPα | 14.71±0.90 | 11.31±0.01a | 25.23±1.1b |
| GLUβ | 169.27±8.82 | 204.73±1.74a | 95.61±3.7b |
| GLYβ | 27.22±1.51 | 21.22±0.23a | 22.38±0.5a |
| SERβ | 27.67±1.73 | 13.62±0.00a | 16.51±0.2b |
| PROβ | 28.10±1.43 | 20.31±0.52a | 18.26±1.7a |
| ASPβ | 116.48±4.02 | 87.02±0.01a | 51.78±6.8b |
| TEAA | 521.01 | 194.17a | 342.57a |
| TNEAA | 368.74 | 364.91a | 214.54b |
| TAA | 889.75 | 541.08a | 557.11a |
| TSAA | 5.54 | 4.86a | 4.55a |
| TArAA | 14.64 | 3.97a | 16.45b |
| TAAA | 32.11 | 53.92a | 28.25b |
| TBAA | 16.94 | 15.27a | 15.30a |
| TAlAA | 22.81 | 13.62a | 23.45 |
| THAA | 6.72 | 2.91a | 8.44 |
Note: αEssential amino acid, βnon-essential amino acid; *TEAA – total essential amino acids, TNEAA – total non-essential amino acids, TSAA – total sulphur amino acids, TArAA – total aromatic amino acids, TAAA – total acidic amino acids, TBAA – total basic amino acids, TAlAA – total aliphatic amino acids; THAA – total hydroxylic amino acids and TAA – total amino acids. Values present in mean ± standard deviation of triplicate for each sample (n=3). Data are significantly different at the level of p < 0.05.
Acids were also dominated in the BGSCP such as glutamic acid (GLU: 169.27), glycine (GLY: 27.22), serine (SER: 27.67), proline (PRO: 28.10) and aspartic acid (ASP: 116.48 mg/g protein). Total essential amino acids (TEAAs) in BGSCP was recorded up to 521.01mg/g protein which was comparable similar to the TEAAs of egg (659.70mg/g) and three times higher than the milk (179.50mg/g),36 revealed that could be a supplement with reference egg protein.37 Total nonessential amino acids (TNEAAs: 368.74mg/g), total amino acids (TAA: 889.75mg/g protein), total Sulphur amino acids (TSAAs: 5.54%), total aromatic amino acids (TArAAs: 14.64%), total acidic amino acids (TAAAs: 32.11%), total basic amino acids (TBAAs: 16.94%), total alkaline amino acids (TAlAAs: 22.81%) and total hydroxyl amino acids (THAAs: 6.72%) were found to be relatively similar to the finding of values reported by Ogunbanjo et al., 3 in bottle gourd seed flour. Similarly, fortified biscuit displayed excellent profile of essential amino acids which were significantly (p < 0.05) higher than the control biscuit except for HIS (11.92), ARG (43.54), CYS (19.29), GLU (95.61) and ASP (51.78 mg/g protein). It was found that the TEAAs content of biscuits was improved up to 43.22% by incorporating BGSCP as compared to control biscuit. Recorded a significant (p < 0.05) improvement from 194.17 mg/g protein (control) to 342.57 mg/g protein (fortified). Adebiyi et al., 13 reported that the biscuit prepared using pearl millet flour had an approx. 240 mg/g protein TEAAs which was less than the current study. However, total amino acids of fortified and control biscuit (557.11 and 541.08 mg/g protein) were unchanged. Results revealed that the fortified biscuit had quality protein with possibly all essential amino acids suggested by WHO/FAO/UNU.37
Conclusion
This study was important from the point of view to the incorporation of the quality ingredient in bakery products aimed to enhance nutritional value through utilization of edible oil industries by-products. The fortification of commercial biscuits with quality protein rich BGSCP can be considered as an alternative ingredient which had high protein with excellent amino acid profiles, soluble fiber and plenty amount of minerals. The optimized fortified biscuits had high nutritional value for commercial exploration. It is necessary to improve technological development which could increase the way of fortification of BGSCP into different food matrices to make it more commercial. In this manner, RSM was implied for statistical designing of experimental conditions in order to optimize the level of BGSCP and WWF for production of high soluble fiber, high protein, high mineral biscuit. Optimization for the preparation of improved quality biscuit was predicted based on the score of chemical and functional characteristics. The formulation with 50g BGSCP and 40g WWF was considered to be the most desirable combination to produce quality biscuit. The optimized had 21.46% quality protein, 3.86% ash (with high in desirable minerals) and 6.79% soluble fiber. The nutritional assessment revealed that the essential amino acids content of fortified biscuit improved up to 43.22% compared to control biscuit.
Acknowledgments
This work was supported by the Science and Engineering Research Board, Department of Science and Technology, New Delhi, India. We are also immensely thankful to Centre of Food Science and Technology, Institute of Agricultural Sciences, Banaras Hindu University, for providing an opportunity to complete this work by extending the facilities and financial support.
Conflict of Interest
The authors declare no conflict of interest.
References
- Tilman D., Balzer C., Hill J., Befort B. L. Global food demand and the sustainable intensification of agriculture. Proc NatlAcad Sci. 2011;108(50):20260-20264.
CrossRef - Shah B. N., Seth A. K., Desai R. V. Phytopharmacological profile of Lagenaria siceraria: a review. Asian J Plant Sci. 2010;9(3):152-157.
CrossRef - Ogunbanjo O. R., Awotoye O. O., Jayeoba F. M., Jeminiwa S. M.Nutritional analysis of selected Cucurbitaceae species. Univ J Plant Sci. 2016;4(1):1-3.
- Hassan L. G., Sani N. A., Dangoggo S. M., Ladan M. J. Nutritional value of bottle gourd (Lagenaria siceraria) seeds. Global J Pure Appl Sci. 2008;14(3):301-306.
CrossRef - Olaofe O., Ekuagbere A. O. Ogunlade Chemical, amino acid composition and functional properties of calabash seed’s kernel. Bull Pure Appl Sci. 2009;28(1/2):13.
- Kubde M. S., Khadabadi S. S., Farooqui I. A., Deore S. L. Lagenaria siceraria: phytochemistry, pharmacognosy and pharmacological studies. Rep Opin. 2010;2(3):91-8.
- Said P. P., Pradhan R. C., Rai B. N. A green separation of Lagenaria siceraria seed oil. IndCrops Prod. 2014;52:796-800.
CrossRef - Dhakane J. P., Kar A., Patel A. S., Khan I. Effect of soy proteins and emulsification-evaporation process on physical stability of lycopene emulsions. Int J Chem Studies. 2017;5(5):1354-1358.
- Duhan S., Kar A., Nain L., Patel A. S., Dash S. K. Development of continuous flow microwave and hot water bath system for destruction of spoilage microorganisms in food. Ind J Agric Sci. 2017; 87(2):210-214.
- Ghosh P., Pradhan R. C., Patel A. S., Kar A., Mishra S. Physicochemical characteristics of Syzygium cumini Curr Res Nutr Food Sci. 2017;5(1):25-35.
CrossRef - Murali S., Kar A., Patel A. S., Kumar J., Mohapatra D., Dash S. K. Spray dried encapsulation of rice bran oil in soya protein isolate – tapioca starch complex using response surface methodology. Ind J Agric Sci. 2016;86(8):984–91.
- Murali S., Kar A., Patel A. S., Mohapatra D., Krishnakumar P. Optimization of process conditions of rice bran oil encapsulation using spray drying by response surface methodology. Int J Food Eng. 2017;13(4):25-35.
- Adebiyi J. A., Obadina A. O., Adebo O. A., Kayitesi E. Comparison of nutritional quality and sensory acceptability of biscuits obtained from native, fermented, and malted pearl millet (Pennisetum glaucum) flour. Food Chem. 2017;232:210-217.
CrossRef - Jnawali P., Kumar V., Tanwar B. Celiac disease: Overview and considerations for development of gluten-free foods. Food Sci Hum Well. 2016;5(4):169-176.
CrossRef - Patel A. S., Pandey A. K. Fortification of Limonia acidissima truit powder to develop the phenolic enriched herbal biscuits. J Biores Eng Technol. 2014;1:74-85.
- Patel A. S., Pradhan R. C. Quality ranking of bottle gourd seed cake powder incorporated biscuits using fuzzy analysis of sensory attribute. BIOINFOLET-A Quart J Life Sci. 2015;12(4a):901-908.
- Chandra D., Chandra S., Sharma A. K. “Review of Finger millet (Eleusine coracana (L.) Gaertn): a power house of health benefiting nutrients”. Food Sci Hum Well. 2016;5(3):149-155.
CrossRef - Jeddou K. B., Bouaziz F., Zouari-Ellouzi S., Chaari F., Ellouz-Chaabouni S., Ellouz-Ghorbel R., Nouri-Ellouz O. Improvement of texture and sensory properties of cakes by addition of potato peel powder with high level of dietary fiber and protein. Food Chem. 2017;217:668-677.
CrossRef - Abdel-Moemin A. R. “Effect of Roselle calyces extract on the chemical and sensory properties of functional cupcakes”. Food Sci Hum Well. 2016;5:(4)230-237.
CrossRef - Sangeethapriya M., Perumal S. “Health related functional characteristics and antioxidant potential of mucilage (dietary fiber) from Zizyphus mauritiana fruits”. Food Sci Hum Well. 2014;3(2):79-88.
CrossRef - Li W., Simmons P., Shrader D., Herrman T. J., Dai S. Y. Microwave plasma-atomic emission spectroscopy as a tool for the determination of copper, iron, manganese and zinc in animal feed and fertilizer. Talanta. 2013;112:43-48.
CrossRef - Pradhan R. C., Meda V., Rout P. K., Naik S., Dalai A. K. Supercritical CO2 extraction of fatty oil from flaxseed and comparison with screw press expression and solvent extraction processes. Journal of Food Engineering. 2010;98:393-397.
CrossRef - Mohapatra D., Patel A. S., Kar A., Deshpande S. S., Tripathi M. K. Effect of Different Processing Conditions on Proximate Composition, Anti-oxidants, Anti-nutrients and Amino Acid Profile of Grain Sorghum. Food Chem. 2018;271:129-135.
CrossRef - Correia P., Beirão-da-Costa M. L. Effect of drying temperatures on starch-related functional and thermal properties of chestnut flours. Food Bioprod Proc. 2012;90(2):284-294.
CrossRef - Akubor P. I., Badifu G. I. Chemical composition, functional properties and baking potential of African breadfruit kernel and wheat flour blends. Int J Food Sci Technol. 2004;39(2):223-229.
CrossRef - Butt M. S., Batool R. Nutritional and functional properties of some promising legumes protein isolates. Pak J Nutr. 2010;9(4):373-379.
CrossRef - Dikeman C. L., Fahey Jr G. C. Viscosity as related to dietary fiber: a review. Crit Rev Food Sci Nutr. 2006;46(8):649-663.
CrossRef - Jan K. N., Panesar P. S., Singh S. Textural, in vitro antioxidant activity and sensory characteristics of cookies made from blends of wheat‐quinoa grown in India. J Food Process Preserv. 2018;42(3): e13542.
CrossRef - Kiin-Kabari D. B., Eke-Ejiofor J., Giami S. Y. Functional and pasting properties of wheat/plantain flours enriched with bambara groundnut protein concentrate. Int J Food Sci and Nutr Eng. 2015; 5(2):75-81.
- Kaushal P., Kumar V., Sharma H. K. Comparative study of physicochemical, functional, antinutritional and pasting properties of taro (Colocasia esculenta), rice (Oryza sativa) flour, pigeonpea (Cajanus cajan) flour and their blends. LWT-Food Sci Technol. 2012;48(1):59-68.
CrossRef - Soltero B. H. The production of protein isolates from the aqueous extraction of de-hulled yellow mustard flour and determination of their functional properties, (Doctoral dissertation, University of Toronto (Canada)). 2013;75-78.
- Chittaranjan Das V. Response surface methodology and desirability approach to optimize EDM parameters. Int J Hyb Info Technol. 2016;9(4):393-406.
- Kaur M., Sandhu K. S., Arora A., Sharma A.Gluten free biscuits prepared from buckwheat flour by incorporation of various gums: physicochemical and sensory properties. LWT-Food Sci Technol. 2015;62(1):628-632.
CrossRef - Rahman A. H. Bottle Gourd (Lagenaria siceraria) – a vegetable for good health. NPR–Nat Prod Rad. 2003;2(5):249-250.
- Ganorkar P. M., Jain R. K. Effect of flaxseed incorporation on physical, sensorial, textural and chemical attributes of cookies. Int Food Res J. 2014;21(4):1515-1521.
- Tessari P., Lante A., Mosca G. Essential amino acids: master regulators of nutrition and environmental footprint? Sci Rep. 2016;6.
CrossRef - WHO/FAO/UNU. Protein and Amino Acid Requirements in Human Nutrition: Report of a Joint WHO/FAO. 2007.
Accepted on: 17-11-2018
Second Review by: Dr. Yanty Noorzianna Abdul Manaf (Malaysia)
Final Approval by: Prof. Jiwan S. Sidhu


Web of Science Coverage
Emerging Sources Citation Index (ESCI)
2024 Journal Impact Factor: 1.1
Scopus Journal Metrics
CiteScore 2025: 2.6
CiteScore Details
Sustainable Nutrition: Food Systems, Nutrient Retention, and Public Health Impact
![]()
This journal is a member of, and subscribes to the principles of, the Committee on Publication Ethics (COPE)


