Development of Chia (Salvia Hispanica, L.) and Quinoa (Chenopodium Quinoa, L.) Seed Flour Substituted Cookies- Physicochemical, Nutritional and Storage Studies
Jyoti Goyat1
, Sukhneet Suri3, 1Amity Institute of Food Technology, Amity University Uttar Pradesh, Noida, India, Pin code – 201301 2Public Health and Nutrition, Amity University Uttar Pradesh, Noida, India, Pin code – 201301 3Department of Food Technology, Vivekananda College, University of Delhi, New Delhi, India, Pin code - 110095.
Corresponding Author Email: duttahimjyoti@gmail.com
DOI : http://dx.doi.org/10.12944/CRNFSJ.6.3.18
Download this article as:
![]()
Cookie is a popular food medium for nutrient fortification. They are easy to prepare and carry, ready to eat products consumed by people of all age groups. Chia and quinoa seeds have attained recent scientific attention amongst consumers due to their potential health promoting effects. In this study, chia and quinoa seed flours were used to substitute refined wheat flour in cookie doughs at 5%, 10% and 15% substitution levels. Six composite cookies, coded as C-5%, C-10%, C-15%, Q-5%, Q-10% and Q-15% were prepared. Significant differences in physical, physicochemical and nutritional properties were observed. Diameter and spread ratio decreased due to increased fiber and protein content causing flour granulation. This also increased cookie hardness. Rise in the level of omega-3 fatty acid was evident from gas chromatography analyses. The developed cookies were rich in phenolics, flavonoids and antioxidants. Sensory analysis data indicated overall acceptability of all the substituted cookie samples to be above the level of 6 in a 9-point hedonic scale. Based on the identified sensory and nutritional attributes, C-10% and Q-15% were considered to be the best substituted samples. Both the cookies could be stored in sealed polypropylene pouches at room temperature for 60 days without any significant alteration in texture. Rancidity development was inhibited by chia and quinoa antioxidants. No microbial load was recorded in aqueous extracts of freshly prepared and after storage. Analysis of significant difference between all the results was carried out by Duncan’s multiple range tests at a significance level of 0.05. The present study indicated that chia and quinoa substituted cookies can be used as a protein, FFA and antioxidant enriched commercial product with better than average sensory properties.
KEYWORDS:Antioxidant; Chia; Cookies; Fatty Acids; Quinoa; Storage
Introduction
Elevated intake of high fat, energy-dense, low fiber foods and their detrimental effect on the human health has been a major concern. This has resulted in continuous development of consumers’ interest in health-enhancing functional foods. Benefits of several functional foods for prevention and treatment of chronic degenerative diseases have been clinically proven and documented.1 Functional food products have created a revolution in the global food market in the last decade. The products typically contain a number of bioactive components, primarily dietary fiber, omega- fatty acids, phytochemicals and other natural antioxidants.2 Due to their inherent compositional characteristics, the incorporated functional fractions exert effects on physicochemical, technological and nutritional status of the developed composite products. Besides, sensorial acceptability of the products immensely decides their marketability.
Chia (Salvia hispanica, L.) and quinoa (Chenopodium quinoa, L.) are two plants whose seeds possess novel functional and bioactive properties. Appreciably higher concentrations of nutrients and bioactive components make them ideal effective functional grains against physiological disorders like diabetes, hypertension, cardiovascular diseases and obesity.3 Chia is an annual herbaceous plant belonging to the Lamiaceae (Mint) family.4 It is native to Mexico and Guatemala. The seeds of the plant is a good source of polyunsaturated fatty acids (PUFA, up to 83% of extracted oil) with high concentration of omega-3 fatty acids, dietary fiber (34.4g/100g), total protein (16.54g/100g), minerals, and natural antioxidants.5,6 Chia seed has a high fat content of 25-40%, out of which omega-3 and omega-6 fatty acids constitute 68% and 20% of the total mass respectively.7 Quinoa (Chenopodium quinoa Willd) is a pseudo-cereal, belonging to the Chenopodium family. The plant is native to South America with its origin in Peru and Bolivia. Quinoa seeds are rich in high quality protein, dietary fiber and natural antioxidants. The oil content of quinoa seed varies from 2% to 10% and is rich in essential fatty acids, namely linolenic and α-linolenic acid.8,9 Chia and quinoa seeds also possess many important functional properties like oil and water holding, foaming and emulsifying capacity.6,7,8,9,10
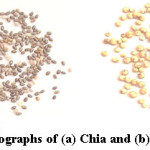 |
Figure 1: Photographs of (a) Chia and (b) Quinoa seeds |
Most of the existing studies involving substitution of chia and quinoa seeds as functional ingredients in food systems are on nutritional and sensorial characterization of the end products. Coorey et al., (2012) prepared a chip-like snack food by substituting rice and potato four with different proportions chia flour in its standard dough.11 A 5% substitution gave the best sensorial results with increased value of omega-3 fatty acids in the product. In another study, Coelho and Salas-Mellado (2015) substituted hydrogenated fat used in bread making with chia seeds and flour.12 The products showed significantly higher ratio of PUFA to saturated fatty acids and increased the levels of omega-fatty acids and fiber. Romankiewicz et al., (2017) found that up to 6% substitution of chia seeds could markedly improve the nutritional status and texture of wheat bread. However, the crumb color considerably darkened.13 Chia seeds in combination with flours of buckwheat and oat were used by Divyashree et al., (2016) and Inglett et al., (2014) to prepare dough formulae for biscuits and sweet cookies, respectively.14,15 Brito et al., (2014) developed gluten-free cookies using quinoa flour (30%), quinoa flakes (25%) and corn starch (45%). The composite cookies were found to be rich in essential amino acids, linolenic acids and minerals.16 Baked cereal products are generally chosen as ideal material over others owing to their wide consumer acceptance. However, developing a marketable product with potential health benefits requires thorough investigation of multiple product parameters. In this study, cookies developed by substituting wheat flour with different proportions of chia and quinoa seed flour were analyzed for optimum substitution ratio, their physical and physicochemical properties, proximate and nutritional status, sensory attributes and product stability upon storage.
Materials and Methods
Imported chia and quinoa seeds cultivated in Peru and Bolivia respectively were procured from the markets of Delhi, India. The seeds were milled in a grinder (Philips, India) before passing through a 210 m sieve. A multipurpose bakery flour was purchased from a local wheat mill. Food grade bakery ingredients, namely shortening (trans fat free), refined powdered sugar, sodium chloride, lecithin, butylated hydroxy toluene and vanilla flavor were purchased from reliable commercial sources. All the chemicals, reagents and media were procured from Himedia and Sigma-Aldrich.
Cookie Preparation
The control short dough cookies were prepared using the basic formula and method described by Handa et al., (2012) with slight modification.17 Forty grams of refined sugar powder (< 250 m) was mixed with 32 g shortening and whipped vigorously for 10 minutes in a hand mixer fitted with a whipper (HM01, Bajaj, India). Butylated Hydroxy Toluene (0.02 g) and flavor (0.5 mL) were then added to the cream and mixed again for 2 minutes. To this cream, 100 g refined wheat flour, 0.8 g sodium chloride, 0.4 g sodium bicarbonate and 0.2 g ammonium bicarbonate were added. Fourteen milliliter distilled water was slowly added within a minute while the dough was being kneaded for 7 minutes. After resting for 5 minutes, the dough was sheeted with a rolling pin to 0.60±0.05 cm thickness and cut using a round shaped cookie cutter with 4.5 cm internal diameter. The cut cookies were placed on a greased baking tray and baked at 190 °C for 13 minutes in a commercial single trolley rotary rack oven (Pritul Machines, India). The baked cookies were cooled for 2 h at room temperature (RT, 27±2 °C), sealed in biaxially oriented poly propylene pouches and stored at 4 °C for further analyses. For preparing the composite flour cookies, 5%, 10% and 15% of the refine wheat flour were replaced by chia and quinoa seed flour. The substituted flour cookie samples were coded as C-5%, C-10%, C-15% and Q-5%, Q-10% and Q-15% for chia and quinoa flour substitution, respectively. The rest of the process for preparing composite cookies was kept same as described for preparing the control sample.
Physical Properties
Spread Ratio and Weight
The diameter (D) and thickness (T) in mm of the cookies was measured using a Vernier Caliper (Fischer scientific, USA) to calculate the spread ratio (SR).
SR = D/T
The weight in gram (W) of the cookies was noted using a digital weighing balance (Sartorius, Germany).
Texture Analysis
A texture analyzer (TA.XT plus, Stable Microsytems, Surrey, UK) equipped with a 50 Kg load cell and fitted with a 5 mm cylindrical probe was used for measuring hardness of the cookies. Penetration of 3 mm at 0.5 mm/s crosshead speed at the centre of the cookie was performed. The average peak force required for complete breakage of each cookie was recorded as its hardness (H, Kg).
Chemical Properties
Proximate Analysis
Cookie samples were manually ground using a mortar and pestle and the powders were passed through a 210 m sieve. The wet basis proximate compositional analyses (wb), namely moisture, crude protein, crude fat and ash contents of the seed flours, control cookie and composite flour cookie samples were measured using standard protocols (AACC, 2000) and expressed in percentage.18 Total carbohydrate was calculated as the percentage difference in sample mass to the cumulative of the other components.
Carbohydrate (%, wb) = 100 – [Moisture (%) + Crude protein (%) + Crude fat (%) + Ash (%)]
Fiber Content
Chia and quinoa seed powders, control and composite cookie powders were tested for their total dietary fiber contents (AOAC, 2000) using a total dietary fiber assay kit (Sigma–Aldrich, USA).19 Results were expressed as percentage dry weight of the fibers in the samples.
Minerals
Minerals, namely iron (Fe), sodium (Na), calcium (Ca), Magnesium (Mg), potassium (K) and zinc (Zn) were quantified using an atomic absorption spectrophotometer (AAS, iCE 3000, Thermofisher, USA). Digestion of samples was carried out using nitric acid in a microwave-assisted digestion system (Multiwave Eco, Anton Paar, India) running at 600 W for 15 minutes. Phosphorus was estimated using a spectrophotometric technique.19 Standard solutions and analytical curves were used for each element and the results were expressed in milligrams of the mineral per 100 g of sample.
Fatty Acid Composition
Fat was extracted from the powdered samples using petroleum ether (boiling point = 60 °C) in a soxhlet apparatus (SOCS Plus, Pelican Instruments, India). Extracted fat was saponified and esterified using methanolic KOH and methanolic HCl solutions respectively. The fatty acid methyl esters were then separated in a gas chromatography unit (7890A, Agilent Technologies, USA) fitted with a fused silica capillary column (HP-88,100 m´ 2.250 mm´ 2.0 µm) and a flame ionization detector (FID). The injector and detector temperature limits were 20 °C and 250 °C respectively. For fatty acid identification, the retention times were compared to those obtained for standard fatty acid methyl esters. Composition of each fatty acid in the fat sample was expressed as relative peak intensity in the chromatogram.
Bioactive Characterization
One gram each of the defatted cookie powders were extracted for bioactive compounds using 10 mL of 80% ethanol at room temperature for 3 h under constant agitation. The extracts were subjected to estimation of total phenolics (TPC), flavonoids (TFC) and antioxidant assays.20
Total Phenol Content (TPC)
Total phenols were estimated spectrophotometrically using Folin-Ciocalteu reagent (FCR).21 Briefly, to 100 µL of ethanolic extract, 2.9 mL of deionised water, 0.5 mL of Folin-Ciocalteu reagent and 2.0 mL of 20% Na2CO3 solution were added. After thorough mixing, the mixture was allowed to stand for 60 minutes and absorption was measured at 760 nm in a UV-Vis spectrophotometer (Varian Cary 50, Agilent, USA) against reagent blank. Results were expressed as ferulic acid equivalent per 100 g sample (mg FAE/100 g).
Total Flavonoid Content (TFC)
TFC was estimated spectrophotometrically according to the Dewanto et al., (2002).22 To 1 mL of sample extract, 0.3 mL of 5% w/v sodium nitrite solution was added. After a gap of 5 minutes, 0.3 mL of 10% AlCl3 (w/v), and after 6 minutes, 2 mL of 1 M NaOH solution were added. This was followed by addition of 6.4 mL distilled water to make a final volume of 10 mL and mixing in a vortex shaker. Absorbance was noted at 510 nm against water blank. The TFC results were expressed as quercetin equivalents/100g of sample.
Cupric Reducing Antioxidant Capacity (CUPRAC)
CUPRAC was determined by the method described by Apak et al (2004).23 Briefly, 0.1 mL of sample extract was mixed with 1 mL each of CuCl2 solution (1.0 X 10⁻² mol L-1), neocuproine alcoholic solution (7.5´ 10-3 mol L-1), ammonium acetate (NH₄CH₃CO₂, 1 mol L-1, pH 7.0) buffer solution and 1 mL of water to make the final volume 4.1 ml. After 30 minutes, absorbance was recorded at 450 nm against a reagent blank. Standard curve was prepared using different concentrations of trolox reagent and the results were expressed as micromolar trolox equivalent per gram (mmol TE g-1), considering molar absorptivity of trolox as 1.67´ 104 L mol-1 cm-1.
Ferric Reducing Antioxidant Potential (FRAP)
Ferric reducing ability of aqueous cookie sample extract was estimated spectrophotometrically using FRAP reagent mixture [FeCl3, TPTZ (2,4,6 tripyridyl-s-triazine)] and acetate buffer (pH 3.6) in the ratio of 1:1:10 respectively. To 100 uL extract in distilled water (1:10, w/v), 3 mL FRAP reagent was added. Absorbance of the blue colored solution was recorded at 593 nm against FRAP reagent blank after 4 minutes. Results were expressed as µmol trolox per gram.24
Sensory Evaluation
Sensory acceptability of the cookie samples was evaluated amongst a panel of thirty semi-trained panelists. Quality attributes, namely color, texture, appearance, flavor and over-all acceptability (OAA) were evaluated. The evaluators were female post graduate level students of Amity Institute of Food Technology, ranging from 19 to 22 years in age. Each panelist had primary idea on cookies and composite cookies. The evaluation procedure was explained to panelists. A 9- point hedonic rating scale anchored by ‘dislike extremely’ and ‘like extremely’ was used. The test was conducted in midmorning after a 4 h gap from breakfast. Cookie samples were presented randomly to the panel members and sufficient time was given to avoid any misinterpretation. Water was provided to rinse the mouth after each sample was evaluated. The best composite cookie samples were identified based on their sensorial acceptability and studied further for storability at room temperature conditions.
Storage Study
Cookies were packed in biaxially oriented poly propylene pouches and kept under ambient conditions. Cookies were evaluated for shelf life by estimating moisture content, water activity, free fatty acids, peroxide value, microbiological quality and sensory evaluation at the regular intervals of 0,30 and 60 days.
Moisture Content and Water Activity
Moisture content was measured using an oven drying method.19 Water activity (aw) of freshly powdered cookie samples was measured at 25±0.5 °C using a water activity meter (Rotronic, Switzerland) with HC2-AW.-USB probe. Data was collected from the connected computer with installed HW4-P-QUICK-Vx software for aw measurement.
Peroxide Value and Free Fatty Acid
Fat autooxidation resulting in development of rancidity is an important parameter for storage study of food products. Increased peroxide value (PV) and liberation of free fatty acids (FFA) are the most common indication of fat oxidation. To measure these, fat was extracted from the cookie powder by a continuous cold solvent extraction method using chloroform.25 Peroxide value (PV, meq O2/kg fat) was determined by mixing fat sample with a diluted acidic potassium iodide solution and titrating against a 0.1 M sodium thiosulfate using starch indicator. Free fatty acids (FFA, % oleic acid by mass) of the extracted fat was determined by titrating sample with potassium hydroxide using phenolphthalein indicator.19
Microbiological Analysis
Total plate count (TPC), yeast and moulds count and existence of Salmonella, Escherichia coli, Staphylococcus aureus and Bacillus cereus in aqueous extracts of the stored cookie samples were analyzed using standard methods described in the manual of the Food and Agriculture Organization, United Nations.26
Statistical Analysis
All the experiments were carried out in multiple replicates. Significant differences between mean values for each parameter was determined by Duncan’s multiple range tests carried out at a significance level of 0.05 using the statistical package for the social sciences (SPSS 11.5, USA).
Result and Discussion
Physical Characteristics of Cookies
Photographs of control and composite cookie samples are presented in Figure 2. Addition of chia a quinoa flours in different ratio to the cookie dough caused notable changes in the physical properties (Table 1). Significant difference was observed between diameters of control and chia and quinoa flour substituted cookies. There occurred slight decrease in thickness and corresponding spread ratio. The results were in conformity with Makpoul and Ibrahem (2015).27 A linear decrease was noted in both diameter and thickness of the cookies with increasing levels of substitution. Simultaneous increase in cookie weight could be attributed to higher fiber content of chia and quinoa flour.28 The results could be related with higher moisture retention capacity and lesser spreadability of chia and quinoa seed fibers. Increased oxidized protein level on baking also may inhibit cookie spread by forming strong and rigid networks in the dough matrix.29 Composite flours often form macromolecular aggregates resulting from enhanced hydrophilic sites competing for the limited free water available in the cookie dough.30 The higher flour density in the composite cookie samples also resulted in significant increase in hardness from the control sample. The replacement of wheat flour with the two gluten-free flours could reduce the strainability of the cookies, thereby increasing its hardness.
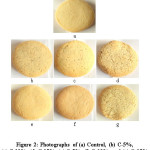 |
Figure 2: Photographs of (a) Control, (b) C-5%,(c) C-10%, (d) C-15%, (e) Q-5%, (f) Q-10%, and (g) Q-15% |
Table 1 : Physical Quality Parameters of the Control and Composite Cookie Samples
| Samples | W (g) | D (mm) | T (mm) | SR (D/T) | H (Kg) |
| Control | 7.7±0.07 a | 48.78±0.37 d | 13.38±0.02 f | 3.64±0.01 f | 68.34±0.10 a |
| C-5% | 8.19±0.04 c | 47.78±0.14 cd | 13.22±0.06 d | 3.61±0.01 e | 69.08±0.38 b |
| C-10% | 8.32±0.03 e | 47.22±0.67 bc | 13.10±0.13 bc | 3.59±0.06 d | 78.25±0.24 e |
| C-15% | 9.3±0.05 g | 46.34±0.07 a | 12.98±0.07 a | 3.56±0.01 a | 80.22±0.11 f |
| Q-5% | 8.08±0.08 b | 47.57±0.33 cd | 13.28±0.02 e | 3.57±0.01 b | 68.37±0.16 a |
| Q-10% | 8.30±0.03 d | 47.27±0.71 bc | 13.16±0.06 c | 3.58±0.04 c | 72.39±0.19 c |
| Q-15% | 8.61±0.11 f | 47.14±0.61 b | 13.10±0.10 bc | 3.59±0.07 d | 76.18±0.07 d |
Means followed by the same letter in a column do not differ significantly from one another (P > 0.05).
Nutritional Composition of Cookies
Proximate and mineral compositions and chia and quinoa seed flours and the cookie samples are given in Table 2. Partial replacement of wheat flour with chia flour and quinoa flour notably decreased the moisture content of the cookies as compared to the control. The higher water molecule retention capacity of the flours resulting in lesser free moisture availability could be attributed for this.31 Fat content of chia flour was found to be 56.35 g/100g, which was unexpectedly higher than the range of 32-37 g/100g reported by previous authors.32,33 This may be the result of differences in growing conditions. However, no significant increase in the fat content of chia substituted cookies was observed. This may be due to strong oil binding capacity of chia seed fibers would have interfered with the soxhlet fat extraction process, resulting in the incomplete extraction of the oil.11 Linear increase in protein and fiber content of the developed cookies with increasing substitution level was observed. Calcium, iron and zinc content of cookies significantly increased with increased addition of chia and quinoa seed flours. Therefore, the composite cookies can be considered as richer in fibers, proteins and minerals.
Fatty Acid Analysis
Table 3 shows the fatty acid composition of chia and quinoa flours and the seven cookie samples. The values depict that principal proportion of the detected oleic acid was in the shortening used for cookies than chia and quinoa flours. As expected from the higher composition of the chia flour, its substitution in the cookies significantly increased the alpha linolenic acid than quinoa flour substituted cookies. Linolenic acid substantially increased in both chia and quinoa incorporated samples. Oleic acid decreased in chia cookies, while increased in the quinoa cookies. The stability of oleic acid in the later needs further research. Considering the results obtained from the present study, the daily recommended intake of alpha linolenic acid can be fulfilled by the chia seed flour substituted cookies.
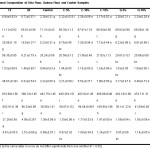 |
Table 2: Nutritional Composition of Chia Flour, Quinoa Flour and Cookie Samples |
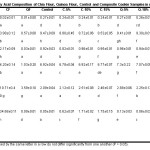 |
Table 3: Fatty Acid Composition of Chia Flour, Quinoa Flour, Control and Composite Cookie Samples in mg/100g |
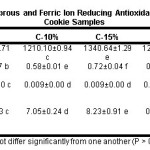 |
Table 4: Total Phenolics, Flavonoids and Cuprous and Ferric Ion Reducing Antioxidant Activity Values of Control and Composite Cookie Samples |
Bioactive Properties
Significant increase in TPC and TFC values were observed after substitution and with increasing levels of chia and quinoa seed flours in the cookies (Table 4). This suggested stability of the phenolic and flavonoid compounds to baking. Antioxidant activities of the cookies, as shown by the CUPRAC and FRAP values, also simultaneously increased. This was in accordance with the report by Demir and Kilinc (2017).34 The results indicate that both the seeds can be effectively used to enhance antioxidant potential of baked composite cereal products.
Sensory Evaluation of Cookies
Results of sensory characteristics of control cookie and chia and quinoa flour substituted cookie samples recorded on the 0th, 30th and 60th day of packaged storage at RT are presented in Figure 3. Scores for color, taste, texture, aroma and OAA exhibited gradual fall with increased substitution levels of the flours. However, all the values were above the scale of 6 and could be considered acceptable. The control cookies were pale yellow in color and had a score of 8.43 on 9 point hedonic rating scale and it decreased to 7.13 in C-15%, which may be due to the black color of chia seeds. Quinoa seed flour incorporated cookies gave higher values of color. Texture of C-15% was much harder than the other samples. Values of the sensory parameters of cookies at the 60th day of storage were found to be slightly reduced but within the acceptable levels. Therefore, the cookies were stable chemically and sensory up to 60 days of storage when stored in polypropylene pouches. The OAA scores of cookies showed that C-10% and Q-15% were the composite cookies samples had the highest sensorial acceptability. These two samples were carried forward for storage analyses.
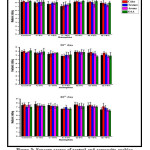 |
Figure 3: Sensory scores of control and composite cookies samples on 0th, 30th and 60th day of storage |
Storage Study of Cookies
Moisture and water activity plays an important role in the storage of cookies. There was a minor increase in moisture content of cookies from 0th day to 60th day (Table 5). This increase in moisture could be related to the general hygroscopic nature of the packed cookies. Nature of packaging material and its porosity plays important role in deciding moisture uptake. Rao et al., (1995) reported that stored biscuits packed in metalized polyester or biaxially oriented poly propylene exhibit higher moisture content than those packed in paper- aluminum foil polyethylene laminate pouches.35 Cookies packed in laminate pouches absorbed lesser moisture during storage which might have been due to the impervious nature of aluminium foil in the laminate to air and water vapour. The similar results of increased moisture content of cereal bran incorporated biscuits at the end of 60 days of storage were noted by Nagi et al., (2012).36 A corresponding rise in aw value in both cookie samples was also observed. Significant increase in SV was observed to occur during storage of cookie samples. In packed products, the rate of auto oxidation is mainly governed by the oxygen retention in the pack, which in turn is related to the headspace and oxygen permeability of the packaging material.37 Divyashree et al., (2016), reported similar results for change in PV during storage of buckwheat–chia flour biscuits.14 Simultaneously, FFA content was found to increase, which is also attributed to increased moisture content. Moisture promotes hydrolytic rancidity development.38 However, presence of antioxidants often result in lower rancidity development. Both C-10% and Q-15% exhibited lower values of PV and FFA than control sample on 30th and 60th day of storage owing to bioactive composition in them. According to ISI specifications (IS:7487), a maximum FFA of 1.5% can be considered acceptable for high protein biscuits. FFA of all cookies was within the range. Microbial count for TPC, yeast and mold, E.coli, S. aureus, B. cereus and salmonella was remains undetected. This suggests that microbial quality of cookies during storage of 60 days remained good.
Table 5: Moisture, Water Activity, Peroxide Value, Free Fatty Acid and Oleic Acid Values of Control, C-10% And Q-15% Samples as Recorded on 0th, 30th And 60th day of Storage
| Storage parameters | 0th Day | 30th Day | 60th Day | |
| Moisture content (%, wb) | Control | 2.38±0.13 a | 3.35±0.09 b | 4.60±0.19 c |
| C-10% | 2.28±0.09 a | 3.08±0.12 b | 4.45±0.15 c | |
| Q-15% | 2.19±0.20 a | 3.26±0.13 b | 4.53±0.11 c | |
| aw | Control | 0.43±0.03 a | 0.48±0.21 b | 0.50±0.04 c |
| C-10% | 0.41±0.01 a | 0.46±0.19 b | 0.47±0.08 b | |
| Q-15% | 0.42±0.09 a | 0.47±0.12 b | 0.48±0.17 b | |
| PV (meq O2/kg) | Control | 0.94±0.02 a | 7.23±0.17 b | 20.12±0.23 c |
| C-10% | 0.89±0.18 a | 5.61±0.19 b | 9.56± 0.02 c | |
| Q-15% | 0.88±0.11 a | 6.98±0.07 b | 12.49±0.27 c | |
| FFA | Control | 0.31±0.23 a | 0.44±0.01 b | 0.5 2±0.16 c |
| C-10% | 0.34±0.04 a | 0.37±0.09 b | 0.4 3±0.21 c | |
| Q-15% | 0.32±0.01 a | 0.39±0.06 b | 0.4 6±0.01 c | |
| Oleic acid (%) | Control | 0.31±0.23 a | 0.44±0.01 b | 0.5 2±0.16 c |
| C-10% | 0.54±0.04 a | 0.67±0.09 b | 0.7 3±0.21 c | |
| Q-15% | 0.32±0.01 a | 0.43±0.06 b | 0.7 7±0.01 c |
Mean values with different letters following them are significantly different from one another (P > 0.05).
Conclusion
Chia and quinoa seed flours were successfully incorporated in cookies by partially substituting wheat flour. Substitution of 10% chia and 15% quinoa seed flour resulted in the cookies with best sensory acceptability and high nutritional quotient. Substitution resulted in marked increase in protein, dietary fiber, polyunsaturated fatty acids, minerals and bioactive compounds. Increase in phenolic and flavonoid compounds was evident. The standardized cookies could be stored under packaged conditions for 60 days at ambient temperature without any notable deterioration in texture and microbiological safety. Development of rancidity in the cookies after prolonged storage, which is principally related to oxidation of shortenings was inhibited by antioxidant rich chia and quinoa incorporation. Chia and quinoa seed flours can be suitably used to develop cookies with enhanced nutritional property and storage stability.
Acknowledgements
The principal author acknowledges University Grants Commission (UGC), Government of India for awarding Senior Research Fellowship to carry out this research.
Conflict of Interest
The authors do not have any conflict of interest with any person or organization in publishing this article.
References
- Pang G., Xie J., Chen Q., Hu Z. How functional foods play critical roles in human health. Food Science and Human Wellness. 2012;1(1):26-60.
CrossRef - Al-Sheraji S. H., Ismail A., Manap M. Y., Mustafa S., Yusof R. M., Hassan F. A. Prebiotics as functional foods: a review. Journal of Functional Foods. 2013;5:1542-1553.
CrossRef - Rendon-Villalobos J. R., Ortiz-Sanchez A., Flores-Huicochea E. Nutritionally Enhanced Foods Incorporating Chia Seed. Therapeutic Foods. 2017;23:257.
- Ixtainaa V. Y., Nolasco S. M.,Tomas M. C. Physical properties of Chia (Salvia Hispanica L.) seeds. Journal of Industrial crops and products. 2008;28(3):286-293.
- Giaretta D., Lima V. A., Carpes S. T. Improvement of fatty acid profile in Breads supplemented with Kinako flour and chia seed. Innovative Food Science and Emerging Technologies. 2017.
- Ayerza R., Coates W. Protein content, oil content and fatty acid profiles as potential criteria to determine the origin of commercially grown chia (Salvia hispanica, L.). Journal of Industrial Crops and Products. 2011;34:1366-1371.
CrossRef - Jacobsen S. E. The Worldwide Potential for Quinoa (Chenopodium quinoa Willd).Food Reviews International. 2003;19(1-2):167-177.
CrossRef - Bhathal S. K., Kaur N. Nutritional analysis of gluten free products from quinoa (Chenopodium quinoa) flour. International Journal of Pure and Applied Biosciences. 2018;6(2):826-836.
- Filho A. M., Pirozi M. R., Borges Da Silva J. T., Pinheiro Sant’Ana H. M., Paes Chaves J. B., Reis Coimbra J. S. Quinoa: nutritional, functional and antinutritional aspects. Critical Reviews in Food Science and Nutrition. 2015;57(8):1618-1630.
CrossRef - Abogoch James L. E. Quinoa (Chenopodium quinoa): composition, chemistry, nutritional and functional Properties. Advances in Food and Nutrition Research. 2009;58:1-31.
- Coorey R., Grant A., Jayasena V. Effects of chia flour incorporation on the nutritive quality and consumer acceptance of chips. Journal of Food Research. 2012;1(4):85-95.
CrossRef - Coelho M. S., Salas-Mellado M. M. Effects of substituting chia (Salvia hispanica) flour or seeds for wheat flour on the quality of the bread. LWT- Food Science and Technology. 2015;60(2):729-736.
CrossRef - Romankiewicz D., Hassoon W. H., Cacak-Pietrzak., Slbczyk M. Wirkowska-Wojdyla M, Ceglinska A. and Dziki D. The effect of chia seeds (Salvia hispanica L.) addition on quality and nutritional value of wheat bread. Journal of Food Quality. 2017.
CrossRef - Divyashree., Kumar A., Sharma G. K., Semwal A. D., Umesha. Development and storage stability of buckwheat-chia seeds fortified biscuits. International Journal of Food Fermentation Technology. 2016;6(1):95-106.
CrossRef - Inglett G. E., Chen D., Liu S. Physical properties of sugar cookies containing chia-oat composites. Journal of the Science of Food and Agriculture. 2014;94(15):3226-3233.
CrossRef - Brito I. L., Evandro L. D. S, Felex S. S., Madruga M. S., Yamashita F., Magnani M. Nutritional and sensory characteristics of gluten-free quinoa (Chenopodium quinoa Willd) based cookies development using an experimental mixture design. Journal of Food Science and Technology. 2015;52(9):5866-5873.
CrossRef - Handa C., Goomer S., Siddhu A. Physiochemical properties and sensory evaluation of fructoligosaccharide enriched cookies. Journal of Food Science and Technology. 2014;49(2):192-199.
CrossRef - Approved methods of the Association of Cereal Chemists International. 10th St. Paul, Minnesota, 2000.
- Official Methods of Analysis. AOAC. 17th Washington DC, 2012.
- Rudra S. G., Jakhar N., Nishad J., Saini N., Sen S., Bhardwaj R., Jaiswal S., Suneja P., Singh S., Kaur C. Extrusion conditions and antioxidant properties of sorghum, barley and horse gram based snack. Vegetos- An International Journal of Plant Research. 2015;28(2):171-182.
CrossRef - Singleton V. L., Orthofer R., Lamuela-Ranventos R. M. Analysis of total phenols other oxidation substrates and antioxidant by means of folin-ciocalteau reagent. Methods in Enzymology. 1999;299:152-178.
CrossRef - Dewanto X. Z., Wu A. K. K., Liu R. H. Thermal processing enhances the nutritional value of tomatoes by increasing total antioxidant activity. Journal of Agricultural and Food Chemistry. 2002;50:3010-3014.
CrossRef - Apak R., Guclu K., Ozyurek M., Karademir S. E. Novel total antioxidant capacity index for dietary phenols and vitamins C and E, using their cupric ion reducing capability in the presence of neocuproine: CUPRAC method. Journal of Agricultural and Food Chemistry. 2004;52:7970-7981.
CrossRef - Benzie I. F. F., Strain J. J. The ferric reducing ability of plasma (FRAP) as a measure of ‘antioxidant’ power: The FRAP Assay. Analytical Biochemistry. 1996;239:70-76.
CrossRef - Briones-Labarca V., Plaza-Morales., M Giovagnoli-Vicuna C., Jamett F. High hydrostatic pressure and ultrasound extractions of antioxidant compounds, sulforaphane and fatty acids from Chilean papaya (Vasconcellea pubescens) seeds: effects of extraction conditions and methods. LWT-Food Science and Technology. 2015;60(1):525-534.
CrossRef - Andrews W. Manual of the Food and Agriculture Organization. 1992. United Nations.
- Makpoul K. R., Ibrahem A. A. Improving biscuit nutritional value using quinoa flour. Journal of Food and Dairy Science. 2015;6(12):771-780.
- Singh S., Riar C. S., Saxena D. C. Effect of incorporating sweet potato flour to wheat flour on the quality characteristics of cookies. African Journal of Food Science. 2010;2:65-72.
- Yamsaengsung R., Berghofer E., Schoenlechner R. Physical properties and sensory acceptability of cookies made from chickpea addition to white wheat or whole wheat flour compared to gluten-free amaranth or buckwheat flour. International Journal of Food Science and Technology. 2012;47:2221-2227.
CrossRef - Baljeet S. Y., Ritika B. Y., Roshan L. Y. Studies of functional properties and incorporation of buckwheat flour for biscuit making. International Food Research Journal. 2010;17:1067-1076.
- Mesias M, Holgado F, Marquez-Ruiz G and Morales FJ. Risk/benefit considerations of a new formulation of wheat-based biscuit supplemented with different amounts of chia flour. LWT-Food Science and Technology. 2016;73:528-535.
CrossRef - Bushway A. A., Belyea P. R., Bushway R. J. Chia seeds as a source of oil, polysaccharide, and protein. Journal of Food Science. 1981;46(5):1349-1350.
CrossRef - Coates W., Ayerza R. Commercial production of chia in Northwestern Argentina. Journal of the American Oil Chemists’ Society. 1998;75:1417-1420.
CrossRef - Demir M. K., Kilinc M. Utilization of quinoa flour in cookie production. International Food Research Journal. 2017:24(6):2394-2401.
- Rao T. S. S., Ramanuja M. N., Ashok N., Vibhakar H. S. Storage properties of whole egg powder incorporated biscuits. Journal of Food Science and Technology.1995;32:470-476.
- Nagi H. P. S., Kair J., Dar B. N., Sharma S. Effect of storage period and packaging on the shelf life of cereal bran incorporated biscuits. American Journal of Food Technology. 2012;7(5):301-310.
CrossRef - Khan M. A., Semwal A. D., Sharma G. A., Yadav D. N., Shrihari K. A. Studies on the development and storage stability of groundnut (Archis hypogea) Journal of Food Quality. 2008;31:612-626.
CrossRef - Singh R., Singh G., Chauhan G. S. Development of soy fortified biscuits and shelf life studies. Journal of Food Science and Technology. 2000;37:300-303.
Accepted on: 06-12-2018
Second Review by: Dr.Abdelazim Sayed (Egypt)
Final Approval by: Prof. Min-Hsiung Pan


Web of Science Coverage
Emerging Sources Citation Index (ESCI)
2024 Journal Impact Factor: 1.1
Scopus Journal Metrics
CiteScore 2025: 2.6
CiteScore Details
Sustainable Nutrition: Food Systems, Nutrient Retention, and Public Health Impact
![]()
This journal is a member of, and subscribes to the principles of, the Committee on Publication Ethics (COPE)


