Acceptance and Satisfaction on Thai Ethnic Foods Using the Protein-Free Starchy Products
Narisa Rueangsri*
, Alongkote Singhato Faculty of Allied Health Sciences, Burapha University,
Bang Saen, Chonburi 20131, Thailand.
Corresponding Author Email: narisa.nr@gmail.com
DOI : http://dx.doi.org/10.12944/CRNFSJ.6.3.27
Download this article as:
![]()
High prevalence of chronic kidney disease has been reported in Thailand, and patients with this chronic disease need to restrict their dietary protein intakes because of their low glomerular filtration rate, including those from rice and starch. Unfortunately, there is a lack of protein-free starch available in Thai communities. Therefore, this study aimed to develop protein-free starchy products that were used as ingredients in Thai ethnic food menus. Five menus (Pad See Ew, Rad Na, Pad Thai, Kuay Jub, and Pad Kee Mao) incorporating the developed protein-free starchy products (with 3 formulae using the developed starchy products and 1 original formula per menu) were developed for conducting the sensory evaluation by 48 healthy participants. Results revealed all menus showed significant difference of satisfaction scores on food texture (p<0.05). In addition, Pad Se Ew, Pad Thai (formula 1), and Pad Kee Mao (all formulae) had the overall satisfaction scores at acceptable level. In conclusion, most of the Thai ethnic food menus made from the developed protein-free starchy products were acceptable to participants.
KEYWORDS:Protein-Free Starch; Sensory Evaluation; Thai Ethnic Food
Introduction
High prevalences of Non-Communicable Diseases (NCDs) have been reported in many countries which reduce the quality of life of patients and increase mortality rate.1,2 It is well known that patients with NCDs are affected by long term unhealthy dietary habits and inadequate physical activity.3 They need to restrict their diet and aware of dietary planning according to the suggestions from professionals in health care to maintain their optimal health status. Chronic Kidney Disease (CKD) is one of NCDs most commonly found in Thailand.4 It is the condition that reduces the ability of kidney in performing the filtration of plasma filtrate leading to the accumulation of waste products in human body. Patients with CKD, especially at the End Stage of Renal Disease (ESRD) with low glomerular filtration rate (GFR) are usually suggested to restrict consumption of many nutrients such as potassium, sodium, phosphorus, and protein.5 For protein, CKD patients with ESRD are suggested to lower intake of protein by 0.3-0.4 g per kilogram of body weight6; therefore they need to restrict intakes of food sources rich in protein such as meat, poultry, and dairy products in order to regulate the amounts of urea and nitrogen in blood.7 Moreover, rice and starchy products are also considered as foods containing proteins that should be of concern when giving a dietary planning for patients who need to strictly limit the amount of protein intake.8,9
Thai people usually eat copious amount of rice as a staple food. In addition, it was found that proteins are also present in several foods that are the carbohydrate-based food, such as Thai traditional starchy products, i.e., rice vermicelli, rice stick noodles, wide rice noodles, etc., which are made from rice flour and they are used in the cookings of Thai traditional food menus that are commonly consumed among Thai people. Thus, almost of the Thai traditional starchy products (TTSP) are reported to contain proteins.10-12 This means patients who intake Thai food menus using TTSP as ingredient receive excessive dietary proteins from both meat and starchy products. In CKD patients with low GFR are advised to strictly regulate the amount of protein intake to prevent uremia and to maintain their health status.13 Unfortunately, there are limited food choices available in Thai communities, especially with regard to carbohydrate-based food which is protein-free that can be used in the cookings of the Thai traditional and ethnical food menus which are familiar and acceptable to people. This study, therefore, aimed to develop the Thai ethnic food menus made from the developed non-protein starchy products, and investigates their acceptability and satisfaction among Thai people.
Materials and Methods
Survey on the most acceptable and popular Thai ethnic foods made from starchy products
Thai ethnic foods to be used as the tested samples developed from protein free-starchy products were selected by questionnaires which included the list of Thai ethnic foods commonly consumed in the community and easily produced in household cooking. A total of 512 participants were asked to choose their most favorite Thai ethnic foods from questionnaires.14 The top 5 most selected menus chosen as the food samples were Pad See Ew (fried noodle with pork with soy sauce), Rad Na (fried noodle with pork and kale soaked in gravy), Pad Thai (fried noodle Thai style with pork), Kuay Jub (crunchy pork soup), and Pad Kee Mao (spicy stir-fried flat noodle with pork and holy basil leaves) (Fig 1).
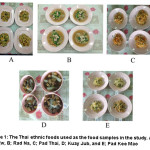 |
Figure 1: The Thai ethnic foods used as the food samples in the study. A; Pad See Ew, B; Rad Na, C; Pad Thai, D; Kuay Jub, and E; Pad Kee Mao |
Development of Protein Free-Starchy Products and Food Samples
The top 5 most selected food menus using the developed protein-free starchy products were prepared at the Clinical Nutrition Laboratory, Faculty of Allied Health Sciences, Burapha University, Bangsaen, Thailand. The developed protein-free starchy products were used in the cooking of 3 formulae for each menu based on the different amounts of tapioca flour so that the participants’ satisfactions on these formulae could be compared with the original formula (commercial product). Pad See Ew (PSE); Stir fried flat noodle and pork with preserved soy bean paste, Rad Na (RN); Noodles in Thick Gravy, Pad Thai (PT); Fried noodle Thai style with pork, Kuay Jub (KJ); Boiled Chinese pasta square, and Pad Kee Mao (PKM); Spicy stir fried flat noodle with prawn and holy basil leaves were cooked as formulae 1, 2, and 3 with 25%, 50% and 75%, respectively, of tapioca flour which were protein free. All recipes and cooking methods were conducted according to the Thai cooking handbook.15
Development of Sensory Evaluation Questionnaires
Seven-level hedonic-scaled questionnaires were developed to ask participants’ sensory satisfaction towards the developed Thai ethnic foods made from the protein-free starchy products (Fig 2). Six questions addressed on participants’ satisfaction on foods’ appearance, taste, flavour, colour, texture, and overall satisfaction. The scorings for the questionnaire scales were: very much liked=6 points, liked a lot=5 points, liked=4 points, liked and did not liked= 3 points, disliked= 2 points, much disliked= 1 point, very much disliked= 0. Food samples which the mean of overall satisfaction scores >4.0 were considered as acceptable to participants.16
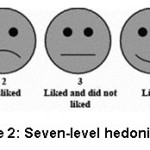 |
Figure 2: Seven-level hedonic scale |
All developed questionnaires were reviewed and revised by experts in nutrition at the Institute of Nutrition, Mahidol University. The revised questionnaires, information on the amount of ingredients in food samples, and study protocols were ethnically approved by the Burapha University Institutional Review Board (BUU-IRB). All participants signed the informed consent forms before participating in this study.
Selection of Panelist for the Sensory Analysis
This study was conducted at the Faculty of Allied Health Sciences, Burapha University, Bang Saen Campus. Forty-eight participants were recruited by following inclusion criteria: no medical history on food allergy, both male and female with age between 20-60 years, can read and write Thai. Exclusion criteria include: having a medical condition affecting to sensory perception, medical history of colour blindness, suffering from oral problems, pregnancy or lactating, having a medical history of a non-communicable disease.
Sensory Analysis
All the protein-free-starchy products and cookings of the selected menus were prepared at the Clinical Nutrition Laboratory, Faculty of Allied Health Sciences, Burapha University. All 5 menus were prepared from starchy products as 4 formulae per each menu (3 formulae using protein-free starch and 1 original formula). Once completed, all participants were invited to the prepared room for conducting the sensory evaluation to determine their acceptance and satisfaction on the appearance, taste, flavour, colour, texture, and overall satisfaction. The blinded samples of 5 menus (4 samples per menu) were served to each participant. Water and paper blots were prepared on a plastic tray, and participants were asked to take the whole sample and also asked to rinse their mouths with water between samplings.
Data Analysis
The acceptance and satisfaction scores of participants were reported as means using the One-Way ANOVA to compare the difference of the scores. Statistical analysis was performed by using the Predictive Analytics Software Statistic (PASW) version 22 (SPSS Inc, Chicago, Il). Statistical significance was established at p<0.05.
Results and Discussion
Baseline data of participants
Most of the participants (90%) were female with an average age of 39.83 years old. None of the participants was reported to have a food allergy and medical history of current illness (Table 1).
Table 1: Baseline Data of the Participants
| Characteristics | Outcome |
| SexMale, n (%)Female, n (%) | 5 (10)43 (90) |
| Age, mean (SD) | 39.83 (9.06) |
| Medical history of food allergy Yes, n (%)No, n (%) | 0 (0)48 (100) |
| Medical history of current illnesses Yes, n (%)No, n (%) | (0)(100) |
Acceptance and Satisfaction Scores of the Participants
The 3 modified formulae with different amounts of protein-free tapioca flour of each menu were tested for satisfaction scores that were compared with the original formula (total=4 formulae per menu). For PSE, results revealed that there was a significant difference in the texture of food samples with the original formula earning the highest satisfaction score. In addition, the overall satisfaction scores of all recipes were above 4.00 which indicated that they were all acceptable to the participants (Table 2).
Table 2: Means of Participants’ Satisfaction Scores on Pad See Ew (PSE)
| Aspects of satisfaction | PSE 125% tapioca flour Mean (SD) | PSE 250% tapioca flour Mean (SD) | PSE 375% tapioca flour Mean (SD) | PSE 4Original formula Mean (SD) | p value |
| Appearance | 4.16 (0.91) | 3.73 (1.04) | 4.26 (0.78) | 4.30 (0.91) | 0.06 |
| Color | 4.36 (0.85) | 4.13 (0.89) | 4.00 (0.83) | 4.23 (0.89) | 0.41 |
| Texture | 3.53 (0.62) | 3.70 (0.87) | 4.46 (0.73) | 4.70 (0.53) | <0.00* |
| Flavor | 4.46 (0.62) | 4.06 (0.82) | 4.23 (1.04) | 4.03 (0.88) | 0.19 |
| Taste | 4.06 (0.78) | 4.20 (0.99) | 4.23 (1.07) | 4.16 (0.74) | 0.90 |
| Overall | 4.46 (0.68) | 4.36 (0.61) | 4.50 (0.68) | 4.60 (0.62) | 0.58 |
*Significant difference
For RN, results revealed that there were significant differences on the appearance, texture, flavor, and overall satisfaction of food samples (p<0.05). In addition, the overall satisfaction scores of all three recipes using modified starchy products (RN 1, RN 2, and RN 3) were not above 4.00, which indicated that they were unacceptable to participants (Table 3).
Table 3: Means of Participants’ Satisfaction Scores on Rad Na (RN)
| Aspects of satisfaction | RN 125% tapioca flour Mean (SD) | RN 250% tapioca flour Mean (SD) | RN 375% tapioca flour Mean (SD) | RN 4Original formula Mean (SD) | p value |
| Appearance | 3.23 (0.85) | 3.50 (0.73) | 3.53 (0.77) | 3.93 (0.90) | 0.01* |
| Color | 3.80 (0.92) | 4.03 (0.99) | 3.56 (0.81) | 4.10 (0.84) | 0.09 |
| Texture | 2.03 (1.09) | 2.63 (0.76) | 3.80 (0.96) | 4.06 (0.90) | <0.00* |
| Flavor | 2.76 (1.04) | 3.20 (1.12) | 3.53 (0.81) | 3.80 (1.15) | <0.00* |
| Taste | 3.83 (0.79) | 4.10 (0.60) | 3.76 (0.81) | 4.06 (0.58) | 0.18 |
| Overall | 2.50 (0.68) | 3.26 (1.14) | 3.86 (0.89) | 4.26 (0.63) | <0.00* |
*Significant difference
For PT, results revealed that there were significant differences on the appearance, texture, and overall satisfaction of food samples (p<0.05). In addition, the overall satisfaction score of PT 1 was above 4.00 which indicated that this formula was acceptable to participants (Table 4).
Table 4: Means of Participants’ Satisfaction Scores on Pad Thai (PT)
| Aspects of satisfaction | PT 125% tapioca flour Mean (SD) | PT 250% tapioca flour Mean (SD) | PT 375% tapioca flour Mean (SD) | PT 4Original formula Mean (SD) | p value |
| Appearance | 4.30 (0.46) | 3.83 (0.59) | 3.90 (0.48) | 3.70 (0.59) | <0.00* |
| Color | 4.13 (0.86) | 4.10 (0.71) | 4.20 (0.66) | 4.16 (0.59) | 0.95 |
| Texture | 3.60 (0.72) | 3.66 (0.80) | 3.53 (0.73) | 1.53 (0.77) | <0.00* |
| Flavor | 4.16 (0.59) | 3.80 (0.76) | 3.76 (0.72) | 3.70 (0.91) | 0.08 |
| Taste | 3.66 (0.54) | 3.63 (0.71) | 3.60 (0.72) | 3.83 (0.79) | 0.58 |
| Overall | 4.36 (0.55) | 3.96 (0.66) | 3.83 (0.74) | 2.43 (0.89) | <0.00* |
*Significant difference
For KJ, results revealed that there was a significant difference in the texture of food samples with KJ 3 earning the highest score (p<0.05). In addition, the overall satisfaction score of all recipes was not above 4.00 which indicated that they were unacceptable to participants (Table 5).
Table 5: Means of Participants’ Satisfaction Scores on Kuay Jub (KJ)
| Aspects of satisfaction | KJ 125% tapioca flour Mean (SD) | KJ 250% tapioca flour Mean (SD) | KJ 375% tapioca flour Mean (SD) | KJ 4Original formula Mean (SD) | p value |
| Appearance | 3.66 (0.88) | 3.70 (0.79) | 3.76 (0.92) | 3.80 (0.81) | 0.92 |
| Color | 3.53 (0.81) | 3.76 (0.77) | 3.90 (0.92) | 3.76 (0.93) | 0.42 |
| Texture | 2.53 (1.00) | 3.30 (0.59) | 3.93 (0.86) | 2.80 (0.88) | <0.00* |
| Flavor | 3.30 (0.79) | 3.53 (0.77) | 3.83 (0.94) | 3.70 (1.23) | 0.16 |
| Taste | 3.10 (0.71) | 3.33 (0.88) | 3.66 (1.09) | 3.20 (1.09) | 0.12 |
| Overall | 3.10 (0.66) | 3.26 (0.94) | 3.73 (1.04) | 3.40 (1.06) | 0.06 |
*Significant difference
For PKM, results revealed that there were significant differences in the colour, texture, and overall satisfaction scores of food samples (p<0.05). In addition, the overall satisfaction score of all recipes was above 4.00 which indicated that they were acceptable to participants, except the original formula (Table 6).
Discussion
Now a days, many studies have developed the carbohydrate-based menus of several traditional foods to improve the nutritional value and food quality.17,18 The findings of this study revealed mixed results of participants’ satisfaction scores on several menus of Thai traditional foods made from protein-free starchy products. All of the recipes made from the developed protein-free starchy products received significant different satisfaction scores on the texture of food samples that implicated the amount of tapioca flour affected the texture of food.19,20 In addition, RN was the food recipe that showed significant difference of satisfaction scores on most of aspects. Also, no RN formulae developed from protein-free starchy products received acceptable level on the overall satisfaction scores. In contrast, PSW was the only food menu that participants expressed satisfaction for all formulae, while PT received satisfaction score for PT 1. Moreover, KJ was the only recipes that no acceptable level of overall satisfaction scores from participants, while PKM received overall satisfaction scores for PKM 1, 2, and 3 formulae. The results supported findings in a previous study revealing that the amounts of flour in food affected the food quality21 and similar to previous study revealing on the quality of food improvement by using the developed the gluten free pasta.22,23
Although the unrefined grain and whole grain products are well known as the healthy food with rich nutrients,24 and previous studies had developed whole grain products for investigating the satisfaction of participants.25,26 For people with CKD, low intake of protein from meat and carbohydrate-based foods (including whole grain and unrefined grain) are strongly suggested.27 Therefore, the developed protein-free starchy products could be used in place of whole and unrefined grain and should be appropriate for CKD patients. The limitation of the study was that the sensory evaluation was conducted only in healthy people. Therefore, similar investigations on the acceptability and satisfaction of foods made from protein-free starchy products among patients with CKD as well as the long-term clinical outcome are suggested for further studies. In conclusion, the Thai ethnic food recipes made from the developed protein-free starchy products in PSE (1, 2, and 3), PT 1, and PKM (1, 2, and 3) satisfied and were acceptable to participants.
Acknowledgements
This study was received funding by the Faculty of Allied Health Sciences, Burapha University.
References
- Kimmel P. L., Patel S. S. Quality of life in patients with chronic kidney disease: Focus on end-stage renal disease treated with hemodialysis. Semin Nephrol. 2006;26:68-79.
CrossRef - Tsai Y. C., Hung C. C., Hwang S. J., Wang S. L., Hsiao S. M., Lin M. Y., Kung L. F., Hsiao P. N. Chen H. C. Quality of life predicts risks of end-stage renal disease and mortality in patients with chronic kidney disease. Nephrol Dial Transplant. 2010;25:1621–1626.
CrossRef - Crews D. C., Kuczmarski M. F., Miller E. R., Zonderman A. B., Evans M. K., Powe N. R. Dietary habits, poverty, and chronic kidney disease in an urban population. J Ren Nutr. 2015;25(2):103-10.
CrossRef - Ingsathit A., Thakkinstian A., Chaiprasert A., Sangthawan P., Gojaseni P., Kiattisunthorn K., Ongaiyooth L., Vanavanan S., Sirivongs D., Thirakhupt P., Mittal B., Singh A. K. Prevalence and risk factors of chronic kidney disease in the Thai adult population: Thai SEEK study. Nephrol Dial Transplant. 2010;25(5):1567-1575.
CrossRef - Cristóvão A. F. A. J. Fluid and dietary restriction’s efficacy on chronic kidney disease patients in hemodialysis. Rev Bras Enferm. 2015;68(6):842-850.
- Shah B. V., Patel Z. M. Role of low protein diet in management of different stages of chronic kidney disease – practical aspects. BMC Nephrology. 2016;17:156.
CrossRef - Vargas-Santos A. B., Neogi T. Management of Gout and Hyperuricemia in CKD. AJKD. 2017;70(3): 422–439.
CrossRef - Pracham S., Thaiudom S. The effect of protein content in jasmine rice flour on textural and rheological properties of jasmine rice pudding. IFRJ. 2016;23(4):1379-1388.
- Souza D., Sbardelotto A. F., Ziegler D. R., Damasceno L., Marczak F., Tessaro I. C. Characterization of rice starch and protein obtained by a fast alkaline extraction method. Food Chem. 2016;191:36-44.
CrossRef - Theerakulkait C., Chaiseri S., Mongkolkanchanasiri S. Extraction and some functional properties of protein extract from rice bran. Kasetsart J. (Nat. Sci.). 2006;40:209-214.
- Jiamyangyuen S., Srijesdaruk V., Harper W. J. Extraction of rice bran protein concentrate and its application in bread. Songklanakarin J Sci Technol. 2005;27(1):55-64.
- Thamnarathip P., Jangchud K., Jangchud A., Nitisinprasert S., Tadakittisarn S., Vardhanabhuti B. Functional properties of protein hydrolysates from Riceberry rice bran. JFST. 2016;51(1):194-202.
CrossRef - Hulsebus-Colvin J. The nutrition needs of patients with chronic kidney disease in health care community settings. J Ren Nutr. 2015;25(4):31-36.
CrossRef - Malinauskas B. M., Aeby V. G., Overton R. F., Carpenter-Aeby C., Barber-Heidal K. A survey of energy drink consumption patterns among college students. Nutr J. 2007;6:35.
CrossRef - Wongwongsri S. The diversity of noodle foods. 1st rev. ed. Bangkok: Krua Ban Lae Suan. 2005;126.
- Lim J., Wood A., Green B. G. Derivation and evaluation of a labeled hedonic scale. Chem Senses. 2009;34(9):739–751.
CrossRef - Pasqualone A. Traditional flat breads spread from the Fertile Crescent: Production process and history of baking systems. J Ethn Foods. 2018;5(1):10-19.
CrossRef - Karizaki V. M. Ethnic and traditional Iranian breads: different types, and historical and cultural aspects. J Ethn Foods. 2017;4(1):8-14.
CrossRef - Ananthanarayan L., Gat Y., Kumar V., Panghal A., Kaurb N. Extruded black gram flour: Partial substitute for improving quality characteristics of Indian traditional snack. J Ethn Foods. 2018; 5(1):54-59.
CrossRef - Saleh M., Al-Ismail K., Ajo R. Pasta quality as impacted by the type of flour and starch and the level of egg addition. J Texture Stud. 2017;48(5):370-381.
CrossRef - Chauhan A., Saxena D. C., Singh S., Yildiz F. Physical, textural, and sensory characteristics of wheat and amaranth flour blend cookies. Cogent Food & Agriculture. 2016;2:1.
CrossRef - Larrosa V., Lorenzo G., Zaritzky N., Califano A. Improvement of the texture and quality of cooked gluten-free pasta. LWT-Food Sci Technol. 2016;70:96-103.
CrossRef - D’Amico S., Mäschle J., Jekle M., Tömösközi S., Langó B., Schoenlechner R. Effect of high temperature drying on gluten-free pasta properties. LWT-Food Sci Technol. 2015;63(1):391-399.
CrossRef - Slavin J., Tucker M., Harriman C., Jonnalagadda S. S. Whole grains: Definition, dietary recommendations, and health benefits. AACCI Report. 2013;58(4):191-198.
CrossRef - Ndife J., Abdulraheem L. O., Zakari U. M. Evaluation of the nutritional and sensory quality of functional breads produced from whole wheat and soya bean flour blends. AJFS. 2011;5(8):466-472.
- Muhihi A., Gimbi D., Njelekela M., Shemaghembe E., Mwambene K., Chiwanga F., Malik V. S., Wedick N. M., Spiegelman D., Hu F. B., Willett W. C. Consumption and acceptability of whole grain staples for lowering markers of diabetes risk among overweight and obese Tanzanian adults. Global Health. 2013;9:26.
CrossRef - Rysz J., Franczyk B., Ciałkowska-Rysz A., Gluba-Brzózka A. The Effect of Diet on the Survival of Patients with Chronic Kidney Disease. 2017;9:495.
Accepted on: 17-11-2018
Second Review by: Dr. Bansee M. Devani (India)
Final Approval by: Prof. Min-Hsiung Pan


Web of Science Coverage
Emerging Sources Citation Index (ESCI)
2024 Journal Impact Factor: 1.1
Scopus Journal Metrics
CiteScore 2025: 2.6
CiteScore Details
Sustainable Nutrition: Food Systems, Nutrient Retention, and Public Health Impact
![]()
This journal is a member of, and subscribes to the principles of, the Committee on Publication Ethics (COPE)


