Drying Modelling, Moisture Diffusivity and Sensory quality of Thin Layer dried Beef
Eunice Akello Mewa1*
1Department of Food Science, Nutrition and Technology, University of Nairobi, Kenya
2Department of Agricultural Engineering and Technology, Egerton University, Kenya.
Corresponding Author Email: eunicemewa@yahoo.com
DOI : http://dx.doi.org/10.12944/CRNFSJ.6.2.29
Download this article as:
![]()
The objective of the present study was to determine the drying kinetics, moisture diffusivity and sensory quality of convective air dried beef. The effect of temperature of drying (30-60°C) and thickness of samples (2.5-10 mm) on the convective thin-layer drying kinetics of beefdried in a cabinet dryer was evaluated. Five semi-theoretical models were fit to the drying experimentaldata with the aim of predicting drying characteristics of beef and fitting quality of models determined using the standard error of estimate (SEE)and coefficient of determination (R2). Determination ofeffective moisture diffusivity (Deff) from the experimental drying datawas done and sensory quality of the optimized dried cooked and uncookedbeef samplesevaluated. Drying time and rate of drying increased with an increasing temperature but decreased with increased slice thickness. However, there was overlapping of drying curves at 40-50°C. Among the selected models, Page model gave the best prediction of beef drying characteristics. Effective moisture diffusivity (Deff) ranged between 4.2337 x 10⁻¹¹ and 5.5899 x 10⁻¹⁰ m2/s, increasing with an increase in air temperature and beef slice thickness.Of all the sensory parameters evaluated, texture was the only attribute that gave significantly different (P > 0.05) scores between the cooked and uncooked dried beef samples.
KEYWORDS:Beef slice thickness; Drying temperature; Mathematical modelling; Moisture diffusivity; Sensory quality.
Introduction
Drying is a unit operation whereby heat and mass transfer processes occursimultaneously.Heat penetrates into the product and causestransfer of moisturefrom within the food product to its surface with subsequent evaporation to the air stream as vapour.1 The reasons for drying different types of foodproducts are extremely diverse: from reducing bulk during transportation to increasing the shelf-life of agricultural commodities. As one of the most extensively used methods of foodpreservation, drying preventsthe deterioration of perishable products and ensurestheir availability during periods of scarcity.
Some important areas in drying technology includemodelling of the dehydration processas well as the drying equipment.2 Drying simulation for many food products can be represented by a set of mass and heat transfer equations describing themoisture and heat exchange within the product and between the product and air.3 In various studies, thin-layer drying procedureis quite a reliable tool for evaluating the drying kinetics of a wide range of products.4-6 Mathematical modelling of the thin layer drying process is critical for managing operating conditions during drying and for predicting the performance of a drying process.7
Thin layer drying generally means that drying is done as a single layer of slices or sample particles.2 The categories of thin layer drying models currently being applied in evaluation of the drying characteristics of food products include; empirical, theoretical and semi-theoretical models.For the empirical and semi-theoretical models only external resistance to movementof moisture from the sample to the air is taken into account,8 while the theoretical modelconsiders the resistance to moisture movement from within the product.9 Theoretical models can be used at all process conditions as they clearly explain the drying behaviors of products. However many assumptions are made,10 causing considerable errors.In deriving most semi-theoretical models, the use of Fick’s second law of diffusion is very common in literature.However, the validity of these models is only within the experimental conditions applied.11 Similar to the semi-theoretical models, empirical models are strongly dependent on the drying conditions. However, information given on the drying behavior of the material is limited.12
The drying rate of a food product describes the rate of conversion of moisture to vapor by evaporation and depends on the pressure gradient existing between the product and air due to an established temperature gradient.13 On the other hand, the rate of transferof moistureinternallywithin a material during dryingis described by an effective diffusivity (Deff). It depends on the product’s moisture content, temperature of the drying air, and the physical nature of the solid. The temperature and moisture content dependence of moisture diffusivity has been verified for various products.14 Generally, theproperties of agricultural products, such and moisture diffusivity are also required for the ideal dryer design and operation.15
Currently, there are many researches reporting on drying modelling and moisture diffusivity of different products as influenced by drying temperature and thickness of the product.4 16-18 However, similar reports on beef drying are limited. Furthermore, studies on the sensory quality of dried beef are apparently not available. Trujillo et al.,6 used different drying methods to experimentally determine the moisture diffusivity of beef in the range of 6.6-40.4°C whereas Chabbouh et al.,19 examined dehydration of beef during salting and drying steps of Kaddid meat’s productionand evaluated the physico-chemical and microbiological quality of the dried product.In the present study, drying curves were generated from experimental dataof beef drying processes at different temperatures and sample thicknesses.Some selected semi-theoretical models were used to simulatethemoisture removal behaviour of beef and the suitability ofthe models forcharacterizing thedryingprocessinvestigated. Influence of drying temperature and slice thickness on the effective moisture diffusivityof beef wasassessed and the sensory quality of the optimized dried beef samples evaluated.
Methodology
Preparation of beef samples
Beef meat was taken from the hind quarter round of a Zebu (Bos indicus) carcass. Its collection and preparation was done as described by Mewa et al.,20 giving 100 mm long and 30 mm wide beef strips with thicknesses of 2.5, 5.0, 7.5 and 10 mm. For determination of the sample’s initial moisture content, the oven method was used at 105 °C for 3 h .21
Drying apparatus
Drying wasdone using a “Hohenheim HT mini” type of cabinet dryer (Innotech-ingenieursgesellschaftGmbH, Altdorf, Germany) containing six perforated trays (420 x 440 mm each).The cabinet drier has a fan for air circulation and an exhaust flap that opens and closes to release exhaust air and attain maximum heating respectively.Heating power was provided by a heater 1.5-3 kW that was connected to a thermostat for automatic switching on and off. The dryer operates using application of the over current principle in which inlet air splits and moves between the trays and over all the layers of beef. Thisin combination with a registered profiled layout of the trays ensured the desired uniform air distribution inside the drying chamber. The dryer was started and the set temperature attained before each drying run.
Experimental
The drying of beef samples was conducted at temperatures of 30, 40, 50, and 60°C and airflow fixed at a 24 V voltage. About 220 g of the slicesof beef with different thicknesses were put on the perforated traysas a single layer for each drying run.The traysand sample weightswere noted before being inserted into the drier. To ensure uniform drying conditions, all trays were inserted into the dryer. Asdrying progressed, the trays were taken outafter every 15 min and weighed using an electronic balance (ESA 600, Salter Brecknell, UK) before being returned to the dryer, ensuring the weighing process was done within 1 min. The experiments were repeated 3 times until the dried products had between 10–20% moisture content (dry weight basis)which corresponds to the moisture content range for meat products driedtraditionally in tropical countries.22 The dried beef was allowed to cool and then packaged in low-density polyethylene (LDPE) bags.
Mathematical Modelling
During the drying process, the moisture content of beef samples was determined as shown in the following equation
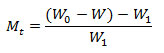
where Mt is the product’s moisture content (g water/100 g dry matter or % dry weight basis(dwb)) at time t, W0 is weight of sample before drying (g), W is the amount of evaporated moisture (g), and W1 is the sample’s dry matter content (g).
Drying curves were represented as moisture content as a function of time and drying rate (DR) as a function of moisture content graphs. The drying rate (DR) of beef slices wasdetermined as given below:
![]()
where Mt + Δtis the moisture content at time ‘t+Δt’ (% dwb) and t is time (min).
To the beef experimental data, Fick’s diffusion equation was used as shown below.
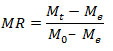
where MR represents the dimensionless moisture ratio; Me is equilibrium moisture content (% dwb); Mt is moisture content at time t (% dwb) and M0 is the initial moisture content (% dwb).
Compared to values of Mt and M0, the value of Me is relatively smaller[23], so the equation can be reduced to

The experimental data werepresentedasmoisture ratio vs drying time graphs and fitted into five different models shown in Table 1.
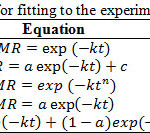 |
Table 1: Mathematical models used for fitting to the experimental dryingdata Click here to View table |
where t is time (min), a, n and c are drying constants andk is the drying rate constant (min-1).
Statistical Analysis
Drying dataanalysis was doneby using Minitab (Version 17.0, Minitab Inc., USA) software package and Excel 2008(Microsoft Corporation, USA). Nonlinear regression was done based on the Gauss-Newton algorithm in order to estimate the model parameters. The model’sfitting quality to thedrying data was assessed using the coefficient of determination (R2) Eq. (5) calculated numerically by Excel and the standard error of estimate (SEE) Eq.6 generated by Minitab. The ideal value of SEE is “zero”, and a small value means that the data points fall closer to the curved fitted line .29 For goodness of fit of the curve to the equation, a high R2 value and a low SEE value were taken.30
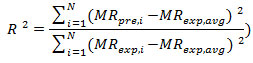
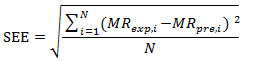
where N is the number of observations, MRpre,i is the predicted dimensionless moisture ratio, MRexp,i is the ith experimental moisture ratio and MRexp,avg is the average experimental moisture ratio
Effective Moisture Diffusivity (Deff) determination
The drying process of most food materials has been described using Fick’s second law of diffusion ,31 in which the drying process occurs in the falling rate period 32 as given below:
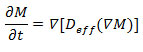
where effective moisture diffusivity (m2/s) is given by Deff (the term used to represent all moisture transport mechanisms within a sample), t is time (s) and M is the local moisture content (% dwb).
Crank,[33]gives the solution of Fick’s second law as shown in Eq,8 considering constant moisture diffusivity, uniform initial moisture distribution and infinite slab geometry .13
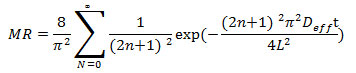
where nrepresents a positive integer andL the slab’shalf thickness (m).
Only the first term of Eq.8 is normally applied, giving:
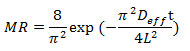
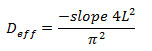
The slope of a normalized plot of experimental moisture ratio, ln (MR) vs time (s) can be used to obtain the Deffof a sample, for corresponding temperature data using the following equation 34
Sensory quality evaluation
For sensory quality evaluation, beef samples with 5.0 mm thickness dried at 60°C were used. These optimized samples were selected based on the physical and microbiological quality studies of dried beef by Mewa et al.,20 The samples were cooked at 100°C for 20 minutes and cut into cubes of sizes 2cm x 2cm x thickness. The cooked and uncooked samples were labelled with random 3-digit codes and presented randomly to panellists consisting of 15 volunteers who had been selected and trained. Uncooked samples of dried beef were observed for their colour, odour, appearance and overall acceptability whereas the cooked samples were evaluated and compared with uncooked control samples for their colour, odour, flavour, texture, appearance and overall acceptability. The beef samples were placed into white saucers and sensory attributes tested on a nine point hedonic scale, where 1= dislike extremely, 2 = dislike very much, 3 = dislike moderately, 4 = dislike slightly, 5 = neither like nor dislike, 6 = like slightly, 7 = like moderately, 8 = like very much and 9 = like extremely.
Statistical analysis
In order determine effect of drying on the sensory quality characteristics beef, the data were analysed using t-test to evaluate the differences in means between cooked and uncooked dried beef samples. The P-value was used to determine the level of significance at α ≤ 0.05 using GenStat Edition 13 software (VSN International Ltd, UK).
Results and discussion
Influence of air temperature on drying curvesof beef
Theaverage moisture content of fresh beef was 328.69 % (dwb) and drying time for all the beef samples ranged between 2.5 and 30 h.Moisture content vs time graph for 2.5 and 5.0 mm thick beef samples are shown in Figures 1 and 2 respectively. To reach the desired moisture contents, drying time was 535, 345, 275 and 150 min at 30, 40, 50 and 60°C, respectively (Figure 1).
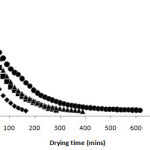 |
Figure 1: Drying curve of beef (2.5 mm thick slices) at different temperatures. Click here to View figure |
The drying process was enhanced by increasing the drying temperature within this temperature range, thus shortening the time of drying. The reduction in time with increasing temperature is attributed to increased thermal energy which speeds up the transfer of water molecules within the meat.35 The higher temperatures also createlarge water to vapor pressure deficit; one of the driving forces for moisture transfer externally: from the surface of the meat to the air.36 Similar resultshave been reported for drying curves of other food materials.37, 38 The relationship between temperature and drying time still followed the same trend when the thickness of the meat was increased to 5.0 mm (Figure 2).
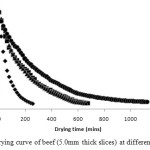 |
Figure 2: Drying curve of beef (5.0mm thick slices) at different temperatures. Click here to View figure |
The lowest effect of temperature on reduction of drying time was between 40 and 50°C which resulted in overlapping of drying curves at this temperature range. When drying beef samples, Chabbouh et al.,19 observed that after 30 minutes of dehydration, samples dried at 50°C lost moisture slower than those dried at 40°C. This was explained by the fact that during high temperaturedrying, rapid evaporation of water from the surface of the meat allowed crust formation due to case hardening, presenting a high resistance to moisture movement from within the meat thus lowering the drying rate.39 This effect could have been overcome at 60°Cdue tochange in internal meat structure as a result of changes in physico-chemical properties of beef. Different meat proteins denatureduring heating at different temperatures, causing changes to the structure of the meat.Denaturation of connective tissue proteins occurs at 60-70°C, which causes the shrinkage of connective tissue fibres and muscle fibres longitudinally, giving large extracellular voids.40 Together witha higher heat transfer,these could have promoted a faster moisture movement at 60°C.
The drying rate vs moisture content curve for 10 mm thick beef slices at various temperatures is given in Figure 3.
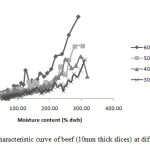 |
Figure 3: Drying characteristic curve of beef (10mm thick slices) at different temperatures Click here to View figure |
There was a continuous decreaseof drying rate with decrease in moisture content and drying rate was highest at the highest temperature (60°C). The beef drying process occurred predominantly in the falling rate period and there was no constant drying rate period. The lack of constant rate period may be due to the fact that at the beginning of drying, the surface of meat dries out very quickly, generating a partial barrier which resistsfree moisture movement.29 This meansthat the dominant physical mechanism controlling moisture movement within the beef was diffusion, as obtained for most agricultural products.41
Influence of sample thickness on beef drying curves
Influence of beef sample thickness on the drying curves is shown in Figures 4 and 5. Drying time increased with an increased beef sample thickness (Figure 4). For thicker beef samples, the amount of water that needs to be moved from the center of the meat to its surface is more 42 thus increasing the time needed for drying the slice to the same level of moisture content 31
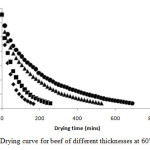 |
Figure 4: Drying curve for beef of different thicknesses at 60°C. Click here to View figure |
The curve of drying rate vsmoisture content at 60°C (Figure 5) shows that beef with the smallest thickness value (2.5 mm) had the highest drying rate as compared to thicker samples.
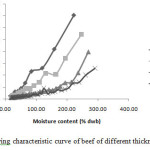 |
Figure 5: Drying characteristic curve of beef of different thicknesses at 60°C. Click here to View figure |
At the initial stages of drying,drying rates were high and continuously decreased as moisture content decreased for all beef samples (Figures 3 and 5). With themoisture content decreasing continuouslyduring drying, the presence of water in the free form diminishes: the moisture-food interactions become stronger43 causing a reduction in drying rate.
Mathematical modelling
The influence of temperature on the regression coefficients for five drying models was represented by the experimental results of 5.0 mm thick beef slices(Table 2). To evaluate the effect of slice thickness, experimental results for beef samples dried at 40°C were randomly selected (Table 3).Specific model constants and statistical parameters(R2 and SEE), for assessing the goodness of fit of each of the selected drying models are given in Tables 2 and 3.
Increasing temperature enhanced the rate of drying(Table 2) as indicated by the k values for the two-term exponential and the page models. Increasing beef slice thickness reduced the drying rate (Table 3) and the k values decreased for each of the drying models.
Table 2: Regression coefficients of the drying models for5.0mm thick beef slices
| temp | Statistical parameters | Model constants | |||||
|
Model |
(°C) | R2 | SEE | k(min-1) | a | N |
c |
|
Newton |
30 | 0.9977 | 0.0280 |
0.0030 |
|||
|
40 |
0.9967 | 0.0197 |
0.0047 |
||||
|
50 |
0.9900 | 0.0310 |
0.0045 |
||||
|
60 |
0.9944 | 0.0333 |
0.0141 |
||||
|
Handerson and Pabis |
30 |
0.9977 | 0.0184 | 0.0028 |
0.9244 |
||
|
40 |
0.9967 | 0.0171 | 0.0045 |
0.9662 |
|||
|
50 |
0.9943 | 0.0210 | 0.0042 |
0.9239 |
|||
|
60 |
0.9944 | 0.0280 | 0.0131 |
0.9387 |
|||
|
Two-term exponential |
30 |
0.9973 | 0.0135 | 0.0074 |
0.3049 |
||
|
40 |
0.9986 | 0.0101 | 0.0086 |
0.3980 |
|||
|
50 |
0.9984 | 0.0101 | 0.0238 |
0.1602 |
|||
|
60 |
0.9991 | 0.0102 |
0.0452 |
0.2438 |
|||
|
Page |
30 |
0.9978 |
0.0116 |
0.0075 |
0.8489 |
||
|
40 |
0.9983 |
0.0110 |
0.0080 |
0.9044 |
|||
|
50 |
0.9975 | 0.0125 |
0.0111 |
0.8388 |
|||
|
60 |
0.9995 | 0.0064 |
0.0331 |
0.8089 |
|||
|
Logarithmic |
30 |
0.9987 | 0.0088 |
0.0033 |
0.9064 |
0.0486 |
|
|
40 |
0.9973 |
0.0137 |
0.0051 |
0.9504 |
0.0354 |
||
|
50 |
0.9944 |
0.0187 |
0.0047 |
0.9063 |
0.0364 |
||
| 60 | 0.9973 | 0.0148 | 0.0163 | 0.9119 |
0.0597 |
||
All the five drying models indicated a good fit as they gave coefficient of determination (R2) values higher than 0.99 at all drying conditions (Table 2 and 3). The models that gave the lowest SEE and the highest R2 values were the Page and two-term exponential model and were therefore chosen as the most appropriate models for simulating the drying kinetics of beef slices dried at 40 °C and of 5 mm thickness.However, for the whole range of experimental drying data (30-60°C) and (2.5-10 mm thickness), Page model had the best fit. The Page model’sgoodness of fit for characterizing the meat drying process has also been shown by Ikonic et al.,44
Table 3: Regression coefficients of the drying models for beef dried at 40°C air temperature.
| Meat thickness | Statistical parameters |
Model constants |
||||||
|
Model |
(mm) | R2 | SEE | k(min-1) | a | N |
c |
|
|
Newton |
2.5 | 0.9974 | 0.0213 |
0.0102 |
||||
|
5.0 |
0.9967 | 0.0197 |
0.0047 |
|||||
|
7.5 |
0.9898 | 0.0516 |
0.0034 |
|||||
|
10 |
0.9918 | 0.0426 |
0.0022 |
|||||
|
Handerson and Pabis |
2.5 |
0.9961 | 0.0191 | 0.0098 |
0.9652 |
|||
|
5.0 |
0.9967 | 0.0171 | 0.0045 |
0.9662 |
||||
|
7.5 |
0.9769 | 0.0367 | 0.0028 |
0.8510 |
||||
|
10 |
0.9860 | 0.0284 | 0.0019 |
0.8853 |
||||
|
Two-term exponential |
2.5 |
0.9968 | 0.0165 | 0.1255 |
0.0748 |
|||
|
5.0 |
0.9986 | 0.0101 | 0.0086 |
0.3980 |
||||
|
7.5 |
0.9933 | 0.0311 | 0.0065 |
0.2346 |
||||
|
10 |
0.9961 | 0.0197 | 0.0046 |
0.2060 |
||||
|
Page |
2.5 |
0.9976 | 0.0137 |
0.0169 |
0.8943 |
|||
|
5.0 |
0.9983 |
0.0110 | 0.0110 |
0.9044 |
||||
| 7.5 | 0.9944 | 0.0164 | 0.0088 |
0.7140 |
||||
|
10 |
0.9967 |
0.0131 |
0.0063 |
0.7723 |
||||
|
Logarithmic |
2.5 |
0.9990 |
0.0088 | 0.0112 |
0.9505 |
0.0384 |
||
|
5.0 |
0.9973 |
0.0137 |
0.0051 |
0.9504 |
0.0354 |
|||
|
7.5 |
0.9932 | 0.0179 |
0.0039 |
0.8468 |
0.0719 |
|||
|
10 |
0.9937 | 0.0182 |
0.0025 |
0.8634 |
0.0687 |
|||
Figures 6 and 7 give a fitted line plot for moisture ratio against time for experimental and predicted data by the Page and two-term exponential models respectively,with the Page model showinga visually good fit.
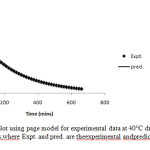 |
Figure 6: Fitted line plot using page model for experimental data at 40°C drying temperature and 5.0mm slice thickness,where Expt. and pred. are theexperimental andpredicted moisture ratios respectively. Click here to View figure |
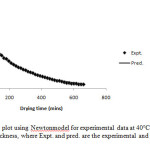 |
Figure 7: Fitted line plot using Newtonmodel for experimental data at 40°C drying temperature and 5.0mm slice thickness, where Expt. and pred. are the experimental and predicted moisture ratios respectively. Click here to View figure |
The efficiency of the Page model for evaluating the drying kinetics of beef was further indicated by plotting a curve of predicted moisture ratios vs observed moisture ratios for 5.0 mm thick slices (Figure 8). A good fit for the experimental drying data was given by the predicted model, as indicated by the linear nature of the curve at 45° slope from the origin.1
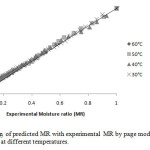 |
Figure 8: Comparison of predicted MR with experimental MR by page model for beef of 5.0mm slice thickness dried at different temperatures. Click here to View figure |
Effective Moisture Diffusivity (Deff)
Figure 9 shows the influence of temperature on the linear relationship between logarithmic moisture ratio vs time for 2.5 mm thick beef slices.
Figure 9:Logarithmic moisture ratio vs drying time graph at various drying temperatures for meat of 2.5 mm thickness.
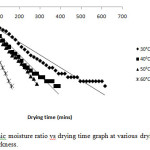 |
Figure 9: Logarithmic moisture ratio vs drying time graph at various drying temperatures for meat of 2.5 mm thickness.Click here to View figure |
The slopes of the linear graphs were 0.000081, 0.000130, 0.000161 and 0.000297 at 30, 40, 50 and 60°C respectively (Figure 9).
The Deff obtained from slope of graphs according to Eq. (9) at all the experimental drying conditions ranged between 4.2337 x 10⁻¹¹ and 5.5899 x 10⁻¹⁰ m2/s (Table 4).
Table 4: Influence of sample thickness and drying temperature on the effective moisture diffusivity (Deff) of beef.
| Meat thickness (cm) |
Drying temperature (°C) |
Deff x 10-10 (m2/s) | R2 (ln MR vs time graph) | |
| 30 | 0.4234 | 0.9471 | ||
| 0.25 | 40 | 0.6987 | 0.9742 | |
| 50 | 0.8654 | 0.9936 | ||
| 60 | 1.5964 | 0.9908 | ||
| 30 | 0.8385 | 0.9755 | ||
| 0.5 | 40 | 1.5265 | 0.9975 | |
| 50 | 1.4190 | 0.9966 | ||
| 60 | 3.8269 | 0.9958 | ||
| 30 | 0.8224 | 0.8624 | ||
| 0.75 | 40 | 1.5480 | 0.9159 | |
| 50 | 2.4671 | 0.9836 | ||
| 60 | 4.0151 | 0.9954 | ||
| 30 | 1.4620 | 0.9400 | ||
| 1.0 | 40 | 2.3220 | 0.9745 | |
| 50 | 3.0950 | 0.9835 | ||
| 60 | 5.5899 | 0.9967 | ||
The values of Deff for this study were within the normal range (between 10−11 to 10−9 m2/s) obtained for most agricultural products,14 and can be compared to 1.20 x 10⁻¹¹ to 1.15 x 10⁻¹⁰ m2/s for meat products during drying under different conditions,45, 46 From the results, increasing temperature as well as slice thickness increased the Deffvalues. Comparable results have been described for a number of food products.4, 47 and 48. A higher drying temperature increased thermal energy and subsequently increased the activity of water molecules resulting in high moisture diffusivity.49 Nguyen and Price,50 attributed the increase in diffusivity with thickness of a material to the edge effect (side way diffusion) of thicker slices. The diffusion model used in this study, assumed that diffusion took place from inside to the surface of the slab from one direction. This assumption was more applicable for thinner slabs for which the edge effect was negligible thusgiving lower moisture diffusivity values.
The diffusion model fit the drying experimental data better at higher temperatures, as shown by the high values of R2 (Table 4)and the goodness of fit of the curve (Figure 9)at 60°C compared to 30°C.This could be due to change in boundary conditions with change in temperature, particularly at lower temperatures. At lower temperatures, the surface dries off slowly at a rate controlled partly by surface resistance. At higher temperatures, the surface dries off quickly and water movement is largely controlled by diffusion within the meat.6 Therefore, the assumption of negligible external resistance for the diffusion model was more applicable at higher temperatures.
Sensory quality
Results of sensory analysis of beef samples dried at 60°C drying temperature and 5.0 mm slice thickness.are shown in Table 5.
Table 5: Mean sensory analysis scores for cooked and uncooked dried beef samples at 60°C drying temperature and 5.0 mm slice thickness.
|
Sensory parameter |
Uncooked beef samples |
Cooked beef samples |
|
Colour |
6.73±1.03a |
7.20±1.52a |
|
Odour |
6.87±1.68a |
7.20±1.57a |
|
Flavour |
7.04±1.36a |
6.93±1.49a |
|
Texture |
5.01±1.43a |
6.87±1.55b |
|
Appearance |
7.00±0.93a |
6.60±1.24a |
|
Overall acceptability |
7.06±1.10a |
7.20±1.15a |
Means in the same row with the same superscripts are not significantly different at P> 0.05
Generally, both the cooked and uncooked dried beef samples scored well (above average) for all the sensory parameters evaluated. Other than thetexture scores, there was no significant difference (P > 0.05) in the scores of the othersensory quality parameters for the cooked and uncooked beef samples.This meant that the cooked and uncooked dried beef samples were equally acceptable to the consumers in terms of colour, odour, flavour, appearance and overall acceptability. The high texture scores of the samples which were cooked after drying could be attributed to the increased moisture content as a result of the highrehydration capacity of the samples,20 which gave more tender meat. According to Youssef et al.,51 moisture content is the primary cause of meat texture and an increase in moisture content increases the tenderness of meat. The effect of moisture content on the compressive behaviour of dried materials was also assessed by Krokida et al.,52
Acknowledgements
The financial support from the German Federal Ministry of Education and Research (BMBF), in the framework of the project ‘Reducing Losses Adding Value-RELOAD’ is greatly acknowledged bythe authors of this paper.
Declaration of conflict of interest
There is no conflict of interest to be declared by the authors of this paper
References
- Tulek Y. Drying Kinetics of Oyster Mushroom (Pleurotus ostreatus) in a Convective Hot-air Dryer.Journal of Agriculture, Science and Technology;13:655-64: (2011).
- Akpinar E. K, Bicer Y,Cetinkaya F. Modelling of Thin Layer Drying of Parsley Leaves in a Convective Dryer and Under Open Sun. Journal of Food Engineering.2006;75: 308–315
CrossRef - Efremov G. Describing of Generalized Drying Kinetics with Application of Experimental Design Method. Technical Sciences.2013;16:309-22
- Akgun N. A,Doymaz I. Modelling of Olive Cake Thin-layer Drying Process.Journal of Food Engineering.2005;68:455–461
CrossRef - Akpinar E. K, Bicer Y, Midilli A.Modelling and Experimental Study on Drying of Apple Slices in a Convective Cyclone Dryer. Journal of Food Process Engineering.2003;26:515-541
CrossRef - Trujillo F. J, Wiangkaew C, Pham Q. T. Drying Modelling and Water Diffusivity in Beef Meat. Journal of Food Engineering.2007;78:74-85
CrossRef - FudholiA, OthmanM.Y, RuslanM. H, YahyaM, ZaharimA, SopianK. The Effects of Drying Air Temperature and Humidity on Drying Kinetics of Seaweed.Recent Researches in Geography, Geology, Energy, Environment and Biomedicine.2011;19:129-33
- Fortes M, Okos M. R, Barrett J. R. Heat and Mass Transfer Analysis of Intra-kernel Wheat Drying and Rewetting. Journal of Agricultural Engineering Research.1981;26:109-125
CrossRef - Suarez C, Viollaz P, Chirife J. Diffusional Analysis of Air-drying of Grain Sorghum. International Journal of Food Science & Technology.1980;15:523-531
CrossRef - McMinn W. M. Thin-layer Modelling of Convective, Microwave Convective and microwave Vacuum Drying of Lactose Powder.Journal of Food Engineering.2006;72:113–123
CrossRef - Fortes M, Okos M. R.Non-equilibrium Thermodynamics Approach to Heat and Mass Transfer in Corn Kernels.Transactions of ASAE.1980;22:761–769
- Keey R. B. Drying: Principles and Practice.International Series of Monographs in Chemical Engineering; vol.1972;13
- Ahmad-Qasem M. H, Nijsse J, García-Pérez J. V, Khalloufi S. (2017). The Role of Drying Methods on Enzymatic Activity and Phenolics Content of Impregnated Dried Apple. Drying Technology; 1-10.
CrossRef - Zogzas N. P, Maroulis Z. B, Marinos-Kouris D. Moisture Diffusivity Data Compilation in Foodstuffs. Drying technology.1996;14:2225-53
CrossRef - AghbashloM, KianmehrM. H, Samimi-AkhijahaniH.Influence of Drying Conditions on the Effective Moisture Diffusivity, Energy of Activation and Energy Consumption During the Thin-layer Drying of Beriberi Fruit (Berberidaceae).Energy Conversion and Management.2008;49:2865-71
CrossRef - Shiby V. K, Mishra H. N. Thin-layer Modelling of Recirculatory Convective Air Drying of Curd (Indian yoghurt). Food and Bioproducts Processing.2007;85:193-201
CrossRef - Jena S, Das H. Modelling of Vacuum Drying Characteristics of Coconut Presscake.Journal of Food Engineering.2007;79: 92–99
CrossRef - Doymaz I. The Kinetics of Forced Convective Air-drying of Pumpkin Slices. Journal of Food Engineering.2007;79: 243-248
CrossRef - ChabbouhM, HajjiW, AhmedS. B. H, FarhatA,BellaghaS, SahliaA. Combined Effects of Osmotic Dehydration and Convective Air Drying on Kaddid Meats: Kinetics and Quality. Drying Technology.2011;29:1571-1579
CrossRef - Mewa E. A, Okoth M. W, Kunyanga C. N, Rugiri M. N. Effect of Drying Air Temperature and Slice Thickness on the Physical and Microbiological Quality of Dried Beef. LWT-Food Science and Technology.2018;92:484-489
CrossRef - O.A.C. Official methods of analysis. Association of Official Analytical Chemists International; Maryland, USA:2000.
- KalilouS,CollignanA, ZakhiaN. Optimizing the Traditional Processing of Beef into Kilishi.Meat Science.1998;50:21-32
CrossRef - O, ErtekinC. Mathematical Modelling of Thin-layer Drying of Golden Apples.Journal of Food Engineering.2006;77:119-25
CrossRef - K,SinghR. P. Applied Numerical Methods for Food and Agricultural Engineers, CRC Press, Boca Raton;pp. 163-167FL:1995.
- Page G. E. Factors Influencing the Maximum Rates of Air-drying Shelled Corn in Thin Layers. M.S. thesis, Department of Mechanical Engineering, Purdue University, Purdue, USA:1949
- DryingKinetics of White Mulberry.Journal of Food Engineering.2004;61:341-46
CrossRef - M, PabisS.Grain Drying Theory II. Temperature Effects on Drying Coefficients. Journal of Agricultural Engineering Research.1961;6:169–74
- Sharaf-EldeenY. I, BlaisdellJ. L, HamdyM. Y. A Model for Ear Corn Drying. Transactions of the ASAE.1980;23:1261-71
CrossRef - BorahA, HazarikaK, KhayerS. M. Drying Kinetics of Whole and Sliced Turmeric Rhizomes (Curcuma longa L.) in a Solar Conduction Dryer.Information Processing in Agriculture.2015;2: 85-92
CrossRef - A, AbeT.Moisture Adsorption Isotherms of Rough Rice.Journal of Food Engineering.1999;42:235-42
CrossRef - Saravacos G. D, Charm S. E. A Study of the Mechanism of Fruit and Vegetable Dehydration. Food Technology.1962;1:78-81
- WangN, BrennanJ. G. Thermal Conductivity of Potato as a Function of Moisture content. Journal of Food Engineering.1992;17:153-60
CrossRef - The Mathematics of Diffusion. 2nd Ed., Clarendon press: Oxford, UK.1975
- K. Determination of Suitable Thin-layer Drying Curve Model for Some Vegetables and Fruits.Journal of Food Engineering.2006;73:75-84
CrossRef - MaskanA, KayaS, MaskanM. Hot Air and Sun Drying of Grape Leather (pestil).Journal of Food Engineering.2002;54:81-88
CrossRef - Prabhanjan D. G, Ramaswamy H. S, Raghavan G. S. V. Microwave-assisted Convective Air Drying of Thin-layer Carrots.Journal of Food Engineering.1995;25:283-293
CrossRef - MwithigaG, OlwalJ. O.The Drying Kinetics of Kale (Brassica oleracea) in a Convective Hot Air Dryer.Journal of Food Engineering.2005;71:373-37
CrossRef - Speckhahn A, Srzednicki G, Desai D. K. Drying Beef in Superheated Steam.Drying Technology.2010;28:1072-1082
CrossRef - MujaffarS, SankatC. The Air Drying Behavior of Shark Fillets. Canadian Biosystems Engineering.2005;47:11-21
- Tornberg E.Effect of Heat on Meat Proteins.Meat science.2004;70:493-508
CrossRef - Aregbesola O. A, Ogunsina B. S, Sofolahan A. E, Chime N. N.Mathematical Modelling of the Thin-layer Drying Characteristics of Dika (Irvingia gabonensis) Nuts and Kernels.Nigerian Food Journal.2015;33:83-9
CrossRef - Sa-Adchom P, Swasdisevi T, Nathakaranakule A, Soponronnarit S. Drying Kinetics Using Superheated Steam and Quality Attributes of Dried Pork Slices for Different Thickness, Seasoning and Fibers Distribution.Journal of Food Engineering.2011;104:105-13
CrossRef - Shivhare U. S, Arora S, Ahmed J, Raghavan G. S. V. Moisture Adsorption Isotherms for Mushroom. LWT-Food Science and Technology.2004;37: 133-137
CrossRef - Ikonic P, PetrovicL, TasicT, JokanovicM, SavaticS, IkonicB. The Effect of Processing Method on Drying Kinetics of Petrovská klobása, an Artisan Fermented Sausage.Chemical Industry and Chemical Engineering Quarterly.2012;18:163-169
CrossRef - GouP, ComaposadaJ, ArnauJ.Nacl Contentand Temperature Effects on Moisture Diffusivity in the Gluteus medius Muscle of Pork Ham.Meat Science.2003;63:29-34
CrossRef - GouP, ComaposadaJ, ArnauJ. Moisture Diffusivity in the Lean Tissue of Dry-cured Ham at Different Process Times.Meat Science.2004;67: 203-9
CrossRef - Jaya S, Das H. A Vacuum Drying Model for Mango Pulp.Drying Technology.2003;21: 1215–1234
CrossRef - Ramaswamy H. S,Van Nieuwenhuijzen N. H. Evaluation andModelling of Two-stage Osmo-convective Drying of Apple Slices.Drying Technology.2002;20:650–667
CrossRef - Shi J, Pan Z, Mc Hugh T. H, Wood D, Hirschberg E, Olson D. Drying and Quality Characteristics of Fresh and Sugar-infused Blueberries Dried with Infrared Radiation Heating.LWT-Food Science and Technology.2008;41:1962-72
CrossRef - Nguyen M. H, Price W. E. Air Drying of Banana: Influence of Experimental Parameters, Slab Thickness, Banana Maturity and Harvesting Season.Journal of Food Engineering.2007;79:200-207
CrossRef - Youssef E. Y, Garcia C. E. R, Yamashita F, Shimokomaki M. Chemical Basis for Beef Charqui Meat Texture. Brazilian Archives of Biology and Technology.2007;50 719-724
CrossRef - Krokida M. K,Maroulis Z. B. Effect of Microwave Drying on Some Quality Properties of Dehydrated Products. Drying technology.1999; 17:449-466
CrossRef
Accepted on: 24/8/2018
Second Review by: Dr. Vlad Muresan (Romania)
Final Approval by: Prof. Min-Hsiung Pan


Web of Science Coverage
Emerging Sources Citation Index (ESCI)
2024 Journal Impact Factor: 1.1
Scopus Journal Metrics
CiteScore 2025: 2.6
CiteScore Details
Sustainable Nutrition: Food Systems, Nutrient Retention, and Public Health Impact
![]()
This journal is a member of, and subscribes to the principles of, the Committee on Publication Ethics (COPE)


