Caffeine Content and Perceived Sensory Characteristics of Pod Coffee: Effects on Mood and Cognitive Performance
Christopher Irwin1*
, Saman Khalesi2, Ben Desbrow1
1School of Allied Health Sciences, Griffith University, Gold Coast, Australia.
2Physical Activity Research Group, Appleton Institute and School of Health, Medical and Applied Sciences, Central Queensland University, Rockhampton, Australia.
Corresponding Author Email: ac.irwin@griffith.edu.au
DOI : http://dx.doi.org/10.12944/CRNFSJ.6.2.08
Download this article as:
![]()
Encapsulated (Pod) coffee is increasingly popular and available in a range of flavor and intensity profiles. This study examined consumption of different coffee Pods on mood and cognitive performance. Thirty-eight participants (n=6 males, 32 females; age: 23.9±5.4 years; weight: 64.3±11.9 kg; BMI: 22.4±2.7 kg•m-2; mean±SD) completed 3 trials, consuming either Cosi, Dharkan, or Kazaar Pods following overnight caffeine abstention. Mood and cognitive performance (choice reaction-time (CRT), visual scanning (VS), Stroop) were measured before and 30 min post coffee consumption. Sensory characteristics were measured during coffee consumption. Accuracy, Reaction Time (RT) central tendency and whole RT distributions were analyzed. Bitterness, flavour-intensity, aroma and perceived caffeine content ratings increased for Cosi, Dharkan and Kazaar Pods respectively. Reduced ratings of sleepiness and headache; and increased ratings of concentration, alertness, excitement and happiness were observed with all Pods. Coffee improved CRT latency (before: 469±55 vs. after: 459±50 ms; p=0.031), but not visual scanning performance. Stroop RTs were faster after coffee (before: 854±193 vs. after: 766±156 ms; p
< 0.001); with control, congruent and incongruent trials facilitated by different aspects of the RT distribution. Consumption of Nespresso® Pod coffee improves mood and cognitive performance irrespective of caffeine content, habitual caffeine use and Pod sensory characteristics. However, the effects on cognitive function appear to be task dependent.
Analysis; Caffeine; Coffee; Cognitive Function; Sensory
Introduction
Coffee is one of the most commonly consumed beverages worldwide.1 The popularity of coffee can be partly attributed to it being a source of caffeine; a psychoactive stimulant with well documented physiological and behavioural effects.2-4 Even at relatively low to moderate acute doses (i.e. 40 – 100 mg), caffeine has reputed benefits on cognitive function;2 particularly on cognitive processes such as reaction time, attention, vigilance, alertness, mood and reducing perceptions of fatigue.2-5 Although limited, some evidence also suggests that caffeine can improve higher-order executive functions such as strategic planning and sequencing ability, response inhibition, visual attention network functions and inhibitory control.6-9 The stimulatory effects of caffeine appear to persist irrespective of age and gender,10 and whether individuals are rested or sleep-deprived.2 However, the magnitude of effect for some cognitive functions may vary as a result of habitual caffeine use.11-14
The main mechanistic action of caffeine is believed to be inhibition of adenosine receptor ligands to brain membranes4; thus providing central nervous system (CNS) stimulation.2 Because caffeine is quickly and completely absorbed across the gastrointestinal tract, and readily distributed throughout all bodily tissues; it exerts its effects (on the brain) rapidly.15,16 Peak plasma caffeine levels are typically reached between 15 and 120 min following ingestion, with faster times observed when smaller doses are administered15 and when caffeine is consumed following a period of fasting.17 However, some evidence suggests that mood and cognitive performance benefits may be observed almost immediately following consumption of caffeinated beverages18,19; well before peak plasma caffeine levels are likely to be attained. Thus, effects on cognitive function may occur independently of circulating caffeine.
While improved performance and mood following coffee consumption is often ascribed to caffeine, a variety of other factors associated with drinking coffee (e.g. other bioactive compounds present, sensory properties such as aroma, taste, mouth-feel and visual appearance, and consumer information about the coffee) may contribute to these effects. For example, Quinlan et al.,20 demonstrated that the caffeine level of beverages (tea and coffee) was not an important factor in eliciting elevations in mood; rather, that perceived strength of a beverage (1 vs. 2 cups equivalent) was a determining factor. Anticipatory effects based on a conditioned response from prior exposure and experiences with coffee or caffeine may also be influential.21,22 Placebo controlled studies have demonstrated cognitive performance benefits (e.g. faster reaction time) when participants are provided with decaffeinated or caffeinated coffee compared to no fluid23 or water.24 Furthermore, these effects appear to persist when coffee drinkers are aware the beverage is decaffeinated.24 Thus, sensory characteristics of a coffee beverage (i.e. flavor, intensity and taste) may be an important predictor of performance effects.
Coffee can be prepared (brewed) in several different ways. However, single-serve coffee machines have recently gained popularity. These devices force hot water through an encapsulated “Pod” that contains finely ground coffee. A variety of coffee Pods with distinct flavour and intensity profiles are available. However, it appears that consumers may be exposed to variable amounts of caffeine in the various intensity Pods available.25 Whilst manufacturers do not usually report the caffeine content of their Pod coffee, a description of the product’s sensory characteristics (e.g. intensity and aromatic profile) is made available to consumers. This information may influence consumers’ perceptions of Pod coffee (i.e. the sensory characteristics and caffeine content), inducing anticipatory effects that modify caffeine’s impact on mood and cognitive performance. Therefore, the aim of this study was to examine the effects of caffeine and sensory characteristics of Nespresso® Pod coffee (i.e. consumers’ perceptions of flavor, intensity, caffeine content and consumer product information) on mood and cognitive performance.
Materials and Methods
Participant Characteristics
Forty-eight volunteers aged between 18 and 45 y were fully informed of the nature and possible risks of the study before providing written informed consent to participate. Ten participants failed to attend all experimental trials and were subsequently withdrawn from the study. The 38 remaining participants (n = 6 male, n = 32 female; age: 23.9 ± 5.4 y; weight: 64.3 ± 11.9 kg; BMI: 22.4 ± 2.7 kg·m-2; mean ± SD) completed all experimental trials. The investigation was approved by the University’s Human Ethics Committee and the procedures were conducted in accordance with the principles outlined by the agreement of Helsinki.
Study Design
A schematic representation of the study design is presented in Figure 1. Participants arrived at the laboratory at 0600 hrs following an overnight fast on three separate occasions, 7 days apart. At each visit, participants received one of three different varieties of Nespresso® “Pod” coffee, counterbalanced for order in a repeated-experimental design: (1) Cosi; (2) Dharkan; or (3) Kazaar. Two of the same Pods were used to prepare the coffee in each trial. Mood and cognitive performance were evaluated immediately prior to, and 30 min following, coffee ingestion. A sensory analysis of the coffee was completed during consumption.
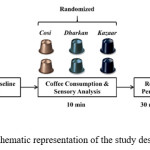 |
Figure 1: A schematic representation of the study design employed Click here to View figure |
Pre-Experimental Procedures
All participants initially completed a questionnaire providing information on personal characteristics (age, self-reported weight and height), frequency of coffee consumption (5-point Likert scale: Never, Seldom (at most once·wk-1), Occasionally (a few times·wk-1), Regular (on most days·wk-1), Very Regular (daily or multiple times·d-1)), type(s) of coffee most commonly consumed (e.g. Instant Freeze-Dried, Coffee Pods and Espresso, and Use of Milk/Sugar), and details on prior exposure to Nespresso® Pods (type(s) of Pod(s) most commonly consumed). Participants then completed a questionnaire26 to quantify habitual caffeine intake. Participants were classified as having a caffeine intake that was either ‘Higher’ (≥170 mg·d-1) or ‘Lower’ (<170 mg·d-1) than the mean intake for Australian adults (31 – 50 y).
After completing the questionnaire, participants undertook a taste sensitivity test to measure intensity ratings upon exposure to 6-n-propylthiouracil (PROP). The intensity of this compound is a genetically mediated index of individual differences in taste perception.28-30 Individuals with higher taste sensitivity usually perceive other bitter compounds (e.g. caffeine) as having a higher intensity than non-tasters.31-34 Tests were conducted using commercial tasting strips (i.e. filter paper with solutions) (Precision Laboratories Inc, Arizona, USA), which were placed on the tongue for 10 s. Participants rated taste perceptions using the general Labelled Magnitude Scale (gLMS)35 to determine taster classification (i.e. Super-Tasters (STs), Medium-Tasters (MTs), Non-Taster (NTs)). Taster status grouping was based on 25%, 50%, 25% percentile distribution30,36: NTs (n=10) gLMS <10; MTs (n=18) gLMS 10 – 59; and STs (n=10) gLMS ≥60. After the tasting session, participants practiced each of the discrete cognitive tasks in order to reduce the potential for learning effects in the experimental trials.
Experimental Procedures
Participants were instructed to arrive at the laboratory at 0600 hrs following an overnight fast from all food and beverages (excluding water) and to abstain from caffeine-containing products and alcoholic beverages for ≥12 h. Verbal acknowledgement of compliance to the pre-experimental conditions was collected on arrival. Participants’ then completed Questionnaire 1 indicating sleep duration, sleep quality (on a scale 1 – 10: where 1 = Poor and 10 = Excellent), current level of sleepiness (Stanford Sleepiness Scale (SSS)37) and subjective ratings of mood. Visual analog scales (0 – 100 mm) were used to obtain subjective mood ratings (ability to concentrate, feelings of being relaxed, level of excitement, anger, nausea, headache, anxiety, happiness, and alertness, where 0 = Very Low and 100 = Very High). Participants then completed three discrete computerised cognitive function tasks (Choice Reaction Time task (CRT), Visual Scanning task, Stroop task. All scales and cognitive function tasks were administered via a computerised software program (Inquisit Web, Version 5.0.7.0; Millisecond Software, Seattle, WA). On completing the cognitive tasks, participants were provided with one of three different Pod coffees (Cosi, Dharkan, Kazaar). Each coffee was prepared using two of the allocated Pods with a U-Milk Nespresso® machine (Nestle Nespresso S.A., Paudex, Switzerland) on the Espresso setting (40 mL liquid volume per Pod). Participants consumed the coffee (black, no sugar) over a 10 min period. While doing so, they completed a sensory analysis of the coffee (ratings of bitterness, sourness, astringency, flavor intensity, aroma, and perceived caffeine content). Ratings were performed using visual analog scales (0 = Very Weak and 100 = Very Strong). Following coffee consumption, participants rested for 30 min before completing Questionnaire 2 (including the SSS and subjective ratings of mood scales) and repeating the cognitive function tasks.
Details of coffee Pod characteristics are indicated in Table 1. Participants were not informed of the caffeine content of the Pods. They were however, given access to the manufacturer’s intensity ratings and a description of the flavor characteristics and aromatic profile for each Pod. Treatment order (i.e. Pod type) was randomised using a repeated Latin square design. The intention of the study design was to allow examination of consuming coffee with similar caffeine content but contrasting intensity ratings (i.e. Cosi vs. Dharkan) and similar intensity ratings but contrasting caffeine content (i.e. Dharkan vs. Kazaar).
Table 1: Coffee Pod Characteristics. Values are mean ± SD
| CaffeineContent(mg·40 mL serve-1)* | Nespresso® IntensityRating | Nespresso®AromaticProfile | CaffeineProvided(mg) | CaffeineProvided(mg·kg-1) | |
| Cosi | 44 ± 4 | 4 | Toasted, cereal, fruity notes | 88 ± 8 | 1.4 ± 0.3 |
| Dharkan | 52 ± 18 | 11 | Intense, bitter cocoa powder, toasted cereals | 104 ± 36 | 1.7 ± 0.3 |
| Kazaar | 109 ± 25 | 12 | Rich, roasted, peppery notes, creamy | 218 ± 50 | 3.5 ± 0.7 |
* Caffeine content indicated by Desbrow et al25.
Cognitive Performance Tasks
Participants completed three discrete computer-based cognitive function tasks immediately before and 30 min after coffee consumption. The tasks were selected to examine performance effects across different cognitive domains (i.e. reaction time, attention, executive function) and on the basis of established sensitivity to caffeine’s effects.2,3,9,38,39
The computerised CRT task involved pressing 1 of 4 keys on a keyboard corresponding to 1 of 4 boxes on the computer screen, which randomly changed from black to red at various delay signals (between 400 and 2,000 ms). The task was ~2 – 3 min in duration involving a total of 40 recorded trials of reaction time (latency and accuracy).
The Visual Scanning task was used to assess perceptual speed.40,41 Participants were presented with a letter matrix consisting of 25 rows of 5 letters each. Their task was to read the matrix from top to bottom, left to right and find the target letter ‘K’ within 10 s, pressing the Spacebar as soon as the ‘K’ was found. Row numbers then appeared to the right of each row and participants had 8 s to enter the location of the ‘K’ (using the row number). If time limits were exceeded, the trial sequence was terminated, a beep sound played, and then a new trial sequence started. The task was set to run as two blocks of 21 trials (‘K’ target in each of the 21 possible row locations from 4 – 24) or max. 5 min, whichever came first. Variables recorded included latency of Spacebar response; latency of location response (time from pressing the Spacebar to entry of first digit for ‘K’ row location); and the proportion of correct responses out of all attempted test trials (proportion correct).
The Stroop task was a modified version of the original verbal Stroop word-color association task42 administered via a laptop computer. Participants were shown color words (red, green, blue, black), written in one of the colors (randomly allocated) on the monitor and were required to indicate the color of the word (not its meaning) by pressing the corresponding key as quickly as possible (trying not to make errors). The test involved 84 trials randomly sampled as congruent trials (same color as word), incongruent trials (word and presentation color were not the same), and control trials (colored rectangles). The stimuli remained on the screen until a response was made (with latencies measured from the onset of stimuli). An inter-trial interval of 200 ms and error feedback of 400 ms was applied. Variables recorded included overall proportion correct of all trials; independent mean latencies for correct congruent, incongruent and control trials; and mean proportion correct for all congruent, incongruent and control trials.
Analysis of weekly data (i.e. irrespective of Pod treatment) for pre-coffee measures of cognitive performance was conducted initially to examine the influence of trial order (as an indication of practice effects on the cognitive tasks).
Distributional and Variability Scores
Prior to conducting the analysis of data on the CRT task, incorrect responses, correct-responses with RTs <200 ms (indicative of fast guesses), and correct responses with RTs >1000 ms (indicative of inattention outliers) were removed.43 For analysis of latency data from the Stroop task, incorrect responses, correct-responses with RTs <200 ms (indicative of fast guesses), and correct responses with RTs >3000 ms (indicative of inattention outliers) were removed.44 For the Visual Scanning task, incorrect responses, and correct-responses with RTs <200 ms (indicative of fast guesses) were removed prior to subsequent analysis (note that no upper limit cut-off was applied as the task is dependent on the individual’s ability to identify the target object, although the trial timed out at 10 s). Data cleaning resulted in the elimination of ~5% of total responses. Central tendency (mean) and variability (SD) were calculated for all outcome variables. Ex-Gaussian parameters were also obtained for latency measures on all tasks using the quantile maximum likelihood estimation procedure in QMPE 2.18.45,46 This analysis estimates three parameters: (1) the mean (mu, μ); (2) the standard deviation (sigma, σ) of the Gaussian (normal) component in the RT distribution; and (3) the mean and standard deviation of the exponential component in the RT distribution (tau, τ).43 This procedure provides unbiased parameter estimates and has been shown to be more effective than continuous maximum likelihood estimation for small samples.47,48 All fits successfully converged within 250 iterations.
Statistical Analyses
All statistical procedures were performed using IBM SPSS Statistical Software, Version 24.0 (SPSS Inc., Chicago, IL). Trial order (practice effects) were examined using repeated measures analysis of variance (ANOVA) for baseline measures of cognitive performance variables (CRT overall latency, Visual Scanning spacebar response latency, Stroop control component latency). Ratings of sleep duration and quality were also compared using repeated measures ANOVA. The impact of consuming different Pods (Cosi, Dharkan, Kazaar) on all outcome variables (subjective mood ratings, SSS, coffee sensory analysis, cognitive task performance, ex-Gaussian parameters) and coffee sensory characteristics was compared using a series of multiple factor split plot (within-between groups) ANOVAs. Pairwise comparisons (Bonferroni) were performed where significant main effects were present. One-way ANOVA or paired/independent t-tests were used to conduct post hoc comparisons where significant interaction effects were present. An adjusted-alpha level (i.e. p = 0.05 divided by the number of tests performed) was used to account for multiple comparisons. Effect sizes are reported as partial eta squared (ƞp2). Where assumptions of sphericity in repeated measures analyses were violated, the Greenhouse-Geisser statistic was used. All data are presented as mean ± SD. Statistical significance was accepted as p < 0.05.
Results
Habitual Caffeine Use and Taster Status
Analysis of ‘Taster’ categorized groups indicated a significant difference in mean gLMS ratings of PROP, F(2, 35) = 85.614, p < 0.001, with pairwise comparisons confirming significantly different PROP ratings between all group comparisons (STs: 69 ± 9 mm; MTs: 37 ± 15 mm; NTs: 3 ± 3 mm, p’s < 0.001). Analysis of habitual caffeine consumption between the ‘Higher’ and ‘Lower’ categorized groups indicated a significant difference in mean daily consumption of caffeine, t(36) = 4.624, p < 0.001 (Higher: 333.1 ± 224.4 mg∙d-1; Lower: 89.4 ± 49.1 mg∙d-1).
Sleep Duration and Quality, Subjective Sleepiness (SSS) and Mood Ratings
Sleep duration and self-reported sleep quality were similar across all three Pod treatments (Table 2). A 3 (Coffee Pod) 2 (Pre-Coffee vs. Post-Coffee) 2 (Higher vs. Lower Habitual Caffeine) analysis identified a significant main effect of time, with participants indicating that they felt less sleepy, reported higher levels of Concentration, Alertness, Excitement and Happiness; and had lower ratings of Headache following coffee consumption (Table 2). No other significant main or interactive effects were observed (p’s > 0.05).
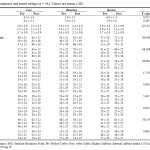 |
Table 2: Subjective sleepiness and mood ratings (n = 38). Values are mean ± SD. Click here to View table |
Cognitive Performance
Trial Order Analysis
No significant main effects were observed for CRT overall latency, F(1.52, 54.87) = 0.711; p = 0.494; Visual Scanning spacebar response latency, F(2, 72) = 1.459; p = 0.239; and Stroop control component latency, F(1.35, 48.43) = 1.584; p = 0.218, indicating no influence of practice or learning effects on cognitive performance tasks over the duration of the study.
Overall CRT Performance
Overall CRT latency before and after consumption of Cosi, Dharkan and Kazaar Pods is shown in Table 3. A 3 (Coffee Pod) 2 (Pre-Coffee vs. Post-Coffee) 2 (Higher vs. Lower Habitual Caffeine) analysis of overall CRT latency identified a significant main effect of time, F(1, 36) = 5.039, p = 0.031, ƞp2 = 0.59; such that the consumption of coffee decreased latency (469 ± 55 vs. 459 ± 50 ms; p = 0.031). No other significant main or interactive effects were observed (p’s > 0.05). A 3 (Coffee Pod) 2 (Pre-Coffee vs. Post-Coffee) 2 (Higher vs. Lower Habitual Caffeine) analysis of overall CRT accuracy failed to identify any significant main or interaction effects (p’s > 0.05). Participants demonstrated a high degree of accuracy (98 ± 2%) in response to reaction stimuli at all stages of testing.
CRT ex-Gaussian Modelling
The ex-Gaussian distribution parameters (μ, σ and τ) from the CRT task before and after consumption of Cosi, Dharkan and Kazaar Pods are indicated in Table 3. A 3 (Coffee Pod) 2 (Pre-Coffee vs. Post-Coffee) 2 (Higher vs. Lower Habitual Caffeine) analysis failed to detect significant main or interactive effects for any of the ex-Gaussian distribution parameters (p’s > 0.05).
Table 3: Choice Reaction Time Latency (n = 38). Values are mean ± SD
| Cosi | Dharkan | Kazaar | ||||||||
| Pre | Post | Pre | Post | Pre | Post | |||||
| Overall Latency (ms) | 465 ± 52 | 457 ± 54 | 466 ± 53 | 463 ± 57 | 477 ± 89 | 458 ± 60 | ||||
| ex-Gaussian Parameters | ||||||||||
| μ (ms) | 402 ± 40 | 403 ± 56 | 408 ± 45 | 402 ± 49 | 416 ± 86 | 401 ± 51 | ||||
| σ (ms) | 33 ± 21 | 36 ± 25 | 35 ± 25 | 30 ± 23 | 31 ± 25 | 28 ± 23 | ||||
| τ (ms) | 63 ± 38 | 52 ± 42 | 55 ± 43 | 60 ± 37 | 61 ± 35 | 59 ± 37 | ||||
μ: mean of Gaussian component; σ: standard deviation of Gaussian component; τ: mean and standard deviation of the exponential component.
Visual Scanning Performance
A 3 (Coffee Pod) 2 (Pre-Coffee vs. Post-Coffee) 2 (Higher vs. Lower Habitual Caffeine) analysis of Visual Scanning Task performance failed to detect significant main or interactive effects for the proportion of correct responses (Pre Cosi = 66 ± 22 %, Post Cosi = 65 ± 23 %, Pre Dharkan = 67 ± 22 %, Post Dharkan = 63 ± 20 %, Pre Kazaar = 65 ± 26 %, Post Kazaar = 65 ± 21 %; p’s > 0.05), latency of the spacebar response (Pre Cosi = 5131 ± 854 ms, Post Cosi = 4931 ± 968 ms, Pre Dharkan = 5141 ± 872 ms, Post Dharkan = 5071 ± 907 ms, Pre Kazaar = 5192 ± 821 ms, Post Kazaar = 5177 ± 906 ms; p’s > 0.05) and latency of the target location (row number) response (Pre Cosi = 1085 ± 296 ms, Post Cosi = 1011 ± 461 ms, Pre Dharkan = 1084 ± 460 ms, Post Dharkan = 1066 ± 461 ms, Pre Kazaar = 1070 ± 299 ms, Post Kazaar = 1093 ± 513 ms; p’s > 0.05). Likewise, analysis failed to detect significant main or interactive effects for any of the ex-Gaussian distribution parameters on measures of spacebar response latency and target location response latency (p’s > 0.05).
Stroop Performance
Proportion Correct (% Accuracy)
A 3 (Coffee Pod) 2 (Pre-Coffee vs. Post-Coffee) 2 (Higher vs. Lower Habitual Caffeine) analysis of proportion correct for the various congruency components of the Stroop task revealed a significant main effect of time for % accuracy on incongruent trials, F(1, 36) = 8.391, p = 0.006, ƞp2 = 0.19; such that the consumption of coffee improved accuracy (91.6 ± 4.2 vs. 93.7 ± 4.2 %; p = 0.006). No significant main effects were observed for congruent or control trials (p’s > 0.05) and no significant interaction effects were observed for any of the congruency components (p’s > 0.05).
Stroop Reaction Time
Mean reaction time results from the Stroop task for the various congruency components are displayed in Fig. 2. A 3 (Coffee Pod) 2 (Pre-Coffee vs. Post-Coffee) 2 (Higher vs. Lower Habitual Caffeine) analysis of congruent trials revealed a significant main effect of time, F(1, 36) = 38.353, p < 0.001, ƞp2 = 0.52; such that the consumption of coffee decreased response time (854 ± 193 vs. 766 ± 156 ms; p < 0.001). A significant time habitual caffeine use group interaction was also identified, F(1, 36) = 5.824, p = 0.021, ƞp2 = 0.14. Post hoc comparisons using an adjusted alpha level (p = 0.013) revealed faster reaction times for both Higher (906 ± 231 vs. 783 ± 154 ms; p < 0.001) and Lower (802 ± 145 vs. 748 ± 157 ms; p = 0.002) habitual caffeine user groups following coffee consumption, but no differences between the groups (p’s > 0.05). Analysis of incongruent trials identified a significant main effect of time, F(1, 36) = 46.004, p < 0.001, ƞp2 = 0.56; such that the consumption of coffee decreased response time (933 ± 202 vs. 826 ± 164 ms; p < 0.001). A significant time habitual caffeine use group interaction was also identified, F(1, 36) = 5.698, p = 0.022, ƞp2 = 0.14. Post hoc comparisons using an adjusted alpha level (p = 0.013) indicated faster reaction times for both Higher (985 ± 226 vs. 841 ± 170 ms; p < 0.001) and Lower (880 ± 174 vs. 811 ± 157 ms; p = 0.002) habitual caffeine users following coffee consumption, but no differences between the groups (p’s > 0.05). Analysis of control trials detected a significant main effect of time, F(1, 36) = 16.629, p < 0.001, ƞp2 = 0.32; such that the consumption of coffee decreased response time (854 ± 186 vs. 783 ± 146 ms; p < 0.001). A significant Pod time interaction, F(2, 72) = 3.654, p = 0.031, ƞp2 = 0.09; was also identified. Post hoc analysis using an adjusted alpha level (p = 0.008) indicated significantly faster reaction times post consumption of Kazaar Pods only (894 ± 279 vs. 770 ± 148 ms, t(37) = 4.345, p < 0.001). No other significant main or interactive effects were observed (p’s > 0.05).
Stroop ex-Gaussian Modelling
The ex-Gaussian distribution parameters (μ, σ and τ) for the various Stroop reaction time components are displayed in Fig. 3.
Congruent Trials
A 3 (Coffee Pod) 2 (Pre-Coffee vs. Post-Coffee) 2 (Higher vs. Lower Habitual Caffeine) analysis of the ex-Gaussian distribution parameters identified a significant main effect of time for μ, F(1, 36) = 6.725, p = 0.014, ƞp2 = 0.16; and τ, F(1, 36) = 5.755, p = 0.022, ƞp2 = 0.14; but not for σ (p > 0.05); such that the consumption of coffee decreased each parameter (μ: 571 ± 151 vs. 518 ± 66 ms, p = 0.014; τ: 290 ± 147 vs. 242 ± 106 ms, p = 0.022). A significant Pod habitual caffeine use group interaction was observed for μ, F(2, 72) = 4.635, p = 0.013, ƞp2 = 0.11; and τ, F(2, 72) = 4.096, p = 0.021, ƞp2 = 0.10. However, post hoc comparisons using an adjusted alpha level (p = 0.008) failed to identify any further significant effects (p’s > 0.008). A Pod time habitual caffeine use group interaction was also observed for τ, F(2, 72) = 4.363, p = 0.016, ƞp2 = 0.11. Post hoc comparisons using an adjusted alpha level (p = 0.004) indicated significantly lower τ values for the Lower habitual caffeine user group compared to the Higher habitual caffeine user group post consumption of Kazaar Pods (144 ± 115 vs. 322 ± 183 ms, t(36) = 3.582, p = 0.001). No other main or interaction effects were observed (p’s > 0.05).
Incongruent Trials
A 3 (Coffee Pod) 2 (Pre-Coffee vs. Post-Coffee) 2 (Higher vs. Lower Habitual Caffeine) analysis of the ex-Gaussian distribution parameters identified a significant main effect of time for μ, F(1, 36) = 16.861, p < 0.001, ƞp2=0.32 and σ, F(1, 36) = 21.747, p < 0.001, ƞp2 = 0.38; but not τ (p > 0.05); such that the consumption of coffee decreased response times for each parameter (μ: 633 ± 110 vs. 548 ± 85 ms, p < 0.001; σ: 163 ± 95 vs. 95 ± 57 ms, p < 0.001). A significant main effect of Pod was observed for τ, F(2, 72) = 4.043, p = 0.022, ƞp2 = 0.10. Pairwise comparisons indicated a significantly lower τ value for Kazaar compared to Cosi Pods (219 ± 114 vs. 295 ± 144 ms, p = 0.029). No other main or interactive effects were observed (p’s > 0.05).
Control Trials
A 3 (Coffee Pod) 2 (Pre-Coffee vs. Post-Coffee) 2 (Higher vs. Lower Habitual Caffeine) analysis of the ex-Gaussian distribution parameters identified a significant main effect of time for τ, F(1, 36) = 10.551, p = 0.003, ƞp2=0.23; such that response times decreased post-coffee consumption (295 ± 99 vs. 236 ± 89 ms, p = 0.003). No other main or interactive effects were observed for τ, or any of the remaining ex-Gaussian parameters (p’s > 0.05).
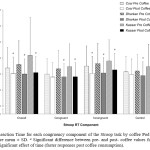 |
Figure 2: Reaction Time for each congruency component of the Stroop task by coffee Pod (n = 38). Values are mean ± SD. a Significant difference between pre- and post- coffee values for Kazaar Pods; b Significant effect of time (faster responses post coffee consumption). Click here to View figure |
Coffee Pod Sensory Analysis Ratings
Fig. 4 shows the mean sensory analysis ratings for each coffee Pod. A 3 (Coffee Pod) 3 (STs vs. MTs vs. NTs) analysis identified a significant main effect of Pod for ratings of Bitterness, F(2, 70) = 19.677, p < 0.001, ƞp2 = 0.36; Sourness, F(2, 70) = 4.385, p = 0.016, ƞp2 = 0.11; Astringency, F(2, 70) = 13.005, p < 0.001, ƞp2 = 0.27; Flavor Intensity, F(1.52, 53.35) = 30.985, p < 0.001, ƞp2 = 0.47; Aroma, F(2, 70) = 30.553, p < 0.001, ƞp2 = 0.47; and Perceived Caffeine Content, F(2, 70) = 30.915, p < 0.001, ƞp2 = 0.47. No interactive effects were observed (p’s > 0.05). Pairwise comparisons revealed higher ratings for Kazaar Pods compared to both Dharkan and Cosi Pods for all sensory characteristics (p’s < 0.05) except Sourness, which was significantly higher than Cosi (p = 0.039), but not Dharkan (p = 0.257). Ratings for Dharkan Pods were also higher than Cosi Pods for all sensory characteristics (p’s < 0.05) except Sourness (p = 0.538). No differences were observed for any of the sensory characteristics by Taster status grouping (p’s > 0.05).
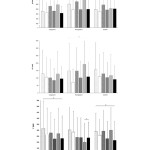 |
Figure. 3. Ex-Gaussian Stroop Reaction Time components for each coffee Pod (n = 38). Values are mean ± SD. a Significant difference between Higher and Lower habitual caffeine users values; b Significant effect of time (faster responses post coffee consumption); c Significant difference compared to Cosi Pods Click here to View figure |
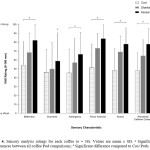 |
Figure 4: Sensory analysis ratings for each coffee (n = 38). Values are mean ± SD. a Significant differences between all coffee Pod comparisons; b Significant difference compared to Cosi Pods Click here to View figure |
Discussion
This study examined the effects of consuming three different varieties of Nespresso® Pod coffee (with similar and contrasting caffeine and flavor intensity ratings) on mood and cognitive performance. Overall, results indicate that consumption of Pod coffee produced arousing/stimulatory effects, irrespective of beverage caffeine content, participants’ habitual caffeine use, and perception differences of sensory characteristics between the Pods. However, translation of these effects to improved cognitive performance was isolated to the Stroop word-color association task, with improvements in task specific components (different congruency trials) dependent on the coffee Pod consumed. These results suggest that drinking Nespresso® Pod coffee can improve mood and cognitive performance. Some of these effects appear to be influenced by the sensory characteristics of the coffee Pods rather than caffeine, whilst others are independent of both caffeine and sensory characteristics.
Results from the present study are in agreement with previous reports, consistently demonstrating that consumption of caffeine/caffeinated coffee elevates mood, reduces fatigue, increases alertness and induces arousal.2,4,18,20,49 Reduced ratings of sleepiness and headache; and increased ratings of concentration, alertness, excitement and happiness were observed following consumption of coffee. The magnitude of this change did not differ across Pods, despite more than a 2-fold increase in caffeine administration between conditions. These results suggest that the mood altering effects of coffee cannot be fully explained by caffeine content, supporting earlier work indicating similar improvements in mood following consumption of various caffeine doses.3,11,20,50 In the present study, the mood enhancing effects of coffee were also similar between ‘Higher’ and ‘Lower’ habitual caffeine consumers. Others have noted previously that caffeine tends to benefit habitual consumers’ mood more so than ‘low’ or ‘non’ consumers.4,13 Inconsistencies in these observations may relate to how ‘low’ and ‘non’ consumers are defined. In the present study, 170 mg∙d-1 was used based on ABS data for mean intakes.27 as a cut-off value to categorize ‘Lower’ and ‘Higher’ users. However, a variety of threshold values (i.e. non/low users: 50 mg∙d-1, <100 mg∙d-1; high users: <100 mg∙d-1, ≥200 mg∙d-1) have been applied previously.11,13 Mood effects in the present study were also not influenced by differences in the sensory characteristics reported between the Pods (i.e. bitterness, astringency, intensity, aroma, perceived caffeine content). This suggests that the mood enhancing properties of coffee are not likely to be motivated by anticipatory effects or consumer awareness (based on manufacturer information provided). Rather, it may reflect differences in the presence of other biologically active components in the various coffee Pods (e.g. flavonoids, theophylline or theobromine).4,51
Performance on the Stroop task was improved following all coffee Pod treatments in the present study. However, performance on specific task components (i.e. accuracy, latency, performance associated with different congruency components of the task) varied depending on coffee Pod treatment. Using comparisons of central tendency (i.e. mean and standard deviation), we observed faster reaction times following consumption of all coffee Pod treatments on all components (control, congruent and incongruent trials) of the Stroop task. The overall effects were explored further using whole latency distributions (i.e. ex-Gaussian), which facilitates a more comprehensive analysis of reaction time data than measures of central tendency.43 Results from this analysis indicated that reaction time improvements for control trials were driven by a reduction in τ (i.e. the mean and SD of the exponential component), which indicates a reduction in data forcing skewness (i.e. data away from the mean). Improvements for congruent trials were driven by reductions in both μ (i.e. the mean of the Gaussian component or normal part of the curve where the majority of responses are recorded) and τ; whilst improvements for incongruent trials were facilitated by reductions in both μ and σ (i.e. the SD of the Gaussian component). There also appeared to be some influence of habitual caffeine use on Stroop performance, but this was isolated to congruent trials in the τ component and was not uniform between all Pods (differences were only present with Kazaar Pods). Accuracy of responses on the incongruent trials was improved following coffee consumption. However, the clinical significance of this is likely to be limited given that accuracy both pre- and post- coffee consumption was relatively high (>90%) at all stages of testing and for all congruency components of the task; and the largest increase in accuracy was 4%, corresponding to one additional correct response.
The Stroop task is a measure of attentional processes.52 Control and congruent trials measure latency of responses associated with selective attention and concentration. Incongruent trials, however, measure latency of responses based on interference of stimuli in one dimension with recognition of stimuli in another dimension. Thus, the incongruent component of the Stroop task is associated with the core executive function, interference control (selective attention and cognitive inhibition).38,52,53 Previous investigations of caffeine/coffee consumption and Stroop performance have produced contrasting findings, with some studies indicating improvement in reaction times, number of responses, response errors and Stroop interference following acute caffeine administration at doses ranging from 50 – 250 mg9,38,54-56, while others have either reported no effect57-59 or performance impairment60 following caffeine (100 – 400 mg) ingestion. Discrepancies in findings could be related to task presentation (e.g. word-color vs. numerical versions) and practice effects.9,56,58 In an attempt to elucidate the effect of coffee/caffeine on Stroop performance, the present study used the common word-color task presentation, ensured practice effects where minimised and, in this context, identified that coffee did enhance Stroop task performance. Furthermore, the results clarify that these effects are not consistent across different attentional processes (i.e. μ, τ and σ were all effected under the different trial conditions) and that these effects occur irrespective of differences in caffeine content and sensory characteristics of the coffee.
The beneficial effects of consuming caffeine or caffeinated coffee on choice reaction time and visual recognition reaction time have been highlighted in a number of review articles.2,3,61-63 We observed an influence of coffee Pod consumption on overall choice reaction time latency. However, whole latency distribution (i.e. ex-Gaussian) analysis failed to corroborate this effect. All measures of visual scanning performance were unaffected by coffee consumption; although changes were generally in the direction of improvement. In keeping with previous reports, caffeine dose and habitual caffeine use were not influential factors on these results.4,63 One possible explanation for the contrasting findings is that the stimulant properties of caffeine (even when individuals are aware of consumption) may only produce relatively small effect sizes, which are not always readily detected in healthy young adults.64-66 It is also possible that subtle differences in the type of task used (i.e. a variety of choice reaction time tasks with different visual stimuli have been employed) may account for these inconsistencies. Alternatively, the caffeine dose provided via the coffee Pods may have been too low to induce cognitive performance effects on these specific tasks. Indeed, Childs39 observed significant changes in mean latency on a visual scanning task similar to that employed in the present study; only when 400 mg of caffeine (via capsules) was provided. The 200 mg dose of caffeine (i.e. similar to the highest dose provided with the Kazaar coffee condition in the current study) failed to produce cognitive enhancements.
One of the limitations of the present study was the lack of a placebo (i.e. decaffeinated coffee) condition in the treatment design. Thus, we are unable to determine if sensory properties act independently of caffeine to influence mood and cognitive performance. However, the intention of the study was to examine the combined effects of caffeine and the sensory characteristics of Nespresso® Pod Coffee (i.e. consumers’ perceptions of flavor, intensity and caffeine content, based on “taste” and consumer product information) on mood and cognitive performance. We believe this study design is more ecologically valid, as individuals are likely to know when they have consumed caffeinated coffee in natural environments. Further, we supplied participants with two coffee Pods to consume for each of the different trials in this study. While some individuals may prepare coffee using two Pods in free-living environments, it is likely that most individuals would only use a single Pod. Thus, the caffeine content of each coffee in the present study may be higher than what individuals are normally exposed to with Nespresso® Pod coffee. This may have also influenced sensory characteristics of the coffee. Nonetheless, we employed this method in order to provide a dose of caffeine in at least one of the trials (i.e. Kazaar) that was equivalent to levels of caffeine that consumers might be exposed to from retail coffee outlets (i.e. >200 mg).67 Further, rate of caffeine metabolism has been shown to influence individuals perceptions of coffee.68 We did not assess participant’s caffeine metabolism rate, thus individual differences in caffeine metabolism may contribute to differences in sensitivity to the pharmacological effects of caffeine. In addition, no objective marker of caffeine level (i.e. plasma or salivary caffeine) was collected at the start of trials or following coffee consumption. Thus, we are unable to determine absolute compliance to overnight caffeine abstinence and levels of circulating caffeine in the body prior to commencing the cognitive tasks. This is important because some degree of inter-individual variability exists in the rapidity of reaching peak caffeine levels in the blood69 and some reports indicate mood and performance effects of the first but not subsequent exposures to caffeine consumed after overnight abstinence.49 Finally, this study was conducted in healthy, young participants (the majority being female) using a small number of selected cognitive tasks. Future research should consider examining the effects on performance tasks that measure other cognitive domains and with different demographic groups (e.g. older individuals, equal gender groups to allow comparisons).
In summary, consumption of Nespresso® Pod coffee (with both similar and contrasting caffeine and flavor intensity ratings) has a positive effect on mood and cognitive performance. These effects occur irrespective of the caffeine content within Pods, habitual caffeine consumption behavior, and differences in sensory characteristics between the Pods. However, the cognitive performance benefits of consuming Pod coffee appear to be task dependent.
Acknowledgements
The authors declare no conflicts of interest. This research received no specific grant from any funding agency, commercial or not-for-profit sectors.
References
- Grigg D. The worlds of tea and coffee: Patterns of consumption. Geo Journal. 2002;57(4):283-94.
CrossRef - McLellan T. M., Caldwell J. A., Lieberman H. R. A review of caffeine’s effects on cognitive, physical and occupational performance. Neuroscience and Biobehavioral Reviews. 2016;71:294-312.
CrossRef - Lieberman H. R., Wurtman R. J., Emde G. G., Roberts C., Coviella I. L. G. The effects of low doses of caffeine on human performance and mood. Psychopharmacology. 1987;92(3):308-12.
CrossRef - Ruxton C. H. S. The impact of caffeine on mood, cognitive function, performance and hydration: a review of benefits and risks. Nutrition Bulletin. 2008;33(1):15-25.
CrossRef - Rogers P. J. Caffeine, mood and mental performance in everyday life. Nutrition Bulletin. 2007;32:84-9.
CrossRef - Brunye T. T., Mahoney C. R., Lieberman H. R., Giles G. E., Taylor H. A. Acute caffeine consumption enhances the executive control of visual attention in habitual consumers. Brain and Cognition. 2010;74(3):186-92.
CrossRef - Killgore W. D., Kahn-Greene E. T., Grugle N. L., Killgore D. B., Balkin T. J. Sustaining executive functions during sleep deprivation: A comparison of caffeine, dextroamphetamine, and modafinil. Sleep. 2009;32(2):205-16.
CrossRef - Killgore W. D., Kamimori G. H., Balkin T. J. Caffeine improves the efficiency of planning and sequencing abilities during sleep deprivation. Journal of Clinical Psychopharmacology. 2014; 34(5):660-2.
CrossRef - Soar K., Chapman E., Lavan N., Jansari A. S., Turner J. J. D. Investigating the effects of caffeine on executive functions using traditional Stroop and a new ecologically-valid virtual reality task, the Jansari assessment of Executive Functions (JEF©). Appetite. 2016;105:156-63.
CrossRef - Amendola C. A., Gabrieli J. D. E., Lieberman H. R. Caffeine’s Effects on Performance and Mood are Independent of Age and Gender. Nutritional Neuroscience. 1998;1(4):269-80.
CrossRef - Smit H. J., Rogers P. J. Effects of low doses of caffeine on cognitive performance, mood and thirst in low and higher caffeine consumers. Psychopharmacology. 2000;152(2):167-73.
CrossRef - Smith A. P., Christopher G., Sutherland D. Effects of caffeine in overnight-withdrawn consumers and non-consumers. Nutritional Neuroscience. 2006;9(1-2): 63-71.
CrossRef - Haskell C. F., Kennedy D. O., Wesnes K. A., Scholey A. B. Cognitive and mood improvements of caffeine in habitual consumers and habitual non-consumers of caffeine. Psychopharmacology. 2005;179(4):813-25.
CrossRef - Hewlett P., Smith A. Acute effects of caffeine in volunteers with different patterns of regular consumption. Human Psychopharmacology: Clinical and Experimental. 2006; 21(3): 167-80.
CrossRef - Magkos F., Kavouras S. A. Caffeine Use in Sports, Pharmacokinetics in Man, and Cellular Mechanisms of Action. Critical Reviews in Food Science and Nutrition. 2005; 45(7-8):535-62.
CrossRef - Nehlig A., Daval J. L., Debry G. Caffeine and the central nervous system: mechanisms of action, biochemical, metabolic and psychostimulant effects. Brain Research Reviews. 1992;17(2): 139-70.
CrossRef - Skinner T. L., Jenkins D. G., Folling J., Leveritt M. D., Coombes J. S., Taaffe D. R. Influence of carbohydrate on serum caffeine concentrations following caffeine ingestion. Journal of Science and Medicine in Sport. 2013;16(4):343-7.
CrossRef - Adan A., Prat G., Fabbri M., Sànchez-Turet M. Early effects of caffeinated and decaffeinated coffee on subjective state and gender differences. Progress in Neuro-Psychopharmacology and Biological Psychiatry. 2008;32(7):1698-703.
CrossRef - Durlach P. J., Edmunds R., Howard L., Tipper S. P. A Rapid Effect of Caffeinated Beverages on Two Choice Reaction Time Tasks. Nutritional Neuroscience. 2002; 5(6):433-42.
CrossRef - Quinlan P. T., Lane J., Moore K. L., Aspen J., Rycroft J. A., O’Brien D. C. The acute physiological and mood effects of tea and coffee: the role of caffeine level. Pharmacology, Biochemistry, and Behavior. 2000; 66(1): 19-28.
CrossRef - Dawkins L., Shahzad F.-Z., Ahmed S. S., Edmonds C. J. Expectation of having consumed caffeine can improve performance and mood. Appetite. 2011; 57(3): 597-600.
CrossRef - Elliman N. A., Ash J., Green M. W. Pre-existent expectancy effects in the relationship between caffeine and performance. Appetite. 2010;55(2):355-8.
CrossRef - Knowles J. B. Conditioning and the placebo effect: The effects of decaffeinated coffee on simple reaction time in habitual coffee drinkers. Behaviour Research and Therapy; 1963; 1(2): 151-7.
CrossRef - Fukuda M., Aoyama K. Decaffeinated coffee induces a faster conditioned reaction time even when participants know that the drink does not contain caffeine. Learning and Motivation. 2017; 59(Supplement C): 11-8.
CrossRef - Desbrow B., Hall S., Irwin C. Caffeine Content of Nespresso® Pod Coffee. Nutrition Society of Australia National Scientific Meeting; Melbourne, VIC, Australia. 2016.
- Desbrow B. Caffeine calculator (Online) Griffith University, Gold Coast, Australia: (2011). [Available from: http://www.griffith.edu.au/health/centre-health-practice-innovation/research/nutrition/caffeine-calculator].
- Australian Bureau of Statistics, Food Standards Australia New Zealand. Australian Health Survey: Usual Nutrient Intakes, 2011-12. Commonwealth of Australia. 2015.
- Bufe B., Breslin P. A., Kuhn C., Reed D. R., Tharp C. D., Slack J. P., et al. The molecular basis of individual differences in phenylthiocarbamide and propylthiouracil bitterness perception. Current Biology.2005; 15(4): 322-7.
CrossRef - Ly A., Drewnowski A. PROP (6-n-Propylthiouracil) Tasting and Sensory Responses to Caffeine, Sucrose, Neohesperidin Dihydrochalcone and Chocolate. Chemical Senses; 2001; 26(1): 41-7.
CrossRef - Masi C., Dinnella C., Monteleone E., Prescott J. The impact of individual variations in taste sensitivity on coffee perceptions and preferences. Physiology & Behavior. 2015;138: 219-26.
CrossRef - Bartoshuk L. M., Rifkin B., Marks L. E., Hooper J. E. Bitterness of KCl and benzoate: related to genetic status for sensitivity to PTC/PROP. Chemical Senses. 1988; 13(4): 517-28.
CrossRef - Hall M. J., Bartoshuk L. M., Cain W. S., Stevens J. C. PTC taste blindness and the taste of caffeine. Nature. 1975; 253(5491):442-3.
CrossRef - Leach E. J., Noble A. C. Comparison of bitterness of caffeine and quinine by a time – intensity procedure. Chemical Senses. 1986;11(3):339-45.
CrossRef - Mela D. J. Bitter taste intensity: the effect of tastant and thiourea taster status. Chemical Senses. 1989;14(1):131-5.
CrossRef - Bartoshuk L. M., Duffy V. B., Fast K., Green B. G., Prutkin J., Snyder D. J. Labeled scales (e.g., category, Likert, VAS) and invalid across-group comparisons: what we have learned from genetic variation in taste. Food Quality and Preference.2002. 14(2): 125-38.
CrossRef - Bartoshuk L. M. The biological basis of food perception and acceptance. Food Quality and Preference. 1993; 4(1):21-32.
CrossRef - Hoddes E., Zarcone V., Dement W. Development and use of Stanford Sleepiness scale (SSS). Psychophysiology. 1972; 9(1): 150.
- Dixit A., Goyal A., Thawani R., Vaney N. Effect of Caffeine on Information Processing: Evidence from Stroop Task. Indian Journal of Psychological Medicine. 2012;34(3):218-22.
CrossRef - Childs J. M. Caffeine consumption and target scanning performance. Human Factors. 1978;20(1):91-6.
CrossRef - Englund C. E., Reeves D. L., Shingledecker C. A., Thorne D. R., Wilson K. P., Hegge F. W. The Unified Tri-Service Cognitive Performance Assessment Battery (UTC-PAB): I. Design and specification of the battery. Naval Health research Center, San Diego, CA; (1987). Contract No.: (Report No. NHRC-TR-87-10).
- Neisser U. Decision-Time without Reaction-Time: Experiments in Visual Scanning. The American Journal of Psychology. 1963;76(3):376-85.
CrossRef - Stroop J. R. Studies of interference in serial verbal reactions. Journal of Experimental Psychology. 1935;18(6):643.
CrossRef - Whelan R. Effective Analysis of Reaction Time Data. The Psychological Record. 2008;58(3):475-82.
CrossRef - Heathcote A., Popiel S. J., Mewhort D. J. Analysis of response time distributions: An example using the Stroop task. Psychological Bulletin. 1991;109(2):340-7.
CrossRef - Cousineau D., Brown S., Heathcote A. Fitting distributions using maximum likelihood: methods and packages. Behavior Research Methods, Instruments & Computers; 2004; 36(4):742-56.
CrossRef - Heathcote A., Brown S., Mewhort D. J. Quantile maximum likelihood estimation of response time distributions. Psychonomic Bulletin & Review. 2002; 9(2):394-401.
CrossRef - Heathcote A., Brown S. Reply to Speckman and Rouder: A theoretical basis for QML. Psychonomic Bulletin & Review. 2004; 11(3): 577-8.
CrossRef - Speckman P. L., Rouder J. N. A comment on Heathcote, Brown, and Mewhort’s QMLE method for response time distributions. Psychonomic Bulletin & Review. 200411(3):574-6.
CrossRef - Robelin M., Rogers P. J. Mood and psychomotor performance effects of the first, but not of subsequent, cup-of-coffee equivalent doses of caffeine consumed after overnight caffeine abstinence. Behavioural Pharmacology. 1998;9(7): 611-8.
CrossRef - Warburton D. M. Effects of caffeine on cognition and mood without caffeine abstinence. Psychopharmacology; 1995;119(1): 66-70.
CrossRef - Hall S., Desbrow B., Anoopkumar-Dukie S., Davey A. K., Arora D., McDermott C., et al. A review of the bioactivity of coffee, caffeine and key coffee constituents on inflammatory responses linked to depression. Food Research International. 2015; 76(3): 626-36.
CrossRef - MacLeod C. M. The Stroop task: The “gold standard” of attentional measures. Journal of Experimental Psychology: General. 1992;121(1): 12-4.
CrossRef - Diamond A. Executive functions. Annual Review of Psychology. 2013; 64: 135-68.
CrossRef - Dodd F. L., Kennedy D. O., Riby L. M., Haskell-Ramsay C. F. A double-blind, placebo-controlled study evaluating the effects of caffeine and L-theanine both alone and in combination on cerebral blood flow, cognition and mood. Psychopharmacology. 2015;232(14):2563-76.
CrossRef - Hasenfratz M., Bättig K. Action profiles of smoking and caffeine: Stroop effect, EEG, and peripheral physiology. Pharmacology, Biochemistry, and Behavior. 1992; 42(1): 155-61.
CrossRef - Kenemans J. L., Wieleman J. S. T., Zeegers M., Verbaten M. N. Caffeine and Stroop Interference. Pharmacology, Biochemistry, and Behavior. 1999;63(4):589-98.
CrossRef - Deslandes A. C., Veiga H., Cagy M., Piedade R., Pompeu F., Ribeiro P. Effects of caffeine on the electrophysiological, cognitive and motor responses of the central nervous system. Brazilian Journal of Medical and Biological Research. 2005; 38: 1077-86.
CrossRef - Edwards S., Brice C., Craig C., Penri-Jones R. Effects of caffeine, practice, and mode of presentation on Stroop task performance. Pharmacology, Biochemistry, and Behavior. 1996;54(2): 309-15.
CrossRef - Schmitt J. A., Hogervorst E., Vuurman E. F., Jolles J., Riedel W. J. Memory functions and focussed attention in middle-aged and elderly subjects are unaffected by a low, acute dose of caffeine. Journal of Nutrition, Health & Aging. 2003;7(5):301-3.
- Foreman N., Barraclough S., Moore C., Mehta A., Madon M. High doses of caffeine impair performance of a numerical version of the Stroop task in men. Pharmacology, Biochemistry, and Behavior. 1989;32(2):399-403
CrossRef - Nehlig A. Is caffeine a cognitive enhancer? Journal of Alzheimer’s Disease. 2010;20 Suppl 1:S85-94.
CrossRef - Smith A. Effects of caffeine on human behavior. Food and Chemical Toxicology. 2002;40(9): 1243-55.
CrossRef - Einöther S. J. L., Giesbrecht T. Caffeine as an attention enhancer: reviewing existing assumptions. Psychopharmacology. 2013;225(2):251-74.
CrossRef - Fagan D., Swift C. G., Tiplady B. Effects of caffeine on vigilance and other performance tests in normal subjects. Journal of Psychopharmacology. 1988;2(1):19-25.
CrossRef - Mackay M., Tiplady B., Scholey A. B. Interactions between alcohol and caffeine in relation to psychomotor speed and accuracy. Human Psychopharmacology: Clinical and Experimental. 2002;17(3):151-6.
CrossRef - Swift C. G., Tiplady B. The effects of age on the response to caffeine. Psychopharmacology. 1988;94(1):29-31.
CrossRef - Desbrow B., Hughes R., Leveritt M., Scheelings P. An examination of consumer exposure to caffeine from retail coffee outlets. Food Chem Toxicol. 2007;45(9): 1588-92.
CrossRef - Masi C., Dinnella C., Pirastu N., Prescott J., Monteleone E. Caffeine metabolism rate influences coffee perception, preferences and intake. Food Quality and Preference. 2016; 53: 97-104.
CrossRef - Newton R., Broughton L. J., Lind M. J., Morrison P. J., Rogers H. J., Bradbrook I. D. Plasma and salivary pharmacokinetics of caffeine in man. European Journal of Clinical Pharmacology. 1981;21(1):45-52.
CrossRef
Accepted on: 10-05-2018
Second Review by: Dr. Jesús A. Vázquez Rodríguez (Mexico)
Final Approval by: Prof. Yuan Soon


Web of Science Coverage
Emerging Sources Citation Index (ESCI)
2024 Journal Impact Factor: 1.1
Scopus Journal Metrics
CiteScore 2025: 2.6
CiteScore Details
Sustainable Nutrition: Food Systems, Nutrient Retention, and Public Health Impact
![]()
This journal is a member of, and subscribes to the principles of, the Committee on Publication Ethics (COPE)


