Risk of Obesity Among Female School Teachers and its Associated Health Problems
Sarah Jane Monica1*
, Madhanagopal. R2 1Department of Home Science, Women’s Christian College, Chennai: 600 006, Tamilnadu, India
2Department of Statistics, Madras Christian College, Chennai: 600 059, Tamilnadu, India.
Corresponding author Email: sarahjane.monica@gmail.com
DOI : http://dx.doi.org/10.12944/CRNFSJ.6.2.15
Download this article as:
![]()
Obesity is considered to be a major health problem throughout the world. Factors contributing to obesity include increased intake of calorie dense foods and physical inactivity. Teachers represent one of the most important, large and growing sector of workforce in many countries. The objective of the present study was to determine risk of obesity among female school teachers along with various factors and health problems associated with it. A descriptive cum cross-sectional survey was conducted among 500 female school teachers. Anthropometric measurements such as height, body weight and waist circumference were measured. BMI was calculated and blood pressure was recorded. Results indicated that 43.2% of the teachers had Grade I obesity, 20.4% had Grade II obesity and 6.6% had Grade III obesity thereby indicating obesity as a significant health problem among teachers. Factors such as age, waist circumference, intake of junk foods, physical inactivity and BMI were significantly associated with obesity. In addition, health issues such as hypertension and arthritis was also found to be associated with obesity. The study therefore recommends the need to promote healthy lifestyle for school teachers that can be achieved through appropriate health education and interventional measures.
KEYWORDS:Health intervention; Obesity; Teachers; Risk factors.
Introduction
Overweight and obesity is considered to be a major public health problem in both developed and developing countries.1 World Health Statistics 2012 reports that one in six adults is obese and about 2.8 million individuals die every year due to overweight or obesity.2 In developing countries like India, the prevalence rate of obesity is increasing at an alarming rate with more than 30 million obese individual and is found to be more acute in women. 3 Among mega cities in India, Chennai has the highest (39%) proportion of overweight or obese urban women, followed by Hyderabad (34%), and Kolkata (30%).
Nowadays women are also employed in various working sectors in order to increase their socio-economic status.4 Teachers represent one of the most important, large and growing sector of workforce in many countries. They are often overwhelmed with multiple duties such as teaching, curriculum concerns, career development and census enumeration as a result of which they are exposed to stress.5 Many a times, their health gets affected due to the dual role they play; one is family and the other one at job. Public school teachers are also vulnerable to develop non communicable diseases such as cardiovascular diseases, diabetes and hypertension.6 Hence the prime objective of the study was to assess risk of obesity among female school teachers along with various modifiable factors and health issues associated with it.
Methodology
The present study was a community based descriptive cum cross-sectional survey that was conducted among 500 female school teachers between January 2017 and January 2018 in Chennai, the capital city of Tamil Nadu state. Schools were selected based on willingness to participate and enrollment with the goal of identifying population with and without obesity among school teachers. Permission from school authorities as well as approval of study protocol by the Independent Ethics Committee was obtained before the commencement of the study. Data collection comprised of personal interview along with physical and clinical assessments. Information pertaining to occupation details, dietary pattern, health problems and physical activity pattern was obtained using a structured pre-tested questionnaire. Pre-testing of questionnaire was carried out by conducting a pilot study.
Anthropometric measurements
Anthropometric measurements were measured using standardized techniques.7 Height (in centimeters) was measured using a wall mounted measuring tape to the nearest 0.1cm (Gadget Hero Stature meter: 200cms). Body weight (in Kgs) was measured using a portable digital weighing machine that was kept on a flat surface (Omron HBF -375). Both these measurements were taken with subjects wearing minimal clothes and without shoes. Waist circumference (in centimeters) was measured by measuring the distance around the waist half inch above the umbilicus (belly button) using a non-stretchable plastic measuring tape. Waist circumference more than 80 cm indicated abdominal obesity.8 Body mass index (BMI) was used as a marker for overweight and obesity in the present study and was calculated as weight in kilograms divided by height in meter square. BMI cut offs for Asia pacific guidelines given by WHO (2000) was used in the present study. According to this classification, overweight is defined as BMI > 23 Kg/m2with or without abdominal obesity and BMI > 25Kg/m2 was considered as generalized obesity.9
Clinical assessment
Blood pressure was measured using an automated digital electronic device (Rossmax model ®: MJ701) after the subjects had rested for at least 5 minutes in a seated position with the arm rested on a table. Two separate readings were taken and the average was considered as the final reading. Blood pressure was categorized according to the classification given by Joint National Committee on Prevention, Detection, Evaluation and Treatment of High Blood Pressure.10
Statistical Analysis
All data analysis were performed using SPSS (version 15.0). Completeness and consistency of data were checked by running frequency for each variable individually. Descriptive statistics such as frequency, percentage, mean and standard deviation were used. Chi-square test was used to compare two categorical variables. In addition, multiple logistic regression analysis was carried out for further evaluation of variables and its impact on obesity. Odds ratio (OR) along with its respective 95% confidence interval was also reported.
Results and Discussion
Table 1: Distribution of teachers based on occupational details
| Particulars | Frequency | Percent | |
| Age (years) | < 25 | 34 | 6.8 |
| 25 – 35 | 123 | 24.6 | |
| 35 – 45 | 173 | 34.6 | |
| 45 – 55 | 142 | 28.4 | |
| > 55 | 28 | 5.6 | |
| Annual Income (Rupees) | < 90,000 | 5 | 1.0 |
| 90,000 – 2,00,000 | 123 | 24.6 | |
| 2,00,000 – 10,00,000 | 353 | 70.6 | |
| > 10,00,000 | 19 | 3.8 | |
| Educational qualification | Under graduates | 196 | 39.2 |
| Post graduates | 304 | 60.8 | |
| Class handled | Primary | 220 | 44.0 |
| Middle | 101 | 20.2 | |
| High and higher secondary | 179 | 35.8 | |
| Special class | Yes | 236 | 47.2 |
| No | 264 | 52.8 | |
| Teaching experience | 1 – 5 | 150 | 30.0 |
| 6 – 10 | 127 | 25.4 | |
| 11 – 15 | 75 | 15.0 | |
| 15 – 20 | 68 | 13.6 | |
| 21 – 25 | 47 | 9.4 | |
| > 25 | 33 | 6.6 | |
From the above table, it is clear that the age of the teachers who participated in the study ranged between 21-58 years with 34.6 percent of them belonging to the age group 35-45 years. Socioeconomic status refers to a person´s social status relative to other members in their society. In the present study, the income level of the teachers was measured as the total annual income of all family members using the classification given by National Council of Applied Economics and Research.11 According to this classification, a greater percentage of the teachers (70.6%) belonged to the middle class category with annual family income of Rs.2, 00,000-10,000,000.
With regard to educational qualification, since teachers were chosen as the target group, all of them were graduates. Majority of the teachers (60.8%) were post-graduates and the remaining were under-graduates. It is seen that about 35.8 percent of the teachers took classes for high and higher secondary students while 20.2 percent of them were in-charge of handling classes for the middle school children. 47.2 percent of the teachers reported taking special classes after school hours. With regard to teaching experience, 30 percent of the teachers had minimum of 3 years of teaching experience while 13.6 percent of them reported that they were in teaching profession for more than 15 years.
Table 2: Mean anthropometric and blood pressure measurements
| AnthropometricMeasurements | Height (cm) | 156.58±6.24 | |
| Body weight (Kgs) | 67.31± 11.90 | ||
| Body Mass Index (Kg/m2) | 27.38± 4.49 | ||
| Waist circumference (cm)Mean =85.68±10.75 | <80 cm | 28.2(141) | |
| >80 cm | 71.8(359) | ||
| Blood pressure | Systolic blood pressure (mmHg)Mean=115.50± 17.92 | Normal | 70.8 (354) |
| Pre-hypertension | 10.4(52) | ||
| Hypertension | 18.8(94) | ||
| Diastolic blood pressure (mmHg)Mean= 73.02± 11.15 | Normal | 79.6(398) | |
| Pre-hypertension | 14.4(72) | ||
| Hypertension | 6 (30) | ||
Figure in parentheses indicates frequency
It is clear that teachers had a higher mean of anthropometric measurements like BMI and waist circumference when compared to the normal cut off values. The mean Body Mass Index and mean waist circumference was found to be 27.38± 4.49 Kg/m2 and 85.68±10.75 cm respectively (Table 2). Blood pressure was categorized according to the classification given by Joint National Committee on Prevention, Detection, Evaluation and Treatment of High Blood Pressure. Based on this classification 70.8 percent of teachers had normal systolic blood pressure (<120 mmHg) and 79.63 percent had normal diastolic blood pressure (<80 mmHg). 10.4 percent had a systolic blood pressure from 120-129 mmHg indicating that the teachers are pre-hypertensive. 18.8 percent of them were in stage I hypertension (>130 mmHg). Based on diastolic blood pressure levels 14.4 percent were found to be in pre-hypertensive stage (80-89 mmHg) and 6 percent were identified to in stage I hypertension(>90 mmHg).
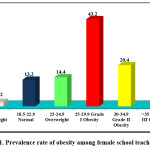 |
Figure 1: Prevalence rate of obesity among female school teachers |
An individual’s weight depends on various factors such as genetic, behavioral, ethnic and socio-economic factors. Excess body weight is an independent risk factor for numerous health problems. More the body weight, greater is the BMI; and an increase in BMI increases the risk of overweight and obesity. In the present study the prevalence rate of obesity among female school teachers was found to be 70.2% (Fig1) with 43.2% of them having Grade I obesity, 20.4% with Grade II obesity and only a small percent (6.6%) came under Grade III obesity category. Rocha et al.,12 reported the prevalence rate of overweight/obesity to be 47.2% among teachers indicating obesity as a major health problem among school teachers. Misra et al.,13 reported that in countries like India, several factors such as urbanization, increased consumption of junk and processed foods along with little or no physical activity increases the risk of being obese. Being overweight (BMI 23-24.9 Kg/m2) or obese (BMI ≥25 Kg/m2) is considered to be an independent risk factor for several chronic disease conditions including coronary heart disease, hypertension, elevated cholesterol, and diabetes. The prevalence of these conditions increases as BMI increases.14,15 Hence screening for obesity and maintaining adequate body weight is necessary to prevent the onset of chronic illnesses.
Table 4: Risk factors associated with obesity
| Risk factors | Obesity | Chi-square value | p value | ||
| Yes | No | ||||
| Age (years) | < 25 | 8 | 26 | 51.05 | 0.000** |
| 25 – 35 | 81 | 42 | |||
| 35 – 45 | 124 | 49 | |||
| 45 – 55 | 120 | 22 | |||
| > 55 | 18 | 10 | |||
| Waist circumference (cm) | <80 | 38 | 103 | 169.95 | 0.000** |
| >80 | 313 | 46 | |||
| Annual income(Rupees) | < 90,000 | 3 | 2 | 1.82 | 0.612NS |
| 90,000 – 2,00,000 | 82 | 41 | |||
| 2,00,000 – 10,00,000 | 251 | 102 | |||
| > 10,00,000 | 15 | 4 | |||
| Body Mass Index (BMI)Kg/m2 | <18.5 | 0 | 11 | 500.00 | 0.000** |
| 18.5 – 22.9 | 0 | 66 | |||
| 23 – 24.9 | 0 | 72 | |||
| 25 – 29.9 | 216 | 0 | |||
| 30 – 34.9 | 102 | 0 | |||
| > 35 | 33 | 0 | |||
| Junk food consumption | Yes | 133 | 75 | 6.62 | 0.010* |
| No | 218 | 74 | |||
| PhysicalActivity | Yes | 303 | 113 | 7.81 | 0.006** |
| No | 48 | 36 | |||
| Type of diet | Vegetarian | 65 | 30 | 0.18 | 0.91NS |
| Non-Vegetarian | 281 | 117 | |||
| Ovo- Vegetarian | 5 | 2 | |||
| Intake of salty foods | Yes | 311 | 129 | 0.40 | 0.52NS |
| No | 40 | 20 | |||
** Significant at p<0.01
* Significant at p<0.05
NS – Not significant
Findings of the study indicates that age along with other modifiable lifestyle determinants such as waist circumference, BMI, intake of junk foods and physical activity was significantly associated with obesity(Table 4).As age increases, the risk of developing several non-communicable diseases such as diabetes, hypertension, cardiovascular diseases and obesity also increases. With globalization, the consumption of junk foods is becoming popular and a significant association was noted between junk food consumption and obesity (p<0.05). A combined analysis of the Nurses’ Health Study and Health Professionals Follow-Up Study showed that French fried potatoes, processed meats, and unprocessed meats, all usual components of typical western-style food fare resulted in weight gain thereby leading to obesity.16
Another two main factors that was associated with obesity in the present study was waist circumference and increased BMI. BMI is not only linked with obesity but previous studies indicate that BMI is a risk factor for pre-diabetes and diabetes.17,18 In the present study it is clear that 6.6% of obese school teachers had diabetes (Table 6). Results of the present study is in par with findings of Abtahi et al.,19 who reported a strong relationship increased BMI and risk of developing pre-diabetes or diabetes among school teachers.
In the current study, physical activity levels of the teachers were assessed using the physical activity index score given by Sharkey and Gaskell.20 According to this tool as the intensity, duration and frequency of exercise increases, the fitness also increases and a score of 40 is an indicator than the individual is actively involved in regular physical activity. On analyzing the scores obtained, it was found that majority of them obtained a physical activity index score below 40 thereby indicating that the teachers led a sedentary type of life. The result indicated that being physically inactive was significantly associated with obesity (p<0.01).Several studies have demonstrated that leading a sedentary lifestyle, independent from overall physical activity levels, is adversely associated with metabolic and atherogenic risk factors.21
Table 5: Logistic regression analysis
| Risk factors | Odds ratio (OR) | 95% confidence interval | p value | |
| Lower | Upper | |||
| Age | 0.978 | 0.947 | 1.010 | 0.176NS |
| Waist circumference | 1.314 | 1.246 | 1.386 | 0.000* |
| Physical inactivity | 0.474 | 0.266 | 0.844 | 0.011* |
| Junk food consumption | 3.366 | 1.654 | 6.848 | 0.001* |
*Significant at p<0.05
NS – Not significant
Table 5 shows the results of multiple logistic regression analysis. For this analysis, obesity was taken as the dependent variable and various risk factors such as age, waist circumference, physical inactivity and intake of junk foods were considered as independent variables. Risk factors such as increased waist circumference, physical inactivity and junk food consumption was significantly associated with obesity (p<0.05).
Table 6: Health problems associated with obesity
| Health issues | Obesity | Chi-square value | p value | ||
| No | Yes | ||||
| Diabetes Mellitus | No | 138 | 318 | 0.548 | 0.466NS |
| Yes | 11 | 33 | |||
| Hypertension | No | 139 | 292 | 10.08 | 0.003** |
| Yes | 10 | 59 | |||
| Dyslipidemia | No | 147 | 338 | 2.32 | 0.157NS |
| Yes | 2 | 13 | |||
| Arthritis | No | 142 | 308 | 7.54 | 0.010* |
| Yes | 7 | 43 | |||
** Significant at p<0.01
*Significant at p<0.05
NS – Not significant
Excess weight has reached epidemic proportions globally. Results of the present study indicate that obesity was found to be significantly associated with health problems such as hypertension and arthritis (Table 6).Obesity is widely accepted as the leading risk factor for osteoarthritis, especially knee osteoarthritis.22 Also accumulating evidence suggests that the risk increases with increase in BMI throughout adulthood. Obese individuals have significantly more severe joint degeneration in the knees when compared to individuals with normal weight. Data from a case–control study indicated a strong association between increase in BMI and surgical replacement of hip and knee joints.23 In addition, obesity in particular central obesity have been constantly associated with hypertension and increased risk of cardiovascular diseases.
Similarly Mahamood Ali et al.,24 also reported that being obese was strongly associated with the risk of hypertension in school teachers. However the results showed that male teachers were found to be at a greater risk that female teachers. Based on population studies, it is estimated that at least two-thirds of the prevalence of hypertension is directly attributed to obesity.25 Apart from hypertension, abdominal adiposity has also been implicated in the pathogenesis of coronary artery disease, sleep apnea, stroke and congestive heart failure, dyslipidemia and type 2 diabetes.26,27 On the other hand, effective lifestyle interventions are effective in bringing about weight and decrease the risk of developing chronic illnesses.28
Conclusion
The prevalence rate of obesity was high among the teachers thereby indicating an urgent need for health and nutrition education programs that focuses on various aspects of leading a healthy life. These activities could be incorporated in schools and schools can be used as a place for promoting health education in such a way that it helps to drastically reduce the risk of chronic diseases and its co-morbidities in this population.
Acknowledgements
The authors wish to acknowledge all the school principals and teachers who gave their consent to be a part of this study.
Funding source: Nil
References
- World Health Organization (WHO). Obesity: preventing and managing the global epidemic. Report of a WHO consultation. World Health Organ Tech Rep Ser. 2000;894:1-253.
- World Health Organization (WHO). World Health Statistics 2012. Geneva: WHO; 2012. http://www.who.int/gho/publications/world_health_statistics/EN_WHS2012_
- International Institute for Population Sciences. National Family Health Survey (NFHS-3), 2005-06: India. V. I.Mumbai: International Institute for Population Sciences. 2007.
- Gothankar JS. Prevalence of obesity and its associated co morbidities amongst adults. National Journal of Community Medicine. 2011;2:211–4.
- Singh M, Sing G. Assessment of mental health status of middle aged female school teachers of Varanasi city. International Journal of Health. 2006;5(1):6-18
- Grew A, Gad Z, Mandil A, Wagdi M, Elneihoum A. Risk factors for Cardio Vascular Diseases among school teachers in Benghazi, Libya. Ibnosina Journal of Medicine and Biomedical Sciences. 2010;2(4):168-177.
- Harrison G.G, Buskirk E.R, Lindsay Carter E.R, Johnston F.E, Lohman T.G, Pollock ML, et al. skinfold thickness and measurement technique. In: Lohman TG, Roche AF, Martorell R, editors. Anthropometric standardization reference manual. Champaign, IL: Human Kinetics Books. 1988.p.55-70.
- Misra A, Vikram N.K, Gupta R, Pandey R.M, Wasir J.S, Gupta VP. Waist circumference cutoff points and action levels for Asian Indians for identification of abdominal obesity. International Journal of Obesity. 2006;30:106–111.
CrossRef - WHO/IASO/IOTF: The Asia Pacific Perspective: Redefining Obesity and its Treatment. 2000 Health Communication Australia Pty, Ltd.
- Chobanian A.V, Bakris G.L, Black H.R, Cushman W.C, Green L.A, Izzo J.L Jr, et al. The seventh report of the Joint National Committee on Prevention, Detection, Evaluation, and Treatment of High Blood Pressure: the JNC 7 report. Journal of American Medical Association. 2003;289:2560-2572.
CrossRef - Shukla R (2010) NSHIE 2004-2005 Data National Council of Applied Economic Research. How India spends and saves. Unmasking the real India sage New Delhi.
- Rocha S.V, Cardoso J.P, Alves C, Munaro H.L.R, Vasconcelos L.R.C, Petroski EL. Overweight/obesity in teachers: prevalence and associated factors.Brazilian Journal of Kinanthropometry and Human Performance. 2015;17(4):450-459.
CrossRef - Misra A, Singhal N, Khurana L. Obesity, the metabolic syndrome and type 2 diabetes in developing countries: role of dietary fats and oils. Journal of American College Nutrition. 2010;29(3):289-301.
CrossRef - Wilson P.W.F, D’Agostino R.B, Sullivan L, Parise H, Kannel WB. Overweight and obesity as determinants of cardiovascular risk: The Framingham Experience. Archives of Internal Medicine. 2002;162(16):1867–1872.
CrossRef - Wannamethee S.G, Shaper A.G, Walker M. Overweight and obesity and weight change in middle aged men: Impact on cardiovascular disease and diabetes. Journal of Epidemiology and Community Health. 2005;59(2):134–139.
CrossRef - Mozaffarian D, Hao T, Rimm EB, Willett WC, Hu FB. Changes in diet and lifestyle and long-term weight gain in women and men. New England Journal of Medicine;364:2392-2404: (2011).
CrossRef - Azizi F, Esmaillzadeh A, Mirmiran P, Ainy E. Is there an independentassociation between waist-to-hip ratio and cardiovascular riskfactors in overweight and obese women? International Journal ofCardiology. 2005;11:101:39-46.
- Kelishadi R, Alikhani S, Delavari AR, Alaedini F, Safaie A, HojatzadehE. Obesity and associated lifestyle behaviors in Iran:findings from the First National Non communicable Disease RiskFactor Surveillance Survey. Public Health Nutrition. 2008;11:246-51.
CrossRef - Abtahi F, Naghshzan A, Zibaeenezhad M.J, Heydari S.T, Khosropanah S, Zamirian M. et al.The Relationship between Body Mass Index and Pre-Diabetes In Teachers Residing in Shiraz-Iran 2009. Iranian Cardiovascular Research Journal. 2010;4(3):112-117.
- Sharkey B, Gaskill S. Fitness and Health, Human Kinetics Publishers. 2006.
- Healy G.N, Dunstan D.W, Salmon J, Shaw J.E, Zimmet P.Z, Owen N. Television time and continuous metabolic risk in physically active adults.Medicine and Sciencein Sports and Exercise. 2008;40(4):639–45.
CrossRef - Lementowski PW, Zelicof SB. Obesity and osteoarthritis. American Journal of Orthopedics. 2008;37:148–151.
- Wills AK, Black S, Cooper R. Life course body mass index and risk of knee osteoarthritis at the age of 53 years: evidence from the 1946 British birth cohort study. Annals of Rheumatic Diseases. 2012;71:655–660.
CrossRef - Mahamood A, Vijayakumar S, Pasula S, Adepu1K, and Laxmi ANR. Relationship Between Waist Circumference and Body Mass Index of Hypertensionin Teaching Staff of Government and Private Schools of Warangal,Andhra Pradesh, India. International Journal of Pharmaceutical Sciences Letters. 2013;3(3):218-222.
- Krause R.M, Winston M, Fletcher B.J, Grundy SM. Obesity. Impact on cardiovascular diseases. Circulation. 1998;98:1472-1476.
CrossRef - Arterburn D.E, Maciejewski M.L, Tsevat J. Impact of morbid obesity on medical expenditure in adults. International Journal of Obesity. 2005;29(3):334-9.
CrossRef - Houston D.K, Nicklas B.J, Zizza CA. Weighty concerns: The growing prevalence of obesity among older adults. Journal of American Dietetics Association. 2009;109:1886-1895.
CrossRef - Villareal D.T, Miller B.V, Banks M, Fontana L, Sinacore DR, Klein S. Effect of lifestyle intervention on metabolic coronary heart disease risk factors in obese older adults. American Journal of Clinical Nutrition. 2006;84(6):1317–1323.
CrossRef
Accepted on: 24-05-2018
Second Review by: Dr. Nur Islami bt Mohd Fahmi Teng (Malaysia)
Final Approval by: Prof. Yuan Soon


Web of Science Coverage
Emerging Sources Citation Index (ESCI)
2024 Journal Impact Factor: 1.1
Scopus Journal Metrics
CiteScore 2025: 2.6
CiteScore Details
Sustainable Nutrition: Food Systems, Nutrient Retention, and Public Health Impact
![]()
This journal is a member of, and subscribes to the principles of, the Committee on Publication Ethics (COPE)


