
Prevalence and Associated Factors of Metabolic Syndrome among University Staff in Ho Chi Minh City, Vietnam: A Cross-Sectional Study
 , Tran Thi Minh Nguyet2, Le Thi Thuy Dung3and Pham Van Doanh1*
1Faculty of Chemistry and Life Sciences, Ho Chi Minh City University of Technology and Engineering, Ho Chi Minh City, Viet Nam
2Department of Children's Nutrition Examination and Counselling, National Institute of Nutrition, Ha Noi, Viet Nam
3Institute of Medical and Pharmaceutical Education, Thu Dau Mot University, Ho Chi Minh City, Viet Nam
Corresponding Author Email: doanhpv@hcmute.edu.vn
Download this article as:
ABSTRACT:Metabolic syndrome (MetS) is increasingly relevant in working-age adults, yet data from university employees in Vietnam remain limited. This cross-sectional study examined the prevalence of MetS and related factors among 401 participating staff from a simple random sample at a single urban university in Ho Chi Minh City. Data on sociodemographic characteristics, anthropometry, biochemical indicators, physical activity, and dietary behaviors were obtained through structured interviews, routine health records, and clinical assessment. Participants were classified as having MetS using the NCEP ATP III criteria with Asian-specific modifications. Overall, 15.0% of participants had MetS, and it was more common in men than women (19.6% vs. 9.6%; p<0.01). After adjustment, BMI ≥25 kg/m² and current smoking retained their associations with MetS (aOR = 7.36; 95% CI: 3.72–14.57 and aOR = 2.77; 95% CI: 1.08–7.10, respectively). The AUC of the final model was 0.789. MetS affected a moderate proportion of university staff, with a clearer burden among men. These findings point to the value of workplace health programs that combine weight control, smoking cessation, physical activity, and stress management in similar university settings.
KEYWORDS:Associated factors; Metabolic syndrome; Obesity; Smoking; University staff; Vietnam
Introduction
MetS refers to a cluster of related cardiometabolic abnormalities, including central obesity, hyperglycaemia, hypertension, elevated triglycerides, and reduced HDL-C.1,2 Because these abnormalities often occur together and are linked to later cardiometabolic complications, MetS has become an important public health issue worldwide. People with MetS have a higher risk of atherosclerotic outcomes, including ischaemic heart disease, acute coronary events, and cerebrovascular disease. Beyond cardiovascular outcomes, MetS also extends beyond cardiovascular risk. It is commonly linked with gout, kidney dysfunction, fatty liver disease not attributable to alcohol use, as well as several conditions linked to excess adiposity that may affect quality of life and long-term survival.3,4
MetS develops through complex crosstalk between inherited susceptibility, lifestyle behaviours, and environmental exposures. Excessive caloric intake, visceral adiposity, insulin resistance, and lipid dysregulation are all caused by unhealthy eating habits, especially the regular use of highly processed foods and sugar-sweetened beverages.5 Simultaneously, inflammatory, vascular, and metabolic regulation may be exacerbated by smoking, alcohol use, sleep deprivation, long-term psychological stress, physical inactivity, and disruption of the circadian rhythm.6,7 These risk factors frequently coexist and work in concert to hasten the development of metabolic disorders. Furthermore, age, sex, and genetic predisposition continue to be significant non-modifiable factors affecting MetS vulnerability.5,8,9
MetS has increased markedly worldwide since 2000. In a systematic analysis including 3,236 datasets and more than 45 million individuals, the corresponding estimates were 31.0% in women and 25.7% in men in 2023, compared with 14.7% and 9.0%, respectively, in 2000.10 NHANES 2011–2018 data from the United States showed a high and increasing MetS prevalence, rising from 37.6% in 2011–2012 to 41.8% in 2017–2018.11 Similar upward trends have been reported in many Asian countries, where rapid urbanization, dietary transition, and lifestyle changes are reshaping cardiometabolic risk profiles.12,13 A previous study among staff at a Malaysian public university reported a MetS prevalence of 20.6%, highlighting the cardiometabolic burden in university employees.12
In Vietnam, alongside economic growth and nutritional and behavioral changes, MetS has become a more significant health issue. The frequency of MetS varies significantly among various people and environments, according to earlier research. Nearly one-third of persons had MetS, with prevalence rising sharply with age, according to a community-based study carried out in nine provinces in 2020.14,15 Dyslipidemia was the most prevalent metabolic abnormality, with a prevalence of 36.2%, according to another study conducted in Ho Chi Minh City.16 Despite these results, there is still a dearth of information on MetS in particular occupational categories, especially university employees.
University staff may represent a population at elevated risk for metabolic disorders due to the nature of academic and administrative labor with prolonged sedentary behavior, high psychological workload, inconsistent working schedules, and minimal physical exercise. These occupational exposures may increase the risk of developing MetS by interacting with urban lifestyle variables, such as poor eating habits and long-term stress.17,18 Although Ho Chi Minh City concentrates many of Vietnam’s higher-education institutions as its busiest metropolis, few studies have examined the metabolic health of university employees there.
This study therefore sought to quantify MetS and characterise its associations with selected sociodemographic, anthropometric, and lifestyle factors, including adiposity, smoking, and physical activity, among staff working at an urban university in Ho Chi Minh City, Vietnam. It is anticipated that the results would support the creation of focused occupational health promotion and non-communicable disease prevention programs in educational environments.
Materials and Methods
Study design and setting
This study used a cross-sectional design and combined both primary and secondary data. Secondary data was taken from university academic and administrative staff members’ regular yearly health assessment records in November 2024. Primary data were obtained through interviewer-administered structured questionnaires. The questionnaire, which included data on personal traits, lifestyle choices, food habits, and physical activity, was modified from earlier research that evaluated behavioral risk factors and drivers of hypertension in adults.12,17,18,23 Data collection ran from March to May 2025 in a Ho Chi Minh City university, Vietnam.
Study population and sampling
The source population included all full-time staff members currently employed at the university, including academic, administrative, technical, and support staff who had formal employment contracts and participated in routine health check-ups (838 people). Participants qualified if they were aged ≥18 years, had a minimum tenure of six months at the university, and signed an informed-consent form. Exclusion criteria comprised incomplete anthropometric or biochemical records, pregnancy, acute serious illness during the survey period, or prolonged medical leave.
Sample size was calculated for estimating one population proportion as follows:
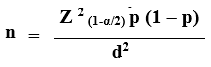
A 95% confidence level was applied, corresponding to Z=1.96, an expected MetS prevalence of 36.2% based on a previous estimate from Ho Chi Minh City,16 and precision d = 0.05, the calculation returned a minimum of 355 individuals. Allowing for an expected 15% non-response, the target was raised to 408 and rounded up to a target of 401 participants. A simple random sampling method without replacement was used to select participants. From a complete sampling frame of 838 eligible employees, 410 individuals were randomly selected using the RAND() function in Microsoft Excel. Of these, 401 participated and provided sufficient data for inclusion in the final analysis, representing a response rate of 97.8%.
Data collection process
Trained research assistants carried out data collection using clinical measurements and a structured questionnaire. Before fieldwork, the questionnaire was tested on a small group to check clarity, wording, interview flow, and the time required for completion. The final questionnaire was then used for the main survey.
Sociodemographic characteristics
General information, including age, sex, and occupation, was collected through structured interviews. Smoking status was coded as a binary variable and classified into two categories: smoker and non-smoker. The frequency of self-reported stress was assessed by asking participants how often they felt stressed at work or in their daily lives. For analysis, responses were categorized as “at least monthly” (1–2 times/month or 1–2 times/week) and “less than monthly” (never or 1–2 times/year). Family history of metabolic disorders was assessed by asking whether any first-degree relatives (father, mother, or sibling) had any of the metabolic disorders listed in the questionnaire, including hypertensive, obesity, type 2 diabetes, or dyslipidemia. A positive family history was defined as the presence of at least one of these conditions in at least one first-degree relative.
Body weight and anthropometric measurements
The anthropometric component covered height, body weight, BMI, and waist circumference. With participants barefoot and wearing light clothing, height was measured to 0.1 cm, while body weight was measured to 0.1 kg on a calibrated electronic scale. BMI was derived from body weight and height and expressed as kg/m². BMI categories were underweight below 18.5 kg/m², normal from 18.5 to 24.9 kg/m², overweight from 25.0 to 29.9 kg/m², and obesity ≥30.0 kg/m².19 For the main analysis, participants with BMI ≥25 kg/m² were grouped as having overweight/obesity.
Waist circumference was measured independently to 0.1 cm. An inelastic tape was positioned halfway between the lower costal margin and iliac crest along the mid-axillary line. Central obesity was identified using sex-specific WC (waist circumference) cut-offs of ≥90 cm for men and ≥80 cm for women.
Blood pressure and biochemical assessment
Blood pressure measurements and biochemical analyses of the participants were conducted by medical professionals at healthcare facilities certified in accordance with the operational and laboratory standards of the Vietnamese Ministry of Health.
Before measurement, participants rested quietly for 5–10 minutes in a calm setting. They were advised to avoid stimulants such as coffee, tobacco, and alcohol for at least 2 hours before measurement. Participants were also instructed not to speak during the procedure. Blood pressure was recorded on two or more occasions separated by 1–2 minutes. A third measurement was taken after a rest interval of at least five minutes when the difference between the first two readings exceeded 10 mmHg. Final systolic and diastolic blood pressure values were derived from the last two measurements and reported in mmHg.
Morning venous samples (3–5 mL) were obtained after a minimum 8-hour overnight fast for biochemical analysis. Participants were instructed not to use medications that could affect blood glucose or lipid levels before sampling. The biochemical panel comprised fasting glucose, total cholesterol, HDL-C, LDL-C, and triglycerides. These tests were analysed in an accredited laboratory with standard enzymatic assay procedures.
Lifestyle and dietary assessment
Physical activity
Physical activity was grouped as light, moderate, or vigorous according to self-reported usual activity patterns, using examples adapted from WHO physical activity recommendations.20 Light physical activity included low-intensity activities, such as household chores without participation in sports. Moderate physical activity (e.g., walking, yoga, or gentle exercise) refers to moderate exertion and a noticeable increase in heart rate. Vigorous physical activity included activities requiring substantial physical effort (e.g., running, fast cycling, swimming, badminton, table tennis, football, tennis, and pickleball), causing rapid breathing and an increase in heart rate.
Dietary behaviors
Alcohol consumption was categorized as moderate drinking if alcohol was consumed occasionally (1–3 times/month), and frequent alcohol consumption if alcohol consumption occurred frequently (≥4 times/month).21
Salt intake behavior was classified into three categories: high salt intake (frequently or always adding salt, fish sauce, or soy sauce to food during meals); normal salt intake (occasionally adding salt or salty condiments to meals); and low salt intake/bland diet (rarely or never adding salt, fish sauce, or soy sauce during meals and usually consuming food as prepared).
MetS diagnostic definition
The diagnosis of MetS followed the NCEP ATP III criteria for Asian populations, with IDF cut-offs used for waist circumference.22 In this study, MetS was diagnosed if a participant met at least three among the five diagnostic criteria. These components were: glucose measured after an overnight fast ≥100 mg/dL (5.6 mmol/L) or a prior diagnosis of diabetes; blood pressure at ≥130/85 mmHg or antihypertensive drug use; HDL-C below 1.04 mmol/L in men or below 1.29 mmol/L in women; triglyceride level ≥1.7 mmol/L; and abdominal obesity, based on waist circumference ≥90 cm in men and ≥80 cm in women.
Statistical analysis
Data entry and statistical analyses were conducted with SPSS 26.0 (IBM Corp., Armonk, NY, USA) and JASP version 0.16.0.0 (JASP Team, 2022). Normality was assessed with the Shapiro–Wilk test. Non-normally distributed continuous variables, including BMI, WC, glucose, systolic blood pressure (SBP), diastolic blood pressure (DBP), triglycerides, and HDL-C, were summarized as median (P25–P75) and compared by the Mann–Whitney U test. Normal variables were expressed as mean ± SD and compared by the independent-samples t-test. Categorical data were examined with the chi-square test. Variables meeting p<0.20 in bivariate analysis were retained for the multivariable logistic regression model. Adjusted odds ratios (aORs) and 95% confidence intervals (CIs) were reported for adjusted associations. Final-model discrimination was evaluated by ROC curve analysis. A two-sided p-value <0.05 was considered statistically significant.
Results
Table 1: Metabolic syndrome prevalence and the sex-specific distribution of individual metabolic abnormalities (n = 401).
|
Components |
Total
(n=401) |
Male
(n = 214) |
Female
(n = 187) |
p-value |
|
Metabolic risk factors |
||||
| Raised blood pressure or hypertension | 157 (39.2%) | 117 (54.7%) | 40 (21.4%) |
<0.001 |
|
Abdominal obesity |
120 (29.9%) | 89 (41.6%) | 31 (16.6%) | <0.001 |
| Raised triglycerides | 118 (29.4%) | 60 (28.0%) | 58 (31.0%) |
0.514 |
|
Low HDL-C |
107 (26.7%) | 36 (16.8%) | 71 (38.0%) | <0.001 |
| Impaired fasting glucose | 65 (16.2%) | 38 (17.8%) | 27 (14.4%) |
0.368 |
|
Metabolic syndrome (≥3 components) |
60 (15.0%) | 42 (19.6%) | 18 (9.6%) | 0.005 |
| Number of risk factors |
|
|||
|
0 risk factor |
88 (21.9%) | 42 (19.6%) | 46 (24.6%) | 0.001 |
| 1 risk factor | 141 (35.2%) | 57 (26.6%) |
84 (44.9%) |
|
|
2 risk factors |
112 (27.9%) | 73 (34.1%) | 39 (20.9%) | |
| 3 risk factors | 40 (10.0%) | 31 (14.5%) |
9 (4.8%) |
|
|
4 risk factors |
18 (4.5%) | 11 (5.1%) | 7 (3.7%) | |
| 5 risk factors | 2 (0.5%) | 0 (0%) |
2 (1.1%) |
Values are n (%). P-values were calculated using chi-square tests. MetS, metabolic syndrome.
MetS was identified in 15.0% of the study participants. MetS was more common in men than in women (19.6% vs. 9.6%; p=0.005). Among the five MetS components, raised blood pressure or hypertension accounted for the largest proportion (39.2%), then abdominal obesity (29.9%), hypertriglyceridemia (29.4%), and reduced HDL-C (26.7%). Sexual differences were evident in the distribution of these components, men showed markedly greater rates of central obesity and hypertension (p < 0.001); by contrast, reduced HDL-C was significantly more common among women (38.0% vs. 16.8%; p < 0.001).
Regarding the clustering of metabolic risk factors, 21.9% of participants presented no metabolic abnormalities. One risk factor and two risk factors were observed in 35.2% and 27.9% of participants, respectively. Overall, 15.0% had three or more abnormalities and therefore met the criteria for MetS. A greater accumulation of risk factors with two or more metabolic abnormalities, was more pronounced in men compared to women.
Table 2: Comparison of metabolic indicators by age group (n=401).
|
Variables Median (25th–75th percentile) |
Male staff | p-value1 | Female staff (n = 187) | p-value2 | p-value3 | ||||
| ≤ 40 years
(n = 78) |
> 40 years
(n = 136) |
Total
(n = 214) |
≤ 40 years
(n = 91) |
> 40 years
(n = 96) |
Total (n = 187) |
||||
|
BMI (kg/m²) |
24.6
(23.1 – 27.1) |
24.2
(22.5 – 26.7) |
24.4
(22.7 – 26.8) |
0.525 | 21.2
(19.8 – 23.5) |
22.8
(21.0 – 24.3) |
21.9
(20.4 – 23.8) |
0.008 |
<0.001 |
|
WC (cm) |
86.0
(78.3 – 92.0) |
86.0
(76.5 – 92.0) |
86.0
(77.5 – 92.0) |
0.910 | 72.0
(70.0 – 78.0) |
74.0
(69.3 – 79.0) |
74.0
(70.0 – 78.0) |
0.342 |
<0.001 |
|
Glucose (mmol/L) |
5.0
(4.7 – 5.4) |
5.0
(4.7 – 5.4) |
5.0
(4.7 – 5.3) |
0.902 | 5.0
(4.7 – 5.3) |
5.0
(4.7 – 5.4) |
5.0
(4.7 – 5.4) |
0.587 | 0.861 |
| SBP (mmHg) | 130.0
(110.0 – 138.5) |
130.0
(110.0 – 130.0) |
130.0
(110.0 – 130.3) |
0.512 | 120.0
(110.0 – 120.0) |
120.0
(110.0 – 130.0) |
120.0
(110.0 – 120.0) |
0.023 |
<0.001 |
|
DBP (mmHg) |
80.0
(70.0 – 85.5) |
70.0
(70.0 – 83.0) |
77.5
(70.0-84.3) |
0.298 | 70.0
(70.0 – 80.0) |
70.0
(70.0 – 80.0) |
70.0
(70.0 – 80.0) |
0.713 | 0.004 |
| Triglycerides (mmol/L) | 1.3
(0.7 – 1.8) |
1.0
(0.7 – 1.8) |
1.1
(0.7 – 1.8) |
0.684 | 0.9 (0.3 – 1.6) | 1.0
(0.7 – 1.8) |
1.0
(0.6 – 1.8) |
0.612 |
0.535 |
|
HDL-C (mmol/L) |
1.2
(1.1 – 1.6) |
1.5
(1.2 – 1.7) |
1.4
(1.1 – 1.6) |
0.005 | 1.3
(0.5 – 1.6) |
1.4
(1.1 – 1.6) |
1.4
(1.0 – 1.6) |
0.840 |
0.526 |
Values are expressed as median with P25–P75. Between-group comparisons used the Mann–Whitney U test. p-value¹ refers to age-group comparisons among men; p-value² denotes comparisons by age group in women; and p-value³ refers to sex-based comparisons in the total sample.
Table 2 summarizes metabolic indicators by age group and sex. In male staff, HDL-C was the only metabolic indicator that differed significantly by age group (p=0.005). Among men, the remaining metabolic indicators did not differ significantly between age groups. Female participants older than 40 years had higher BMI and SBP than aged ≤40 years (p=0.008 and p=0.023, respectively), whereas the remaining indicators were not significantly different by age group.
Regarding gender-based comparisons, substantial disparities were identified across several metabolic parameters. Male participants demonstrated significantly higher median values for BMI, WC, SBP, and DBP compared to their female counterparts (all p < 0.001), indicating a more adverse metabolic profile among men in this study population.
Table 3: Unadjusted associations between participant characteristics and metabolic syndrome
|
Variable |
MetS
n (%) |
No MetS
n (%) |
Unadjusted OR (95% CI) |
p-value |
|
Sex |
||||
| Female | 18 (9.6%) | 169 (90.4%) |
1 (ref) |
|
|
Male |
42 (19.6%) | 172 (80.4%) | 2.27 (1.27 – 4.17) | 0.005 |
|
Age group (years) |
||||
|
Age ≤ 40 years |
19 (11.2%) | 150 (88.8%) | 1 (ref) | |
| Age > 40 years | 41 (17.7%) | 191 (82.3%) | 1.70 (0.95 – 3.04) |
0.075 |
|
Occupational position |
||||
| Lecturer | 35 (14.1%) | 213 (85.9%) |
1 (ref) |
|
|
Administrative staff |
25 (16.3%) | 128 (83.7%) | 1.19 (0.68 – 2.08) |
0.544 |
|
Family history of metabolic disorders |
||||
|
No |
27 (13.7%) | 170 (86.3%) |
1 (ref) |
|
| Yes | 33 (16.2%) | 171 (83.8%) | 1.22 (0.70 – 2.11) |
0.488 |
|
BMI classification |
||||
| Normal/underweight | 18 (6.5%) | 259 (93.5%) |
1.00 (ref) |
|
|
Overweight/obesity (BMI ≥25 kg/m²) |
42 (33.9%) | 82 (66.1%) | 7.37 (4.02 – 13.50) |
<0.001 |
|
Sugar-sweetened beverages |
||||
| No | 41 (14.6%) | 239 (85.4%) | 1 (ref) |
|
|
Yes |
19 (15.7%) | 102 (84.3%) | 1.09 (0.60 – 1.96) |
0.785 |
|
Salt intake |
||||
| Rare | 10 (12.5%) | 70 (87.5%) | 1 (ref) |
|
|
Occasional |
28 (13.4%) | 181 (86.6%) | 1.18 (0.51 – 2.72) | 0.692 |
| Frequent | 22 (19.6%) | 90 (80.4%) | 1.71 (0.71 – 4.09) |
0.229 |
|
Fast food consumption |
||||
| Not daily | 45 (14.3%) | 270 (85.7%) | 1 (ref) |
|
|
Daily |
15 (17.4%) | 71 (82.6%) | 1.27 (0.67 – 2.38) |
0.467 |
|
Vegetable intake |
||||
| Daily | 34 (13.9%) | 210 (86.1%) |
1 (ref) |
|
|
Not daily |
26 (16.6%) | 131 (83.4%) | 1.22 (0.70 – 2.13) |
0.472 |
|
Sleep duration |
||||
| <8 hours | 51 (14.2%) | 309 (85.8%) |
1 (ref) |
|
|
≥8 hours |
9 (22.0%) | 32 (78.0%) | 1.70 (0.77 – 3.78) |
0.185 |
|
Self-reported stress frequency |
||||
| Less than monthly | 32 (13.8%) | 200 (86.2%) |
1 (ref) |
|
|
At least monthly |
28 (16.6%) | 141 (83.4%) | 1.24 (0.72 – 2.15) |
0.442 |
|
Physical activity |
||||
| Vigorous | 27 (12.3%) | 193 (87.7%) |
1 (ref) |
|
|
Moderate |
17 (15.0%) | 96 (85.0%) | 1.27 (0.66 – 2.44) | 0.480 |
| Low | 16 (23.5%) | 52 (76.5%) | 2.20 (1.10 – 4.39) |
0.025 |
|
Alcohol consumption |
||||
| No | 22 (13.3%) | 143 (86.7%) |
1 (ref) |
|
|
Sometimes |
16 (12.6%) | 111 (87.4%) | 0.94 (0.47 – 1.87) | 0.853 |
| Frequently | 22 (20.2%) | 87 (79.8%) | 1.64 (0.86 – 3.14) |
0.133 |
|
Smoking status |
||||
| Non-smoker | 49 (13.2%) | 323 (86.8%) |
1 (ref) |
|
|
Current smoker |
11 (37.9%) | 18 (62.1%) | 4.03 (1.80 – 9.04) |
<0.001 |
1: Reference group for univariate logistic regression analysis
In the unadjusted analysis, MetS occurred more often in men than in women, with higher crude odds among men (OR = 2.27; 95% CI: 1.27–4.17; p<0.05). BMI ≥25 kg/m² group had greater odds of MetS than the BMI <25 kg/m² group (OR = 7.37; 95% CI: 4.02–13.50; p<0.001). Low physical activity was also associated with MetS before adjustment (OR = 2.20; 95% CI: 1.10–4.39; p<0.05). Current smokers had higher crude odds of MetS than non-smokers (OR = 4.03; 95% CI: 1.80–9.04; p<0.05).
Table 4: Multivariable-adjusted factors associated with metabolic syndrome
|
Variables |
VIF | Adjusted OR | 95% CI | p-value |
| Male sex | 1.28 | 1.32 | 0.63 – 2.74 |
0.463 |
|
Age > 40 years |
1.02 | 1.72 | 0.90 – 3.27 | 0.100 |
| Overweight/obesity (BMI ≥25 kg/m²) | 1.21 | 7.36 | 3.72 – 14.57 |
<0.001 |
|
Moderate physical activity |
1.09 | 1.06 | 0.48 – 2.31 | 0.890 |
| Low physical activity | 1.09 | 1.12 | 0.55 – 2.33 |
0.742 |
|
Current smoker |
1.10 | 2.77 | 1.08 – 7.10 | 0.034 |
| Sleep duration ≥8 hours | 1.01 | 1.64 | 0.67 – 4.01 |
0.277 |
|
Occasional alcohol consumption |
1.24 | 0.84 | 0.38 – 1.86 | 0.660 |
| Frequent alcohol consumption | 1.24 | 1.71 | 0.75 – 3.89 |
0.201 |
Covariates in the adjusted model were sex, age, BMI, physical activity, smoking status, sleep duration, and alcohol use.
After adjustment, overweight/obesity showed the strongest association with MetS; staffs with BMI ≥25 kg/m² showed greater odds of MetS than the BMI <25 kg/m² (aOR = 7.36; 95% CI: 3.72–14.57; p<0.001). Current smoking also remained related to MetS (aOR = 2.77; 95% CI: 1.08–7.10; p=0.034). Other variables, including low physical activity, sleep duration ≥8 hours, and alcohol consumption, did not retain statistical significance in the adjusted model.
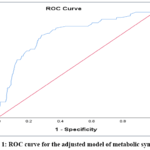 |
Figure 1: ROC curve for the adjusted model of metabolic syndrome |
The final model showed acceptable discrimination for MetS, with an AUC of 0.789 (95% CI: 0.727–0.852; p<0.001). This finding indicates that the variables included in the model had a reasonable ability to distinguish participants with MetS from those without MetS in this study sample.
Discussion
The current study identified 15.0% of university staff with MetS. This rate was modestly higher than the 12.5% reported among staff at Hanoi Medical University in 2014.23 However, differences in study populations and methodologies should be considered when interpreting these findings. This suggests that rapid urbanization and the increasingly digitized, sedentary nature of university work in Vietnam have outpaced the benefits of higher health literacy. Compared to contemporary Malaysian academic staff (20.6%),12 or broader Vietnamese community data (29.8%–36.2%) in 2020 – 2023,15,16 the lower prevalence compared with community-based Vietnamese studies may reflect differences in age structure, occupational characteristics, socioeconomic status, and access to routine health screening. However, the rate of university staff who manifested one or two metabolic abnormalities is alarming. This suggests a “silent” cardiovascular risk accumulation, where prolonged sedentary behaviours typical of modern academia are gradually eroding the protective effects of higher education and institutional stability.
In this study, men in our sample were affected by MetS more often than women (19.6% vs. 9.6%). This difference may partly reflect the less favourable metabolic profile among male staff, including higher BMI (24.4 vs. 21.9 kg/m²) and WC (86.0 vs. 74.0 cm), suggesting greater abdominal adiposity. Visceral fat differs metabolically from subcutaneous fat. When visceral fat is increased, free fatty acid delivery to the liver may rise, contributing to hepatic insulin resistance and an adverse lipid profile. This mechanism may partly explain why abdominal obesity and related metabolic abnormalities were more common among men in our sample. While female staff, primarily in their pre-menopausal years, benefit from the vasoprotective and lipolytic effects of estrogen,24 gender in this academic environment also serves as a proxy for the clustering of lifestyle hazards. Beyond biological factors, the Vietnamese working culture may also play a role. Male university staff are often more involved in professional networking and institutional hospitality, where alcohol use, and sometimes smoking, may be socially expected. At the same time, recent pressure on universities to improve research output, publications, grants, and institutional KPIs may increase sedentary working hours and work-related stress. Together, these factors may contribute to the higher systolic blood pressure observed in men (130 vs. 120 mmHg). However, these interpretations stay tentative, since we did not directly assess occupational exposures but the findings may suggest that workplace health programs in universities should consider gender-specific risks, especially weight control, smoking cessation, alcohol reduction, and opportunities for regular physical activity.
In analyzing the individual components of MetS, hypertension and hypertriglyceridemia emerged as the predominant clinical abnormalities within this cohort. Specifically, as shown in Table 1, the prevalence of elevated systolic blood pressure (39.2%) and hypertriglyceridemia (29.4%) significantly outweighed other components such as fasting glucose impairment (16.2%) or low HDL-C (26.7%). This specific clustering-characterized by a high hemodynamic and lipid burden, diverges from patterns in larger community surveys.25,26 where abdominal obesity and elevated glucose were more widespread. One possible explanation is the high cognitive and occupational demands associated with academic work, althought this interpretation requires further confirmation. Furthermore, the high prevalence of hypertriglyceridemia than that of impaired fasting glucose, suggests that metabolic dysfunction in university staff may be in its early, “pro-atherogenic” stage, primarily driven by dietary habits and sedentary lifestyle rather than advanced insulin resistance. Among participants with MetS, the three-component cluster was the most common pattern, accounting for 40 of 60 cases (66.7%). This indicates that most MetS cases were identified at the minimum diagnostic threshold rather than through clustering of four or five components.
BMI ≥ 25 kg/m² was the main factor associated with MetS in the adjusted model (aOR = 7.36; 95% CI: 3.72–14.57). Comparable associations have been reported in studies from Spain27 and Malaysia,12 suggesting that excess body weight remains an important marker of metabolic-risk clustering across different working populations. From a biological perspective, visceral adiposity may promote insulin resistance, endothelial dysfunction, and chronic inflammatory activity.28 Current smoking was also independently associated with MetS, with smokers having higher odds than non-smokers (aOR = 2.77; 95% CI: 1.08–7.10). This result aligns with findings in the broader Ho Chi Minh City population16 and international cohorts,6 reinforcing nicotine in perturbing lipid metabolism. However, the importance of this finding in an academic setting lies in the synergistic effect: smoking exacerbates oxidative stress and chronic inflammation, which potentially amplifies the damage already initiated by visceral obesity. As shown in our integrated model, smoking likely fuels metabolic dysfunction by disturbing lipid handling and promoting systemic inflammation. This explains why smoking remains a potent predictor even after adjusting for BMI, as it likely accelerates the transition from simple obesity to a complex MetS through the worsening of the pro-atherogenic profile.29,30
The ROC analysis showed acceptable discrimination for the final model, with an AUC of 0.789 (95% CI: 0.727–0.852). This result suggests that the variables retained in the model, particularly BMI and smoking status, may help distinguish staff with MetS from those without MetS in this study sample. However, the model should not be interpreted as a validated prediction tool because it was not tested in an external population. From a workplace health perspective, BMI assessment, smoking history, blood pressure measurement, and routine biochemical screening may provide practical starting points for identifying staff who require closer cardiometabolic follow-up.
Strengths, limitations and practical implications
This study has several strengths. It examined MetS among university staff, an occupational group for which evidence in Vietnam remains limited. The analysis combined questionnaire data with measured anthropometry, blood pressure, and biochemical indicators obtained from routine health examination records. This allowed MetS to be classified using standardized clinical criteria. The sample size was adequate for estimating MetS prevalence, and associated factors were assessed through adjusted logistic modelling with MetS after adjustment for selected covariates.
The findings need to be interpreted with several limitations in mind. First, data were collected from one university only, so the findings may not be generalizable to staff in other institutions, occupations, or regions. Second, the cross-sectional design does not allow causal interpretation. Furthermore, anthropometric and biochemical data were collected during routine health examinations conducted in November 2024, whereas lifestyle information was gathered several months later. Therefore, changes in smoking habits, physical activity, or dietary behaviuors during this interval cannot be excluded. Third, lifestyle variables, including smoking, stress, alcohol use, dietary behaviour, sleep, and physical activity, were self-reported and measured using broad categories and may therefore be subject to recall and reporting bias. Detailed information on smoking intensity, smoking duration, pack-years, dietary intake, sedentary time, and work-related stress was not available. Although the ROC analysis showed acceptable discrimination within this dataset, the model has not been externally validated.
Even with these limitations, the results remain useful for planning workplace health activities. Regular screening of adiposity, blood pressure, glycaemic status, and lipid status may support earlier recognition of metabolic abnormalities among university staff. Weight-control counselling and smoking cessation support should be considered as priority components of workplace health programs. In addition, strategies to reduce prolonged sitting, encourage physical activity, and improve dietary behaviours may contribute to better metabolic health in academic workplaces.
Conclusion
MetS was present in 15.0% of staff at an urban university in Ho Chi Minh City and was more common in men than in women. After adjustment, BMI ≥25 kg/m² and current smoking remained associated with MetS. These findings suggest that workplace-based screening may be valuable. Further longitudinal and multi-institutional studies are needed to clarify the roles of occupational stress, diet, physical activity, sedentary behaviour, and other lifestyle factors in the development of MetS.
Acknowledgement
The authors sincerely thank all staff members of Ho Chi Minh City University of Technology and Engineering who participated in this study. The authors also acknowledge the members of the research team and field collaborators for their valuable support in participant recruitment, data collection, anthropometric assessment, and data entry.
Funding Sources
The author(s) received no financial support for the research, authorship, and/or publication of this article.
Conflict of Interest
The author(s) do not have any conflict of interest.
Data Availability Statement
The datasets generated and analyzed during the current study are not publicly available due to privacy and ethical restrictions related to individual health information. De-identified data may be made available from the corresponding author upon reasonable request and subject to approval by the relevant institutional authority or ethics committee.
Ethics Statement
This study was approved by the Institutional Review Board of the Hanoi University of Public Health, Vietnam, on 31 March 2025 (Approval No. 025-074/DD-YTCC). All participants were fully informed about the study objectives, procedures, requirements, and their rights prior to participation. Participation was entirely voluntary. Participants had the right to refuse to participate or to withdraw from the study at any time without any consequences or impact on their rights or benefits.
Informed Consent Statement
Written informed consent was obtained from all participants before their enrollment in the study. Participants were fully informed about the purpose of the study, the blood collection procedure, and the confidentiality of their data.
Clinical Trial Registration
This research does not involve any clinical trials.
Permission to reproduce material from other sources
No materials (figures, tables, or text excerpts) from other sources were reproduced or adapted in this manuscript. All contents are the authors’ original work.
Author Contributions
- Nguyen Tan Dzung: Supervision, Methodology, Writing – Review & Editing.
- Tran Thi Minh Nguyet: Methodology, Formal Analysis, Writing – Review & Editing
- Le Thi Thuy Dung: Methodology, Data Interpretation, Writing – Review & Editing
- Pham Van Doanh: Conceptualization, Methodology, Data Collection Supervision, Formal Analysis, Writing – Original Draft, Data Interpretation.
References
- Özmen M, Yersal Ö, Öztürk S, Soysal D, Köseoğlu MH. Prevalence of the metabolic syndrome in rheumatoid arthritis. Eur J Rheumatol. 2014;1(1):1-4. doi:10.5152/eurjrheum.2014.001
CrossRef - Alberti KG, Zimmet P, Shaw J. The metabolic syndrome-a new worldwide definition. Lancet. 2005;366(9491):1059-1062. doi:10.1016/S0140-6736(05)67402-8
CrossRef - Alamnia TT, Sargent GM, Kelly MJ. Dietary patterns and associations with metabolic risk factors for non-communicable disease. Sci Rep. 2023;13(1):21028. doi:10.1038/s41598-023-47977-1
CrossRef - Galassi A, Reynolds K, He J. Metabolic syndrome and risk of cardiovascular disease: a meta-analysis. Am J Med. 2006;119(10):812-819. doi:10.1016/j.amjmed.2006.02.031
CrossRef - Patial R, Batta I, Thakur M, Sobti RC, Agrawal DK. Etiology, pathophysiology, and treatment strategies in the prevention and management of metabolic syndrome. Arch Intern Med Res. 2024;7(4):273-283. doi:10.26502/aimr.0184.
CrossRef - Kim SW, Kim HJ, Min K, et al. The relationship between smoking cigarettes and metabolic syndrome: a cross-sectional study with non-single residents of Seoul under 40 years old. PLoS One. 2021;16(8):e0256257. doi:10.1371/journal.pone.0256257.
CrossRef - Jia WP. The impact of cigarette smoking on metabolic syndrome. Biomed Environ Sci. 2013;26(12):947-952. doi:10.3967/bes2013.029
- Palmer AK, Jensen MD. Metabolic changes in aging humans: current evidence and therapeutic strategies. J Clin Invest. 2022;132(16):e158451. doi:10.1172/JCI158451
CrossRef - Amorim JA, Coppotelli G, Rolo AP, Palmeira CM, Ross JM, Sinclair DA. Mitochondrial and metabolic dysfunction in ageing and age-related diseases. Nat Rev Endocrinol. 2022;18(4):243-258. doi:10.1038/s41574-021-00626-7
CrossRef - Noubiap JJ, Nansseu JR, Nyaga UF, et al. Worldwide trends in metabolic syndrome from 2000 to 2023: a systematic review and modelling analysis. Nat Commun. 2026;17:573. doi:10.1038/s41467-025-67268-5.
CrossRef - Liang X, Or B, Tsoi MF, Cheung CL, Cheung BMY. Prevalence of metabolic syndrome in the United States National Health and Nutrition Examination Survey 2011-18. Postgrad Med J. 2023;99(1175):985-992. doi:10.1136/postgradmedj-2021-141333
CrossRef - Manaf MRA, Nawi AM, Tauhid NM, et al. Prevalence of metabolic syndrome and its associated risk factors among staff in a Malaysian public university. Sci Rep. 2021;11(1):8132. doi:10.1038/s41598-021-87248-1
CrossRef - Nsabimana P, Sombié OO, Pauwels NS, et al. Association between urbanization and metabolic syndrome in low- and middle-income countries: a systematic review and meta-analysis. Nutr Metab Cardiovasc Dis. 2024;34(2):235-250. doi:10.1016/j.numecd.2023.07.040
CrossRef - Dang AK, Le HT, Nguyen GT, et al. Prevalence of metabolic syndrome and its related factors among Vietnamese people: a systematic review and meta-analysis. Diabetes Metab Syndr. 2022;16(4):102477. doi:10.1016/j.dsx.2022.102477
CrossRef - Tran TN, Tran HD, Tran QN. The prevalence of metabolic syndrome among Vietnamese adults [in Vietnamese]. Vietnam J Diabetes Endocrinol. 2024;64:5-13. doi:10.47122/VJDE.2023.64.1
CrossRef - Pham NO, Phan TT, Van TM, Tran QC, Van TGH. Metabolic syndrome and associated factors among adults in Ho Chi Minh City in 2020 [in Vietnamese]. J Nutr Food. 2023;19(1+2):74-82. doi:10.56283/1859-0381/430
CrossRef - Ali N, Ahmed S, Mahmood S, Trisha AD, Mahmud F. The prevalence and factors associated with obesity and hypertension in university academic staff: a cross-sectional study in Bangladesh. Sci Rep. 2023;13(1):7309. doi:10.1038/s41598-023-34574-1
CrossRef - Alinaitwe B, Amanya C, Muwanguzi PA, Ngabirano TD. Prevalence of risk factors for hypertension among faculty at an urban university in Uganda. Integr Blood Press Control. 2024;17:1-11. doi:10.2147/IBPC.S440972
CrossRef - World Health Organization. Obesity: Preventing and Managing the Global Epidemic: Report of a WHO Consultation. Geneva, Switzerland: World Health Organization; 2000. WHO Technical Report Series 894. https://apps.who.int/iris/handle/10665/42330. Accessed April 25, 2026
- Bull FC, Al-Ansari SS, Biddle S, et al. World Health Organization 2020 guidelines on physical activity and sedentary behaviour. Br J Sports Med. 2020;54(24):1451-1462. doi:10.1136/bjsports-2020-102955
CrossRef - National Institute on Alcohol Abuse and Alcoholism. Understanding alcohol drinking patterns. National Institute on Alcohol Abuse and Alcoholism. https://www.niaaa.nih.gov/alcohols-effects-health/alcohol-drinking-patterns. Updated January 2026. Accessed April 25, 2026
- Alberti KG, Eckel RH, Grundy SM, et al. Harmonizing the metabolic syndrome: a joint interim statement of the International Diabetes Federation Task Force on Epidemiology and Prevention; National Heart, Lung, and Blood Institute; American Heart Association; World Heart Federation; International Atherosclerosis Society; and International Association for the Study of Obesity. Circulation. 2009;120(16):1640-1645. doi:10.1161/CIRCULATIONAHA.109.192644
CrossRef - Nguyen TN, Tran TPN. Situation of metabolic syndrome status and related factors among staffs of Hanoi Medical University [in Vietnamese]. J Nutr Food. 2017;13(2):12-18. https://tapchidinhduongthucpham.org.vn/index.php/jfns/article/view/454. Published May 3, 2017. Accessed July 24, 2026
- Neeland IJ, Lim S, Tchernof A, et al. Metabolic syndrome. Nat Rev Dis Primers. 2024;10(1):77. doi:10.1038/s41572-024-00563-5
CrossRef - Do HA, Pham TVA. Nutritional status and prevalence of metabolic syndrome among adults aged 25-64 years in Thai Binh province in 2019 [in Vietnamese]. Vietnam Med J. 2023;527(1):84-89. doi:10.51298/vmj.v527i1.5634
CrossRef - Nguyen TH, Bui TT, Ngo TTH. Metabolic syndrome among adults attending the National Institute of Nutrition in 2020 [in Vietnamese]. J Nutr Food. 2021;17(4):48-54. doi:10.56283/1859-0381/40
CrossRef - Ramon-Arbues E, Martinez-Abadia B, Gracia-Tabuenca T, et al. Prevalence of overweight/obesity and its association with diabetes, hypertension, dyslipidemia and metabolic syndrome: a cross-sectional study of a sample of workers in Aragon, Spain. Nutr Hosp. 2019;36(1):51-59. doi:10.20960/nh.1980
CrossRef - Li Y, Gui J, Liu H, et al. Predicting metabolic syndrome by obesity- and lipid-related indices in mid-aged and elderly Chinese: a population-based cross-sectional study. Front Endocrinol (Lausanne). 2023;14:1201132. doi:10.3389/fendo.2023.1201132
CrossRef - Behl TA, Stamford BA, Moffatt RJ. The effects of smoking on the diagnostic characteristics of metabolic syndrome: a review. Am J Lifestyle Med. 2023;17(3):397-412. doi:10.1177/15598276211029195
CrossRef - Li Z, Wang S, Chen Y, et al. Smoking affects the patterns of metabolic disorders and metabolic syndrome in patients with first-episode drug-naive schizophrenia: a large sample study based on the Chinese Han population. Int J Neuropsychopharmacol. 2021;24(10):798-807. doi:10.1093/ijnp/pyab038
CrossRef

Accepted on: 28 Oct 2026
Second Review by: Ahmad A Obeidat
Final Approval by: Dr. Neha Sanwalka Rungat





Web of Science Coverage
Emerging Sources Citation Index (ESCI)
2024 Journal Impact Factor: 1.1
Scopus Journal Metrics
CiteScore 2025: 2.6
CiteScore Details
Sustainable Nutrition: Food Systems, Nutrient Retention, and Public Health Impact

This journal is a member of, and subscribes to the principles of, the Committee on Publication Ethics (COPE)