
Valorization of Jameed into a Technofunctional Dairy Powder: Linking Structure, Rheology, and Antioxidant Functionality to Food Industry Applications
 , Saeid Moh'd Abu-Romman2, Maher Suleiman Obeidat3and Da'San Mahmoud Jaradat4
 1Department of Nutrition and Food Processing, Faculty of Agricultural Technology, Al-Balqa Applied University, Al-Salt, Jordan.
2Department of Biotechnology, Faculty of Agricultural Technology, Al-Balqa Applied University, Al-Salt, Jordan.
3Department of Medical Laboratory Analysis, Faculty of Science, Al-Balqa Applied University, Al‑Salt, Jordan.
4Department of Chemistry, Faculty of Science, Al-Balqa Applied University, Al‑Salt, Jordan.
Corresponding Author Email:haddad@bau.edu.jo
DOI : http://dx.doi.org/10.12944/CRNFSJ.14.2.21
Download this article as:

Jameed is a traditional dried, fermented dairy product widely consumed in Jordan and the Levant. This study evaluated jameed powder as a functional dairy ingredient by characterizing its physicochemical, structural, rheological, techno-functional, and antioxidant properties to support its use in food applications and to provide baseline data for parallel work on bioactive antimicrobial and antioxidant peptides.Two Jordanian samples were analyzed: MS (south) and MZ (north). MS had higher moisture and water activity than MZ (0.164 vs. 0.117). Protein was measured at 53–54%, fat composition at 9.0–9.5%, and mineral ash at 11–12%. The jameed samples showed a trend towards lighter color, as indicated by higher L* values for MS. The jameed dispersions, once reconstituted, showed flow behavior that was dependent on the formulation, and the power-law K values ranged from 0.0179 to 0.0252 kPa·sⁿ, showing no consistent relationship with the concentration. The FTIR spectra presented bands at 3269, 2927, 1625, and 1529 cm⁻¹, and were dominated by the lipid and protein functional groups. The results of the oscillatory rheology showed that the jameed formulation MZ had a greater elastic storage modulus (G′) than MS, and that in the main formulations G′ > G″, which showed predominantly elastic, weak gel behavior. The temperature sweep rheology of formulation MZ showed greater restructuring of the gel network due to increased thermal stimulus, indicating that MZ had greater responsiveness of the gel network to heating.When studied using the DPPH and ABTS methods, MZ showed greater radical scavenging activity than MS. These studies suggest that jameed powder is a very promising new dairy ingredient for use in the food system.
KEYWORDS:Antioxidant; Ethnic Product; Jameed; Jordan; Rheological Characterization; Water Activity (aW).
Introduction
“Jameed” comes from the Arabic word “jumad” which means “solid” or “frozen” because Jameed has a hard and dry texture.1 The production of jameed has managed to survive the passing of countless generations and is a reflection of the preservative strategies of communities in the desert on how to retain the important macro and micronutrients during their hostile environmental situations. The traditional way of manufacturing jameed is done by fermenting the milk into yogurt and then whey is partially removed, the solid curd is then shaped and dried into small and hard balls.2 This traditional way provides a source of proteins and micro nutrients and becomes important in environments where resources are scarce because it maintains stability and safety of the food over a long time.3 Jameed also has high functional value in health and nutrition.4 It has an abundance of proteins, calcium, fatty acids, and probiotic microorganisms.1 Also, because of its long shelf-life and nutritional value, jameed has the potential to be used in other areas aside from traditional ethnic foods to be included in the manufacturing of functional foods and other industrial dairy products.5 For the preparation of jameed, the buttermilk is also prepared by churning the mixture of fermented milk and yogurt, and then whey is removed by straining through cheese cloth.
Afterwards, the resultant coagulum is salted, formed into balls, and left to dry for a few weeks until a hardness is attained.6 Jameed has a characteristically salty and sour taste with an enduring aftertaste, and it is usually white or yellowish in color. Core drying is of utmost importance, and drying has to be complete, for the presence of moisture may lead to spoilage.1 Jameed may be rendered into several shapes and this may affect the moisture content of the product. Most of the time, it is shaped into spheroids, and made shelf-stable through a dual process of fermentation and drying.6 Its high shelf stability is mainly due to its low water activity and pH, high level of salt, and presence of lactic acid bacteria, which inhibit the growth of spoilage pathogenic microorganisms.7 Because of this, Jameed may be kept, for several years, at room temperature and without spoilage or a significant drop in the nutritional value.8 Additionally, the ability of jameed to be stored at ambient temperature enhances its suitability for distribution and consumption in remote areas and among nomadic communities.9Jameed can be considered stable at fundamental levels, but numerous processing and packaging techniques can be implemented to increase its shelf life. Packaging-based preservation strategies can help reduce microbial deterioration and maintain the quality of dairy products during storage. Vacuum and modified-atmosphere packaging improved the microbiological, chemical, and sensory stability of Domiati cheese,10 while carbon dioxide-containing atmospheres restricted the growth of spoilage microorganisms and Listeria monocytogenes in fresh cheese.11 Furthermore, combining modified-atmosphere packaging with a food-grade antimicrobial coating containing lysozyme and EDTA extended the shelf life of Fior di Latte cheese.12 The traditional stability of jameed is primarily associated with fermentation, salting, and drying, which reduce its moisture availability and permit storage before reconstitution. Accordingly, the present study focused on characterizing the physicochemical, structural, rheological, and antioxidant properties of milled jameed powder rather than evaluating postproduction packaging or storage interventions.
Accordingly, the present study was designed as a preliminary platform for the valorization of traditional dried jameed into a technofunctional dairy powder. The work focused on producing jameed powder through milling of already dried jameed and evaluating its key quality- and functionality-related attributes, including antioxidant activity, rheological behavior, instrumental color, structural characteristics, and techno-functional properties. By linking compositional and structural features with functional performance, this study provides a scientific basis for the potential incorporation of jameed powder as a functional dairy ingredient in food systems. Furthermore, The present findings provide relevant compositional and functional context for interpreting the antioxidant and antimicrobial properties of jameed-derived peptide fractions reported in the related study.
Materials and Methods
The jammed samples were collected from two geographical areas of Jordan, with one being from the southern area (MS) and the other from the northern area (MZ). Once the samples were collected, they were then delivered to the laboratory and kept under cold storage (6 ± 2 °C) until the time of analysis.
Preparation of jameed powder
Dried jameed samples were powdered prior to analysis using a stainless-steel laboratory mill. The jameed pieces were first manually broken into small fragments of approximately 0.5–1.0 cm using a clean stainless-steel cutter. The fragments were then milled using a laboratory hammer mill or cutting mill equipped with a stainless-steel sieve. Milling was performed intermittently to minimize heat generation and avoid changes in protein, fat, and volatile compounds.
The resulting powder was passed through a standard sieve, preferably 500 µm for general proximate, color, water activity, antioxidant, and functional analyses. For finer analytical purposes, the powder may be sieved through 250 µm. Any coarse particles retained on the sieve were re-milled and sieved again until a uniform powder was obtained. The powdered jameed was immediately packed in airtight polyethylene or laminated aluminum bags and stored at 4°C for short-term analysis or at −20°C for longer storage until further use.
Proximate analysis
Proximate analysis of the jameed samples was performed using standard procedures described in the AOAC International (22nd ed.).13 Moisture content was determined by oven-drying to constant weight, crude fat by solvent extraction, crude protein by nitrogen determination and conversion using an appropriate protein factor, and ash content by incineration in a muffle furnace. The results were expressed as percentages of sample weight to evaluate the basic chemical composition of the jameed samples.
Water activity
Water activity of the jameed powder was calculated using duplicate measurements at 25 °C with a Novasina AG (CH-8853 Lachen, Switzerland) water activity meter.
Instrumental color measurement
The colorimetric parameters of the jameed samples were expressed according to the CIELAB system, where L* (Lightness / brightness, The value ranges from 0 = black to 100 = white. Lower L* means a darker color. or brighter sample;a*red–green coordinate, positive a* = more red, negative a* = more green; b* yellow–blue coordinate, positive b* = more yellow, negative b* = more blue. The colorimetric parameters were assessed in triplicate with a HunterLab colorimeter (Flex EZ, Model No. 45/0).
FTIR analysis
Fourier transform infrared (FTIR) spectral analysis of the jameed sample was conducted using an FTIR spectrometer (model L1600300, PerkinElmer). Spectra were recorded over the wavenumber range of 400–4000 cm⁻¹, employing 32 scans at a resolution of 4 cm⁻¹ at 25 °C, following the methodology described by Widyasari and Rawdkuen.14
Rheological properties
Flow behavior
Jameed sample solutions at concentrations of 1–5% (w/v) were prepared by dispersing the required amount of powdered jameed in purified water using an analytical balance and a temperature-controlled magnetic hot-plate stirrer at 45 °C until complete hydration and homogenization. The rheological properties of the prepared solutions were evaluated at 25 °C using a controlled-stress rotational rheometer equipped with temperature control and suitable cone-and-plate or parallel-plate geometry. Dynamic oscillatory frequency-sweep measurements were performed within the linear viscoelastic region over an angular frequency range of 0.1–100 rad/s to determine the viscoelastic behavior of the samples, including storage modulus, loss modulus, and complex viscosity, following standard food rheology principles.15
Frequency sweep
The dynamic oscillatory rheological properties (the storage and loss moduli, G′ and G″ respectively) of jameed sample solutions were recordedusing a Physica MCR 101 rheometer (Anton Paar) with a cone-and-plate geometry according to the procedure described by Rather et al.16 Before the frequency sweep experiments, an amplitude sweep (0.1–20 %) was performed at an angular frequency of 1 rad/s to establish the linear viscoelastic region (LVR). Frequency sweep measurements were taken at 1% strain amplitude in the range of 0.1 to 100 rad/sec and at a fixed temperature of 25 °C.
Temperature sweep
The jameed samples were analyzed by temperature sweep tests from 10 °C to 80 °C with a heating rate of 0.5 °C/min, at an oscillatory frequency of 1 Hz and a strain amplitude of 5% following the method of Rather et al.17
Antioxidant properties
The antioxidant capacity of jameed samples was determined by 2,2′-azino-bis-3-ethylbenzothiazoline-6-sulfonic acid radical cation (ABTS⁺) and 2,2-diphenyl-1-picrylhydrazyl (DPPH) radical assays as follows:
ABTS radical-scavenging capacity
1.0 grams of Jameed powder was extracted with 10.0 mL of purified water in a 1:10 (w/v) concentration. The mixture was thoroughly dispersed, centrifuged (4000 rpm/30 min). The supernatant was collected and used for the ABTS assay.
To develop the ABTS radical cation (ABTS•⁺), an equal volume of a 7 mM ABTS solution and a 2.45 mM potassium persulfate (K₂S₂O₈) solution was mixed and allowed to stand in the dark at 25 ± 2 °C for 16 h. The ABTS•⁺ stock solution was diluted to an absorbance of 0.70 ± 0.02 at 734 nm by adding appropriate amount of ethanol.
For the present study, 100 μL Jameed extract was blended with 900 μL ABTS•⁺ working solution. The reaction mixture was placed in the dark at 25 ± 2°C for 6 minutes. The absorbance was measured at 734 nm using a UV–visible spectrophotometer. For the control, 100 μL of distilled water was used in place of Jameed extract along with 900 μL of the working solution of ABTS•⁺. For sample blank, 100 μL of Jameed extract was mixed with 900 μL of ethanol. An absence of ABTS•⁺ was used to compensate for the sample’s background absorbance. Sample absorbance was corrected with the following equation.

The antioxidant capacity of jameed powder was measured with reference to the Trolox calibrated curve. Results were converted into mg of Trolox equivalent per gram of jameed powder (mg TE/g) using the equation:

where CTE is the Trolox equivalent concentration from the calibration curve, measured in mg/mL, Vextract is the total extraction volume, measured in mL, 𝐷𝐹 is the dilution factor, and msample is the mass of the jameed powder, measured in grams. Measurements were done in triplicate. The assay is based on the ABTS radical-cation decolorization assay, with some modifications to accommodate aqueous jameed extracts. Bonilla and Sobral18 described the use of this method of assessing antioxidants in a different food matrix. Thus, describing this procedure as an adapted method is valid.
DPPH radical-scavenging activity
Jameed (1.00 g) was extracted by 10.0 mL of purified water on a sample-to solvent ratio of 1:10 (w/v). The mixture was disrupted by a Vortex- Genie 2 vortex mixer (Model G560E, Scientific Industries Inc., Bohemia, NY, USA), and the mixture was centrifuged (4000 rpm/30 min). The supernatant was collected for the analysis of antioxidants. A 60 μM DPPH working solution was prepared by dissolving the DPPH in ethanol. Jameed (1.5 mL) was incubated with 1.5 mL of the DPPH solution for one hour in the dark at 25 ± 2 °C. The absorbance was measured using a UV–visible spectrophotometer at a wavelength of 515 nm. The control and sample blank were prepared by the replacement of jameed extract with water and DPPH with ethanol respectively. The corrected sample absorbance was calculated as:

Antioxidant capacity was measured from the calibration curve prepared and analyzed under the same conditions and expressed as mg TE/g of jameed powder.

Where CTE is the Trolox-equivalent concentration from the calibration curve in mg/mL, Vextract is the total extract volume in mL, SF is the total dilution factor, and msample is the mass of jameed powder extracted in grams. The assay was adapted from Dzięcioł et al.,19 with some modifications to account for aqueous jameed extracts.
This version omits the percentage-scavenging equation since the results are reported as Trolox equivalents only. Retain this equation when percentage inhibition is reported in the Results.
Statistical analysis
All assays were run triplicate. A one-way analysis of variance (ANOVA) was performed using SPSS statistical software (version 16.0; SPSS Inc., Chicago, IL, USA) to analyze the data.
Results
Proximate Analysis
Moisture, Fat, Protein, and Ash content of MZ and MS jameed samples are shown in Table 1. MS jameed samples contained a significantly higher moisture content than MZ jameed samples. An increase in moisture content increases water activity of the sample and therefore, reduces the shelf-life and keeping quality of jameed.20 The protein content of the jameed samples was 53% to 54%. Compared to the MS sample, the MZ jameed sample had a higher protein content. The fat and ash contents of the MS and MZ jameed samples ranged from 9.0% to 9.5% and from 11% to 12%, respectively. The values showed significant differences between the two representative samples.
Table 1: Proximate composition, instrumental color analysis and water activity of jameed samples
|
Proximate composition |
Sample ID | |
| MZ |
MS |
|
|
Moisture (%) |
8.2±0.04B | 9.1±0.02A |
| Protein (%) | 54.0±0.05A |
53.0±0.04B |
|
Fat (%) |
9.0±0.04B | 9.5±0.02A |
| Ash (%) | 11.0±0.02B |
12.0±0.01A |
|
Instrumental color |
MZ | MS |
| L* | 86.06±0.02B |
88.84±0.04A |
|
a* |
0.89±0.02B | 0.97±0.01A |
| b* | 14.19±0.04A |
12.69±0.03B |
|
Water activity (aw) |
0.117±0.01B |
0.164±0.01A |
The data is shown as mean ± standard deviations (n=3). For every parameter, data superscripted with capital letters are significantly different (p<0.05)
Water activity
The water activity (aw) values of the MZ and MS samples are presented in Table 1. The aw of the MS samples (0.164)was higher than that of the MZ samples (0.117).
Instrumental color
Instrumental color analysis showed that MS jameed had a higher L* value (88.84) than MZ jameed (86.06), indicating a lighter and brighter appearance. The L* values obtained in the present study are consistent with the high-lightness range reported for dairy powders and light-colored cheeses. The a* parameter represents the green–red axis, where positive values indicate a shift toward redness. The MS sample showed a slightly higher a* value than the MZ sample, although both values remained close to neutrality, suggesting only a weak red tone. The MZ sample showed a higher b* value (14.19) than MS (12.69), indicating a more pronounced yellow tone. This may be associated with differences in milk composition, fat content, animal feeding system, carotenoid-related compounds, and/or thermal concentration during jameed processing.
FTIR Analysis
FTIR spectroscopy is a fundamental analytical tool that identifies the functional groups present in Jameed. The FTIR spectra of both the MZ and MS Jameed samples are shown in Figure 1. The spectra presented showcase the characteristic absorption bands corresponding to the predominant chemical components of Jameed—proteins, lipids, and carbohydrates. The main absorption peaks relative to the selected functional groups within the samples were found at 3269 cm⁻¹, 2927 cm⁻¹, 1625 cm⁻¹, and 1529 cm⁻¹.
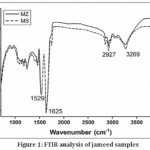 |
Figure 1: FTIR analysis of jameed samples |
Reheological Properties of Jameed
Flow behavior
Figure 2 depicts the steady-shear flow curves for the reconstituted jameed powder dispersions. The magnitude and characteristics of the shear-stress response were considerably influenced by the source and concentration of the jameed powder. Importantly, the curves did not show a systematic ordering that depended on concentration. Among the MZ dispersions, MZ10 exhibited the greatest resistance to flow. The shear stress of MZ10 dispersed rapidly to a maximum of approximately 56 Pa with a shear rate of approximately 5 s⁻¹ and then decreased to about 8 Pa at a shear rate of 100 s⁻¹. MZ4 exhibited the second greatest resistance to flow, with a shear stress of approximately 14–15 Pa, decreasing progressively with increasing shear rate for the remainder of the sweep. The dispersions of MZ2, MZ6, and MZ8 typically exhibited shear stress values of around 5 Pa or less.
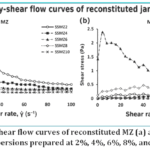 |
Figure 2: Steady-shear flow curves of reconstituted MZ (a) and MS (b) jameed powder dispersions prepared at 2%, 4%, 6%, 8%, and 10% (w/v). |
A different response to the injected starch powders was also observed for the MS dispersions. The MS6 sample reached the highest number, approximately 2.4 Pa at 5 s⁻¹, before decreasing to the range of 0.2–0.3 Pa at higher shear rates. The rest of the MS samples expressed significantly lower stress values, typically lower than 0.5 Pa, and exhibited minor variations over the entire tested shear rate range. Hence, Figure 2 does not illustrate a linear dependence of shear stress on increasing jameed powder concentration. The results indicate a flow response that is source and formulation specific, with MZ10 and MS6 dispersions exhibiting the most shear resistant flow structures of the dispersions studied.
The initial increase of shear stress and the subsequent decline are most pronounced for dispersions MZ10 and MS6. This is likely a result of the shear-induced disruption and rearrangement of the weaker, non-permanent, hydrated, protein-rich particle associations.
Power-law fitting resulted in coefficients of determination between 0.990 and 0.997 and, therefore, was kept as an empirical approximation of the flow response for the tested shear-rate range. The flow index, n, was approx. in the range of 0.061 to 0.064 for MZ dispersions, whereas in the case of MS dispersions, n was in the range of 0.057 to 0.574. For all the reported n values, MS dispersions exhibited shear thinning, but the extent of shear thinning was different for each MS dispersions. With respect to the power-law criterion, all n values reported for both MZ and MS dispersions were less than 1. Values of n near 0.06 exhibited strong shear-dependent behavior, whereas an n value of 0.574 was indicative of a relatively weak shear-thinning behavior that is still classified as non-Newtonian.
Frequency sweep
The reconstituted jameed powder dispersions’ frequency-dependent storage modulus (G’) and loss modulus (G″) are shown in Figure 3. The MZ samples generally exhibited a stronger viscoelastic response than the MS samples. MZ10 showed the highest moduli, with increasing from approximately 1200 to 2850 Pa and from approximately 300 to 800 Pa over the tested angular-frequency range. MZ4 exhibited the second-highest response, reaching approximately 1400 Pa for and 400 Pa for at 100 rad s⁻¹. In both formulations, remained substantially greater than , indicating an elastic-dominant, structured dispersion. The markedly lower moduli of MZ2, MZ6, and MZ8 indicated comparatively limited network development.
Among the MS dispersions, MS6 produced the strongest structure, with increasing to approximately 105 Pa and remaining higher than , which reached approximately 22 Pa. MS8 also showed elastic dominance but at lower modulus values. Conversely, MS4 and MS10 exhibited weak storage moduli and a pronounced increase in at higher frequencies, indicating that viscous energy dissipation became more influential under rapid oscillatory deformation.
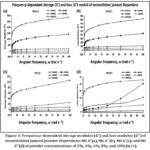 |
Figure 3: Frequency-dependent storage modulus () and loss modulus () of reconstituted jameed powder dispersions: MZ (a), MZ (b), MS (c), and MS (d) at powder concentrations of 2%, 4%, 6%, 8%, and 10% (w/v). |
Temperature sweep
The temperature sweep assessment was accomplished to evaluate the thermal stability and heat-induced structural changes of the reconstituted jameed powder dispersions (Figure 4). In oscillatory rheology, changes in the storage modulus (G′) and loss modulus (G″) reflect the response of the protein–fat–mineral matrix to heating. The storage modulus (G′) represents the elastic or recoverable component of the structure, whereas the loss modulus (G″) represents the viscous constituent related to energy dissipation. For the MZ samples, formulation MZ10 exhibited the most pronounced temperature-dependent rheological response. Both G′ and G″ decreased between 10 °C and approximately 50–60 °C, followed by a marked increase at higher temperatures.
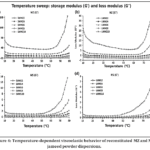 |
Figure 4: Temperature-dependent viscoelastic behavior of reconstituted MZ and MS jameed powder dispersions. |
The distinct increase in the modulus with temperature in the MZ6 sample was also noted. However, the response of MZ6 was lower than the response of MZ10. The response of the remaining samples, MZ2, MZ4, and MZ8, was even lower and was more or less stable with thermal induced structural change. The thermal response of the MZ samples depended on the organization of the microstructure and the concentration of the dispersed solids. The response of MZ10 is more favorable with the formation of heat induced networks in food systems. Across most of the temperature range, the MZ samples had higher values of G′ and G″ than the MS samples. Between 10 °C and approximately 50 °C, the MS samples were weakly structured and showed only small changes in the viscoelastic moduli. In the samples MS8 and MS10, in the range of 50 °C to 60 °C, the largest increase in G′ and G″ was again observed.
Antioxidant activity
The DPPH and ABTS antioxidant capacities of the MZ and MS jameed powders are presented in Figure 5. The MZ sample exhibited a significantly higher DPPH antioxidant capacity than the MS sample, with values of 20.13 and 18.27 mg TE/g, respectively (). Similarly, the ABTS antioxidant capacity was significantly higher in MZ than in MS, reaching 21.44 and 20.12 mg TE/g, respectively (). These differences are indicated by the different lowercase letters within each antioxidant assay in Figure 5.
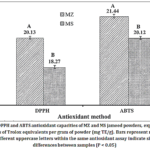 |
Figure 5: DPPH and ABTS antioxidant capacities of MZ and MS jameed powders, expressed as milligrams of Trolox equivalents per gram of powder (mg TE/g). |
Discussion
The significant differences in protein content in jameed samples could be a result of the differences in feeding patterns and the nutritional condition of the lactating animals.21 Comparable findings were reported by Al-Qudah YH, Tawalbeh22 in various jameed products manufactured from different types of milk. The values fat and ash are slightly lower than those documented by Al-Qudah and Tawalbeh,22 who reported a fat content of 18–33% in jameed produced from the milk of various dairy animal species. Comparable findings were reported by Tiwari et al.,23 in semi-soft milk cheese. Duarte et al.,24 documented a water activity of 0.90 in raw whey-based cheese samples. An increase in water activity is associated with reduced storage stability and a shorter shelf life of jameed.23 Elevated water activity in cheese promotes lipid oxidation and microbial spoilage, thereby decreasing the product’s shelf life.25
The difference in color may be related to variations in the manufacturing and drying conditions, particularly heating temperature and drying duration. Greater thermal exposure during jameed preparation can reduce lightness through moisture loss, concentration of solids, and possible non-enzymatic browning reactions, whereas milder or more uniform drying may help maintain a whiter appearance.Milovanovic et al.,26 reported L* values of 88.6 ± 10.1, 89.2 ± 6.0, and 87.9 ± 3.6 for cow, goat, and sheep milk powders, respectively. They also reported that goat cheese had high lightness values (L* = 87.1 ± 14.8), which supports the interpretation that the present jameed samples are highly light-colored dairy products. Carotenoids should not be described as being “included in the a* value”; rather, carotenoid-rich dairy matrices may contribute to yellow-orange color development, which can influence both positive b* and, to a lesser extent, positive a* values depending on pigment type and concentration. In contrast, the b* parameter represents the blue–yellow axis, and positive b* values indicate yellowness.Milovanovic et al.,26 reported b* values of 11.8 ± 6.1, 11.0 ± 2.8, and 8.8 ± 6.5 for cow, goat, and sheep milk powders, respectively, while cow cheese showed higher yellowness (b* = 17.4 ± 10.0). These values indicate that the yellowness observed in the present jameed samples falls within the general range reported for dairy powders and some cheeses. Moreover, milk carotenoid content is affected by feeding conditions, especially the availability of fresh forage; Kelava Ugarković et al.,27 reported β-carotene, lutein, zeaxanthin, and retinol concentrations in Jersey milk of 4.15 ± 0.27, 4.43 ± 0.40, 0.97 ± 0.04, and 2.56 ± 0.29 µg/100 mL, respectively, and found positive correlations between b* values and both β-carotene and lutein concentrations. Therefore, the higher b* value in MZ may reflect differences in the raw milk matrix and/or processing conditions rather than a single factor alone.
Similar results of FTIR were obtained by Tarapoulouzi et al.,28 in various cheese matrices.The broad band at 3269 cm⁻¹ is due to the combined stretching vibrations of hydroxyl (-OH) groups due to water or carbohydrates, plus N-H stretching of amide groups. Foda et al.,29noted bands between 3330-3060 cm⁻¹ in the FTIR spectra of white soft cheeses. The presence and prominence of this band in Jameed means that it has high moisture content and/or strong hydrogen bonding interactions. The band at 2927 cm⁻¹ is due to asymmetric and symmetric stretching vibrations of C-H bonds, which in this case, is due to incorporation of fatty acids, lipids, and proteins.30 The level of this band FTIR reflects fat content of Jameed and bands’ FTIR different intensities represent difference in amount and type of lipids incorporated. The proportions of saturated and unsaturated fatty acids, or the presence of both, may result in minor shifts of this band and affect the transmittance.31
The absorption band seen around 1625 cm⁻¹ corresponds to the amide I band, which, for the protein backbone, is sensitive to the peptides’ secondary structure and arises mainly from the C=O stretching. Some amide-related features in the spectra have been noted in cheese, although the position and intensity of the spectral features differ, representing the different compositions, processing, and different protein network structures.32,33 The intensity, position, and width of the amide I band can help describe the protein network structure and the effect of the fermentation, drying, and milling processes on its structure 2. The band observed around 1529 cm⁻¹ can be assigned to the amide II region and arises from N–H bending and C–N stretching. This supports that protein structures have an influence in the spectra of jameed; however, the band does not show any of the product amino acids and it does not show any of the peptide segments/protein fractions in the jameed without complementary separation analyses.Dispersions of concentrated casein that exhibit weak shear flow may form a partially aggregated state with the dispersed casein particles that is shear resistant. However, as the applied shear rate is increased, the dispersed casein particle structures may become oriented and flow may be disrupted.34,35 Variations in protein hydration, mineral balance, particle aggregation, and reconstitution may explain the lack of simple or direct dependency between jameed powder and the shear stress relationship. However, as noted in Figure 2, a discontinuous increase in shear rate should not be equated to thixotropic behavior. Proof of thixotropic behavior would be to illustrate the time-dependent structural recovery of the dispersions, for instance by performing a shear rate recovery test, or a thixotropic test wherein a shear rate is applied in a step manner. The broad range of n values for MS is in agreement with the large differences of flow behavior for MS samples and may represent relatively significant fitting uncertainty for dispersions exhibiting low shear stress. Consequently, the reported n value should be considered for each formulation, and not as evidence for a particular concentration-dependent effect. Also, the n value should be considered along with K, the consistency coefficient. For this reason, the previously stated unqualified assumption regarding the significant and systematic increase of K between 2% and 10% powder concentration was eliminated, as such an assumption was not supported with the flow curves presented in Figure 2.
The increase in both moduli with angular frequency indicates that the dispersed structures had less time to rearrange or relax as the oscillation rate increased. The particularly high moduli of MZ10 and MZ4 suggest greater particle connectivity and resistance to deformation, potentially arising from differences in casein aggregation, mineral-mediated interactions, particle hydration, and the effective volume occupied by the reconstituted solids.36,37 However, the concentration effect was non-linear: MZ10 and MZ4 were the strongest MZ formulations, whereas MS6—not MS10—showed the highest MS moduli. Thus, the viscoelastic behavior was governed by the physicochemical state of the reconstituted particles rather than powder concentration alone.
A higher G′ than G″ denotes a principally elastic or solid-like response within the tested linear viscoelastic region, while an increase in G″ reflects greater viscous dissipation and molecular mobility. This interpretation corresponds with the general rheological behavior of structured dairy systems, where dominance of G′ over G″ is linked with stronger internal network formation and higher resistance to deformation.38,39
The initial decrease is indicative of thermal softening of the jameed matrix, most likely attributable to disruption of weak intermolecular interactions, enhanced molecular mobility, and the melting or structural reorganization of fat-associated domains. Comparable temperature-induced softening phenomena have been documented in cheese systems, particularly in fat-rich matrices, where heating initially reduces elastic resistance prior to subsequent structural rearrangement or aggregation.39,40 Above approximately 60 °C, the rapid increase in G′ and G″, especially in MZ10, suggests heat-induced reinforcement of the dispersed matrix. This behavior may be related to enhanced protein aggregation, stronger hydrophobic interactions, and increased association among casein-rich particles upon heating.
In systems where food requires a thickening of the structure with the application of heat, the response of MZ10 would be favorable. The response of the MZ samples is also favorable with the application of heat in dairy systems. The response of the MZ samples would also be favorable with the application of heat in cheese and in MZ systems with higher fat levels as G′ and G″ would be higher in the MZ systems with higher fat levels.39
Although structurally MS is reasonably stable, it appears to undergo some thermal restructuring, particularly since the reduced modulus values of MS suggest that the protein-fats matrix is weak or not fully developed. This could be related to hydration of the protein, compositional differences, the distribution of the particles, design equilibrium of the minerals, and the degree of protein aggregation post powder reconstitution, among other factors. The altered viscoelastic characteristics of the dairy matrices have been attributed to changes in the strength of protein matrices, fat content, and the degree of molecular interactions.39,40
From the temperature sweep, it was confirmed that the MZ jameed powders were more thermally responsive with a more pronounced elastic viscoelastic character than the MS powders. In the most structured treatments, the dominance of G′ over G″ suggests that the dispersions were primarily elastic in character. This does not imply that there is full recovery of the structure after all types of deformation. Rather it suggests that, in the range of linear viscoelasticity, the elastic component was greater than the viscous component. This is a typical rheological behavior of dairy matrices that have a protein network that is developed with a high degree of molecular interaction.38,39 With this consideration, MZ powders could be used for applications that require higher thermal stability and more structure, whereas MS powders could be used in applications that are more soft and easily pourable.
The higher antioxidant capacity of MZ may be associated with differences in milk composition and manufacturing history, including fermentation conditions, drying practices, salt–mineral balance, and storage before analysis. These factors may influence the production, retention, and stability of water-soluble antioxidant constituents during jameed manufacture, although their individual effects were not evaluated in the present study. The antioxidant contribution of jameed to formulated food products has also been reported by Hussein et al.41 while fermentation duration and the metabolic activity of specific lactic acid bacteria may influence the formation of antioxidant peptides and organic acids, as described by Khubber et al.42
The antioxidant capacity of whole jameed powder should not, however, be interpreted as directly proportional to the activity of isolated peptide fractions. The response of the aqueous powder extract represents the combined contribution of soluble peptides, proteins, organic acids, and other redox-active-matrix constituents, in addition to the effects of extraction and assay conditions. Therefore, comparisons with isolated peptide fractions should be made cautiously. Owing to the limited literature on the rheological and structural behavior of reconstituted jameed powder, selected cheese and concentrated dairy-protein systems were used for contextual comparison because they contain comparable casein-rich matrices; nevertheless, differences in processing, moisture, salt content, and product structure preclude direct equivalence.
Conclusion
The jameed powders from northern (MZ) and southern (MS) Jordan possessed different physicochemical, rheological, and antioxidant properties. After being reconstituted, the dispersions exhibited shear-thinning behavior with elastic dominance, and the structural development of the dispersions did not increase consistently with the concentration of the jameed powders. In general, the dispersions of jameed from northern Jordan exhibited stronger rheological responses, and among all of the samples, the jameed powder from northern Jordan (MZ10) had the greatest resistance to deformation and exhibited the most pronounced heat-induced strengthening. The differences in rheological behavior of the jameed powders likely stem from differences in jameed composition, the degree of particle hydration, and the interactions of protein and the jameed powder minerals.
These results suggest that jameed, even after extensive milling, retains measurable antioxidant capacity and forms structured dispersions with properties that are promising for its use as an ingredient in powdered dairy systems. However, the results presented here are based on only a few traditional samples, and thus are not representative for all jameed produced in the two sampling regions. In order to assess the industrial applicability of jameed, additional sampling and jameed evaluation for reconstitution, sensory characteristics, microbial stability, and behavior within other formulated food products are warranted.
Acknowledgement
The authors are thankful to Department of Nutrition and Food Processing; Al-Balqa applied University Jordan for providing necessary facility for conducting this research work
Funding Sources
The research reported in this publication was funded by the Deanship of Scientific Research and Innovation at Al- Balqa Applied- University in Jordan under Award Number DSR-2018-#10.
Conflict of Interest
The authors declare that they have no conflicts of interest.
Data Availability Statement
This statement does not apply to this article.
Ethical Approval Statement
Not applicable. This study did not involve human participants or live animals.
Informed Consent Statement
This study did not involve human participants, and therefore, informed consent was not required.
Clinical Trial Registration
This research does not involve any clinical trials.
Permission to Reproduce Material from Other Sources
Not Applicable.
Author Contributions
- Moawiya Haddad: Conceptualization, methodology, data collection, formal analysis, supervision, writing—original draft, and writing—review and editing.
- Saeid Abu-Romman: Data collection, formal analysis, funding acquisition, and writing—review and editing.
- Maher Obeidat: Resources, formal analysis, and supervision.
- Da’sanJaradat: Visualization, methodology, formal analysis, and supervision.
References
- Hilali MED, Rekik M, Hijazi J, Ababenah H. Nutritional and food safety characteristics of jameed—a traditional dairy product of drylands. Appl Sci. 2024;14(2):678. doi:10.3390/app14020678
CrossRef - Güler G, Vorob’ev MM, Vogel V, Mäntele W. Proteolytically-induced changes of secondary structural protein conformation of bovine serum albumin monitored by Fourier transform infrared and UV-circular dichroism spectroscopy. Spectrochim Acta A Mol Biomol Spectrosc. 2016;161:8-18. doi:10.1016/j.saa.2016.02.013
CrossRef - Alqaisi O, Ndambi OA, Uddin MM, Hemme T. Current situation and the development of the dairy industry in Jordan, Saudi Arabia, and Syria. Trop Anim Health Prod. 2010;42:1063-1071. DOI: 10.1007/s11250-010-9553-y
CrossRef - Haddad MA, Yamani MI, Abu-Romman SM, Obeidat M. Chemical Profiles of Selected Jordanian Foods. Springer; 2021. Series ISSN 2191-5407 Edition Number1 DOI https://doi.org/10.1007/978-3-030-79820-8
CrossRef - Faccia M, D’Alessandro AG, Summer A, Hailu Y. Milk products from minor dairy species: A review. 2020;10(8):1260. doi:10.3390/ani10081260
CrossRef - Al-Saed AK, Al-Groum RM, Al-Dabbas MM. Implementation of hazard analysis critical control point in jameed production. Food Sci Technol Int. 2012;18(3):229-239. https://doi.org/10.1177/1082013211427783
CrossRef - Alu’datt MH, Rababah T, Al-Rabadi GJ, et al. Effects of sun and freeze-drying techniques on molecular, fatty acid and therapeutic properties of fermented goat milk product. J Food Sci Technol. 2015;52:5989-5995. doi: 10.1007/s13197-014-1653-7
CrossRef - Hamad MN, Ismail MM, El-Menawy RKA. Effect of Jameed form on the chemical composition, rheological and microbial properties. J Food Technol Res. 2016;3(2):72-87. DOI: 10.18488/journal.58/2016.3.2/58.2.72.87
CrossRef - Konuspayeva G, Baubekova A, Akhmetsadykova S, Faye B. Traditional dairy fermented products in Central Asia. Int Dairy J. 2023;137:105514. doi:10.1016/j.idairyj.2022.105514
CrossRef - Atallah AA, El-Deeb AM, Mohamed EN. Shelf-life of Domiati cheese under modified atmosphere packaging. J Dairy Sci. 2021;104(8):8568-8581.https://doi.org/10.3168/jds.2020-19956
CrossRef - Brown SRB, Forauer EC, D’Amico DJ. Effect of modified atmosphere packaging on the growth of spoilage microorganisms and Listeria monocytogenes on fresh cheese. J Dairy Sci. 2018;101(9):7768-7779. doi:10.3168/jds.2017-14217.
CrossRef - Conte A, Gammariello D, Di Giulio S, Attanasio M, Del Nobile MA. Active coating and modified-atmosphere packaging to extend the shelf life of Fior di Latte cheese. J Dairy Sci. 2009;92(3):887-894. doi:10.3168/jds.2008-1500.
CrossRef - AOAC International. Official Methods of Analysis of AOAC International. 22nd ed. Latimer GW Jr, ed. Oxford University Press; 2023. doi:10.1093/9780197610145.001.0001
CrossRef - Widyasari R, Rawdkuen S. Extraction and characterization of gelatin from chicken feet by acid and ultrasound-assisted extraction. Food and Applied Bioscience Journal. 2014;2(1):85-97. Agro-Industry, Chiang Mai University. DOI: https://doi.org/10.14456/fabj.2014.7
- Rao MA. Rheology of Fluid, Semisolid, and Solid Foods: Principles and Applications. 3rd ed. Springer; 2014. doi:10.1007/978-1-4614-9230-6
CrossRef - Rather JA, Akhter N, Rather SA, Masoodi FA, Dar BN. Effect of xanthan gum treatment on the shelf-life enhancement of retorted meatballs (Goshtaba): A traditional meat product of India. Measurement: Food. 2024;13:100127. doi:10.1016/j.meafoo.2024.100127
CrossRef - Rather JA, Makroo HA, Showkat QA, Majid D, Dar BN. Recovery of gelatin from poultry waste: Characteristics of the gelatin and lotus starch-based coating material and its application in shelf-life enhancement of fresh cherry tomato. Food Packag Shelf Life. 2022;31:100775. doi:10.1016/j.fpsl.2021.100775
CrossRef - Bonilla J, Sobral PJA. Investigation of the physicochemical, antimicrobial and antioxidant properties of gelatin-chitosan edible film mixed with plant ethanolic extracts. Food Biosci. 2016;16:17-25. doi:10.1016/j.fbio.2016.07.003
CrossRef - Dzięcioł M, Wróblewska A, Janda-Milczarek K. Comparative studies of DPPH radical scavenging activity and content of bioactive compounds in maca (Lepidium meyenii) root extracts obtained by various techniques. Appl Sci. 2023;13(8):4827. doi:10.3390/app13084827
CrossRef - Wemmenhove E, Wells-Bennik MHJ, Zwietering MH. A model to predict the fate of Listeria monocytogenes in different cheese types: A major role for undissociated lactic acid in addition to pH, water activity, and temperature. Int J Food Microbiol. 2021;357:109350. https://doi.org/10.1016/j.ijfoodmicro.2021.109350
CrossRef - Claeys WL, Verraes C, Cardoen S, et al. Consumption of raw or heated milk from different species: An evaluation of the nutritional and potential health benefits. Food Control. 2014;42:188-201. doi:10.1016/j.foodcont.2014.01.045
CrossRef - Al-Qudah YH, Tawalbeh YH. Influence of production area and type of milk on chemical composition of Jameed in Jordan. J Rad Res Appl Sci. 2011;4(4):1263-1270.
- Tiwari U, Walsh D, Rivas L, Jordan K, Duffy G. Modelling the interaction of storage temperature, pH, and water activity on the growth behaviour of Listeria monocytogenes in raw and pasteurised semi-soft rind washed milk cheese during storage following ripening. Food Control. 2014;42:248-256. 10.1016/j.foodcont.2014.02.005
CrossRef - Duarte RV, Moreira SA, Fernandes PAR, et al. Whey cheese longer shelf-life achievement at variable uncontrolled room temperature and comparison to refrigeration. J Food Process Preserv. 2017;41(6):e13307. doi:10.1111/jfpp.13307
CrossRef - António JFDR. Development of an Active Whey Protein Film Using Portuguese Green Tea (Camellia sinensis L.) Extract to Enhance Latin-Style Fresh Cheese Shelf Life [dissertation]. Universidade de Coimbra; 2021.
- Milovanovic B, Djekic I, Miocinovic J, et al. What is the color of milk and dairy products and how is it measured? Foods. 2020;9(11):1629. doi:10.3390/foods9111629.
CrossRef - Kelava Ugarković N, Rusan T, Vnučec I, Konjačić M, Prpić Z. Concentrations of retinol and carotenoids in Jersey milk during different seasons and possible application of the colour parameter as an indicator of milk carotenoid content. Mljekarstvo. 2020;70(4):266-274. doi:10.15567/mljekarstvo.2020.0404
CrossRef - Tarapoulouzi M, Kokkinofta R, Theocharis CR. Chemometric analysis combined with FTIR spectroscopy of milk and Halloumi cheese samples according to species’ origin. Food Sci Nutr. 2020;8(7):3262-3273. https://doi.org/10.1002/fsn3.1603
CrossRef - Foda MI, Bahgaat WK, Kassem JM, Aly SE. Fourier transform infrared spectra in relation to the composition of white soft cheese. World Appl Sci J. 2013;26(3):289-295. DOI: 10.5829/idosi.wasj.2013.26.03.13477
- Kumar MM, Kumari SB, Kavitha E, Velmurugan B, Karthikeyan S. Spectral profile index changes as biomarker of toxicity in Catla catla studied using FTIR and principal component analysis. SN Appl Sci. 2020;2:1-10. https://doi.org/10.1007/s42452-020-3001-z
CrossRef - Stefanov I, Baeten V, Abbas O, Vlaeminck B, De Baets B, Fievez V. Evaluation of FT-NIR and ATR-FTIR spectroscopy techniques for determination of minor odd- and branched-chain saturated and trans unsaturated milk fatty acids. J Agric Food Chem. 2013;61(14):3403-3413. dx.doi.org/10.1021/jf304515v
CrossRef - Khan UM, Sameen A, Decker EA, et al. Implementation of plant extracts for cheddar-type cheese production in conjunction with FTIR and Raman spectroscopy comparison. Food Chem X. 2024;22:101256. doi:10.1016/j.fochx.2024.101256
CrossRef - Yaman, H., Aykas, D. P., & Rodriguez-Saona, L. E. (2023). Monitoring Turkish white cheese ripening by portable FT-IR spectroscopy. Frontiers in Nutrition, 10, 1107491. https://doi.org/10.3389/fnut.2023.1107491
CrossRef - Sauer, A., Doehner, I., & Moraru, C. I. (2012). Steady shear rheological properties of micellar casein concentrates obtained by membrane filtration as a function of shear rate, concentration, and temperature. Journal of Dairy Science, 95(10), 5569–5579. https://doi.org/10.3168/jds.2012-5501
CrossRef - Lucey JA, Horne DS. Perspectives on casein interactions. Int Dairy J. 2018;85:56-65.
CrossRef - Martínez-Padilla LP. Rheology of liquid foods under shear flow conditions: recently used models. J Texture Stud. 2024;55(1):e12802. doi:10.1111/jtxs.12802.
CrossRef - Bouchoux A, Debbou B, Gésan-Guiziou G, Famelart MH, Doublier JL, Cabane B. Rheology and phase behavior of dense casein micelle dispersions. J Chem Phys. 2009;131(16):165106. doi:10.1063/1.3245956.
CrossRef - Qian Y, Kawashima S. Use of creep recovery protocol to measure static yield stress and structural rebuilding of fresh cement pastes. Cem Concr Res. 2016;90:73-79. https://doi.org/10.1016/j.cemconres.2016.09.005
CrossRef - Bansal V, Kanawjia SK, Khetra Y, Debnath A, Deshmukh G. Steady and dynamic rheological properties of cheese dip: Effect of milk proteins, fat and cheddar cheese. Measurement: Food. 2022;8:100066. doi:10.1016/j.meafoo.2022.100066
CrossRef - Brighenti M, Govindasamy-Lucey S, Lim K, Nelson K, Lucey JA. Characterization of the rheological, textural, and sensory properties of samples of commercial US cream cheese with different fat contents. J Dairy Sci. 2008;91(12):4501-4517. doi:10.3168/jds.2008-1322
CrossRef - Hussein AS, Bahgaat WK, Ibraheim GE. Impact of Jameed fortification on physicochemical, antioxidant and volatile compounds of snacks. Egypt J Chem. 2022;65(5):1-11. DOI: 10.21608/ejchem.2021.94512.4442
CrossRef - Khubber S, Marti-Quijal FJ, Tomasevic I, Remize F, Barba FJ. Lactic acid fermentation as a useful strategy to recover antimicrobial and antioxidant compounds from food and by-products. Curr Opin Food Sci. 2022;43:189-198. https://doi.org/10.1016/j.cofs.2021.11.013
CrossRef
 PlumX:
 Views: 1148
  PDF Downloads:
298
PDF Downloads:
298 
Accepted on: 30 Jul 2026
Second Review by: Dhivya Rajasekar
Final Approval by: Dr. Yogesh Shrinivas Gat





Web of Science Coverage
Emerging Sources Citation Index (ESCI)
2024 Journal Impact Factor: 1.1
Scopus Journal Metrics
CiteScore 2025: 2.6
CiteScore Details
Sustainable Nutrition: Food Systems, Nutrient Retention, and Public Health Impact

This journal is a member of, and subscribes to the principles of, the Committee on Publication Ethics (COPE)