Yeast Mediated Expeditious Citrus limetta (Sweet Lemon) Peels Bioenzyme Preparation and Characterization using Response Surface Methodology
 , , 2*, Yashika Aggarwal1, Karvembu Palanisamy1 and Iqbal Singh2
 1Department of Microbiology, Punjab Agricultural University, Ludhiana, India
2Department of Renewable Energy Engineering, Punjab Agricultural University, Ludhiana, India
Corresponding Author Email: urmilphutela@pau.edu
Download this article as:
ABSTRACT:Sweet lemon is a major fruit belonging to the citrus family and widely used for the taste as well as for processing which generate the huge amount of peels and need to be utilized effectively to avoid the social as well as environmental ill impact caused by the same. Therefore, the present study was aimed to utilize peels for the production of bioenzyme using Response Surface Methodology (RSM). Four different independent process parameters viz. jaggery, previous bioenzyme inoculum, yeast culture, and day of sample extraction were selected and the effect of these parameters on the production of bioenzyme was ascertained by central composite design. Jaggery concentration of 25.36%, previous bioenzyme inoculum concentration of 20%, yeast culture of 2%, and extraction day of 40 days were found optimum for low pH, minimum days of settling, maximum cellulolytic activity, and maximum laccase activity. Under these conditions pH 3.24, days of setting 40, cellulolytic activity of 454.2 U/mL and laccase activity of 0.21 U/mL was found. Further the FT-IR analysis of prepared bioenzyme has shown the presence of various important functional compounds with significance in various fields of bioremediation and bioenergy. Thus, the findings will help in the management of citrus waste with better return to the growers and processors.
KEYWORDS:Bioenzyme; Fermentation; FT-IR (Fourier Transform Infrared Spectroscopy); RSM (Response Surface Methodology); Sweet Lemon Waste
Introduction
Sweet lemon (Citrus limetta), a member of the Rutaceae family, is widely recognized for its remarkable nutritional and medicinal benefits. This citrus fruit is primarily processed for its juice, which accounts for less than half of the fruit’s total weight, leading to the generation of substantial amounts of perishable waste, including peels and seeds.1 Each year, vast quantities of such waste are produced, posing major environmental and waste management concerns. For example, India alone generates over 13 million tonnes of citrus waste annually.2 Despite being considered waste, these byproducts are powerhouse of nutrients and bioactive compounds, such as flavonoids, limonoids, and essential oils, making them valuable for possible applications in the pharmaceutical and food industries.3
Bioenzymes offer an innovative and environmentally sustainable way to handle organic waste. This process, first popularized by Dr. Rosukon Poompawong, creates valuable organic solutions by fermenting kitchen scraps like fruit and vegetable peels together with sugar sources such as brown sugar, jaggery, or molasses, and water. Frequently celebrated as a method that “transforms waste into valuable resources,” bioenzymes provide a cost-effective and eco-friendly approach, turning organic refuse into products that enhance both environmental health and societal well-being.4
The native microbial communities of Citrus limetta peels provide a rich inoculum for spontaneous fermentation, forming the biological foundation of bioenzyme synthesis. Recent studies have identified a diverse range of microorganisms from sweet lime peels including phylum Proteobacteria (Pseudomondata). When these microbial consortia are introduced into fermentative conditions with citrus waste and sugar, they initiate a cascade of biochemical reactions that progressively lowering the pH from near-neutral to acidic primarily through the secretion of organic acids such as citric, lactic, and acetic acids and consequently proliferating these bacterial communities, facilitates the secretion of hydrolytic enzymes.5
Microbial succession during facultative anaerobic fermentation of citrus peels typically begins with Betaproteobacteria of the Comamonadaceae family (e.g., Burkholderiales), which flourish under semi‑aerobic conditions using sugars and simple substrates and initiate acid production. These early colonizers secrete hydrolytic enzymes such as cellulases and pectinases facilitating the degradation of complex carbohydrates in the substrate, and begin to lower the pH from near-neutral. As oxygen becomes limited and acidity increases, Alphaproteobacteria, especially members of the Acetobacteraceae family (e.g., Acetobacter and Komagataeibacter), progressively dominate the community. These acetic acid bacteria are capable of oxidizing ethanol or sugars into acetic, gluconic, and other organic acids, driving the pH into the acidic range and promoting acidogenic fermentation.5-7
This shift in microbial ecology strongly influences enzyme production dynamics: early-stage acidification and hydrolysis by Comamonadaceae support robust secretion of cellulolytic and hemicellulolytic enzymes, while in later, low‑pH conditions favored by Acetobacteraceae, oxidative enzymes such as laccases and lignin-degrading peroxidases may be induced, especially on phenolic-rich citrus substrates. This microbial succession from aerobic hydrolysis to acidification and oxidative fermentation underpins the structured biosynthesis of bioenzymes in the system, coupled tightly to progressive pH decline.6,7
Typically, bioenzyme production requires approximately three months for completion. However, employing yeast cultures such as Baker’s yeast and fungus as Aspergillus spp. As prior inoculum can significantly reduce the fermentation period, enhancing its industrial scalability by increasing the yield of functional enzymes, notably amylase and cellulase. Yeast contributes to early fermentation dynamics by rapidly metabolizing sugars and creating a favorable anaerobic environment.8 Optimizing cultural conditions such as temperature, pH, days of settling and substrate concentrations9 is crucial to maximizing the yield of bioenzyme. Conventional optimization methods, involving repetitive experiments, are time-consuming and resource-intensive. Response Surface Methodology (RSM), a robust statistical optimization tool, can address this limitation by identifying optimal conditions through fewer experimental runs.10
While the application of RSM for enhancing bioenzyme production has been explored for bioenzyme production,11 but yeast (Saccharomyces cerevisiae) mediated expeditious production of bioenzyme from sweet lemon waste using RSM remains unreported. In this context, the present study investigates the utilization of sweet lemon waste for bioenzyme production. It aims to optimize the production conditions using RSM and characterize the resultant bioenzyme for its biochemical properties, presenting an innovative approach to addressing waste valorization and sustainability challenges.
Materials and Methods
Procurement of material for bio-enzyme preparation
Fresh sweet lemon (Citrus limetta) peels were procured as agro-industrial by-products from local juice vendors situated near Punjab Agricultural University (PAU), Ludhiana, India. These peels were collected immediately after juice extraction to avoid microbial spoilage and were cut into uniform pieces (approximately 4–5 cm in length). The jaggery used as a carbon source was obtained from a local market and was of food-grade quality. The inoculum for this study consisted of a previously fermented batch of bioenzyme derived from sweet lemon waste after a 90-day fermentation period. The yeast strain Saccharomyces cerevisiae, selected for its known fermentative and enzymatic capabilities to solubilize organic waste, was obtained from the Biogas Laboratory, Department of Renewable Energy Engineering, Punjab Agricultural University, Ludhiana. The strain was maintained on glucose yeast extract agar (GYEA) slants and sub-cultured biweekly to preserve viability.
Bioenzyme preparation and experimental design
For the experimental setup the bioenzyme traditionally prepared by mixing sweet lemon peels, jaggery, and water in a 3:1:10 ratio was modified. Specifically, 360 g of chopped peels, and 1200 mL of distilled water were combined in a 2-Liter airtight plastic container, to maintain the fixed ratios ensuring 30% headspace to allow for gas expansion during fermentation. Initially, jaggery in grams (% standardized to 10, 20 and 30 % v/w of citrus peels and added as 36 g, 72 g and 108 g) was completely dissolved in water under sterile conditions, followed by the addition of sweet lemon peels. Subsequently, according to peels weight of 360 g the previous bioenzyme inoculum (liquid) was added to the bottles (% standardized to 0, 10 and 20 % v/w of citrus peels and added as 0 mL, 36 mL and 72 mL) and of the freshly grown S. cerevisiae (yeast) culture according to v/w of peels (% standardized to 0, 1 and 2 % v/w of citrus peels and added as 0 mL, 3.6 mL and 7.2 mL) were introduced into the mixture and volume was made upto 1200 mL to maintain the ratios (Table 1). The containers were incubated at room temperature for 90 days. Throughout the fermentation period, samples were extracted at 30th, 60th, and 90th day to assess pH changes, and enzymatic activities. The end of the fermentation process was marked by complete sedimentation, cessation of gas release, a stabilized acidic pH, and the development of a pleasant sour aroma.
Table 1: Levels and ranges of experimental variables
|
Factors |
Level of factors | ||
|
|
-1 | 0 |
+1 |
| Jaggery (% w/w) | 10% (36g) | 20% (72g) |
30% (108g) |
|
Previous bioenzyme inoculum concentration (% v/w) |
0% (0 mL) | 10% (36 mL) | 20% (72 mL) |
| Yeast culture (% v/w) | 0% (0 mL) | 1% (3.6 mL) |
2% (7.2 mL) |
|
Day of sample extraction (Day) |
30th day | 60th day |
90th day |
Jaggery concentration (% w/w) represents the ratio of jaggery mass (g) to the fixed mass of sweet lemon peels (360 g) used per fermentation bottle. Previous bioenzyme inoculum concentration (% v/w) denotes the volume of inoculum added (mL) relative to the 360 g of sweet lemon peels. Yeast culture concentration (% v/w) refers to the volume of Saccharomyces cerevisiae culture (mL) added per 360 g of peels in each bottle.
The experimental setup consisted of 29 plastic bottles, each containing fixed quantities of forementioned setups, maintaining a consistent waste-to-water ratio. Various parameters, including pH, days of settling, cellulolytic activity, and laccase activity, were analyzed for all 29 bottles at 30th, 60th and 90th day of extraction by aseptically withdrawing 15 mL of fermented liquid at these 3-time periods, centrifuged at 10,000 g for 20–25 minutes at 4°C. The clear supernatant was collected and stored at 4°C for further analysis of enzyme activity.9 Three-dimensional surface plots were generated using the fitted model in the software. Additionally, response surface methodology (RSM) was adopted to conduct multiple regression analysis, with the statistical significance of the quadratic polynomial model evaluated using an F-test. The accuracy and reliability of the regression model were further assessed through the correlation coefficient (r) and the coefficient of determination (R²). All experiments were performed in triplicate, incorporating the specified parameters, and enzymatic activities were calculated accordingly. To determine the optimal levels and interactions of the selected variables for bioenzyme production, predictive equations were utilized.10,11
Utilizing Response Surface Methodology (RSM) anchored in a Central Composite Design (CCD), the study pinpointed the optimum levels of variables that significantly affect various responses. In this investigation, four independent factors jaggery concentration % (w/w), the concentration of the previous bioenzyme inoculum % (v/w), yeast culture % (v/w), and the duration of bioenzyme extraction(days) were examined for their influence on four dependent responses: pH, days of settling, cellulolytic activity, and laccase enzyme activity. The analysis was carried out using Design Expert Software, and the factor with the most impact on the response was identified.
A, B, C and D are responsible for jaggery concentration % (w/w), previous bioenzyme inoculum concentration % (v/v), yeast culture % (v/v) and day of sample extraction respectively.
Estimation of pH
The pH of the filtered bioenzyme was analyzed by means of a digital pH meter to ensure precise measurement. Prior to analysis, the pH meter was calibrated with solutions of fixed buffering capacity for standardization purposes (pH 4.0, 7.0, and 10.0). A 50 mL aliquot of the bioenzyme sample was transferred into a clean beaker and equilibrated to room temperature. The pH electrode was then fully immersed in the sample, and the pH value was recorded once the reading stabilized. To prevent cross-contamination and maintain measurement accuracy, the electrode was rinsed with distilled water before and after each use.12
Days of settling
The production of bioenzyme involved fermenting fruit peels with jaggery along with yeast, in a specific ratio within airtight containers over a period of approximately 90 days. Throughout the fermentation process, the days for substrate material to settle below the clear supernatant layer was observed to assess the progression and determine the optimal days of settling for the peels and the bioenzyme typically exhibiting a stabilized clear supernatant with settled solids at the bottom, and a pleasant acidic fragrance, indicating readiness for application and breakdown of solid organic matter of sweet lemon peels.13
Cellulase enzyme activity
Cellulase activity was determined using a standardized assay. The assay involved incubating carboxymethyl cellulose (CMC) of 0.5 mL with 0.01 mL of enzyme extract and 0.49 mL of citrate buffer at 50°C for 30 minutes. The level of reducing sugars produced in the reaction was determined using the dinitro salicylic acid (DNS) approach.14 Cellulase activity was expressed in international units (IU), where one IU is regarded as the quantity of enzyme capable of liberating one micromole of reducing sugar measured as glucose per minute from every millilitre of the enzyme solution. When necessary, suitable dilution adjustments were implemented to ensure accurate evaluation of the enzyme’s activity.

Laccase enzyme activity
Laccase enzyme activity was estimated by a reaction mixture consisting of 0.8 mL of guaiacol solution, 0.8 mL of clear supernatant of enzyme, and 2.4 mL of acetate buffer was prepared and added to a cuvette. The components were thoroughly mixed, and the absorbance change was measured at 465 nm using a Shimadzu 1780 spectrophotometer. Absorbance readings were taken at 15 s intervals for a total duration of 180 s, with a blank control lacking sample as the reference. An increase in optical density (OD) of 0.001 over 60s was considered equivalent to one unit of enzyme activity.15
Model fitting of optimized conditions obtained in RSM
Subsequently, a model validation experiment was performed using the optimal levels of the independent variables as identified through the Central Composite Design (CCD) under Response Surface Methodology (RSM). This experiment was conducted to confirm the accuracy and predictive capability of the developed quadratic model. By applying the optimized combinations of the process parameters, the experiment yielded the maximum observed value of the response variable, thereby supporting the adequacy and reliability of the statistical model.
Fourier Transform Infrared (FT-IR) Spectroscopy
Fourier Transform Infrared (FTIR) spectroscopy was employed to identify the functional groups present in the liquid bioenzyme. Spectral measurements were conducted using an FTIR spectrometer (Agilent Cary 630 FTIR, Agilent Technologies, USA) equipped with an Attenuated Total Reflectance (ATR) accessory. Prior to analysis, the ATR crystal surface was thoroughly cleaned with ethanol and dried to eliminate any residual contaminants. 30 µL of the liquid bioenzyme sample was directly applied onto the ATR crystal without any dilution or pretreatment. The spectrum was recorded in the mid-infrared range of 4000–400 cm⁻¹ at a resolution of 4 cm⁻¹, averaging 32 scans per sample for optimal signal-to-noise ratio. A background spectrum (air) was recorded before each measurement and automatically subtracted from the sample spectrum. After each analysis, the crystal was cleaned with ethanol and deionized water to prevent cross-contamination between samples.16
Data Analysis and Software
The experimental design, model development, and statistical analysis were carried out using Design Expert Software Version 11.1.2.0, applying response surface methodology (RSM). Statistical parameters were assessed through analysis of variance (ANOVA). Fourier Transform Infrared (FT-IR) spectroscopy analysis was performed with Origin 2025 (Version 10.2).
Results
Bioenzyme production
Twenty-nine runs suggested by RSM (Table 2) were performed. This multi-factor approach decreased the number of sets and time required to perform the experimental runs. The RSM recommended runs were carried out and results are depicted in table 1 which shows the effect of four factors viz. jaggery concentration (10%, 20% and 30%) (w/w), previous bioenzyme inoculum concentration (0%, 10% and 20%) (v/w), yeast (0%, 1% and 2 %) (v/w) and day of sample extraction (30th, 60th and 90th day) at different levels. The study analyzed response variables such as pH, days of settling, cellulolytic activity, and laccase activity in bioenzyme production using RSM.
Table 2: Optimization of bioenzyme production from sweet lemon waste using RSM
|
JG |
PBI | YC | DE | pH | DS | CA | LA |
| 10 | 10 | 1 | 30 | 3.79 | 72 | 413.94 |
0.063 |
|
30 |
10 | 1 | 30 | 3.01 | 28 | 352.34 | 0.240 |
| 20 | 0 | 0 | 60 | 3.36 | 90 | 373.98 |
0.180 |
|
30 |
20 | 1 | 60 | 3.06 | 26 | 398.82 | 0.210 |
| 10 | 20 | 1 | 60 | 3.47 | 67 | 415.34 |
0.048 |
|
30 |
0 | 1 | 60 | 3.17 | 40 | 309.06 | 0.174 |
| 30 | 10 | 2 | 60 | 3.02 | 67 | 321.93 |
0.250 |
|
20 |
10 | 1 | 60 | 3.38 | 52 | 340.25 | 0.026 |
The legends in the table represent 4 fixed and 4 response factors. Here 4 fixed factors are JG (%): Jaggery % (w/w); PBI (%): Previous Bioezyme Inoculum % (v/w); YC (%): Yeast Culture % (v/w); DE (Day): Day of sample Extraction. Similarly, response factors include DS: Days of Settling; CA (U/mL): Cellulolytic activity (U/mL); LA (U/mL): Laccase activity (U/mL).
Effect of variable factors on pH
The pH of the fermentation medium is a crucial parameter influencing microbial metabolism, enzyme activity, and stability. In the context of bioenzyme production, pH affects the enzymatic hydrolysis and microbial growth kinetics. During the fermentation process, Saccharomyces cerevisiae and other indigenous microflora modulate pH by metabolizing substrates and secreting organic acids or enzymes. A stable or slightly acidic pH has been shown to enhance bioenzyme activity by optimizing the biochemical environment for enzyme secretion and function. The observed pH variations across treatments are indicative of microbial adaptability and fermentation progression, directly impacting the bioenzyme’s efficacy. A significant interaction between jaggery and previous bioenzyme inoculum concentrations was observed, where increasing both factors led to a decrease in pH (Fig. 1a). The lowest pH 3.11 occurred at 30% jaggery and 20% inoculum, with the optimal range for acidification being 25%–30% jaggery and 0%–20% inoculum. Similarly, jaggery and yeast culture interaction showed a strong acidifying effect, reaching the lowest pH (2.96) at 30% jaggery and 2% yeast (Fig. 1b), with an optimal range of 25%–30% jaggery and 1%–2% yeast. The interaction between jaggery and fermentation duration also significantly affected pH, with a minimum of 2.96 at 30% jaggery and 30 days (Fig. 1c), and the most effective range identified as 25%–30% jaggery and 30 or 60 day of sample extraction. Lastly, the combined effect of previous bioenzyme inoculum and yeast culture reduced pH to 3.12 at 20% inoculum and 2% yeast, with an optimal range of 15%–20% inoculum and 1.74%–2% yeast (Fig. 1d).
ANOVA was utilized to partition the variability in pH among different contributing factors. The obtained F-value of 12.75 indicated that the model was statistically significant. Model terms were considered significant when the p-value was below 0.05. For pH, the linear terms (A, B, and C) exhibited p-values less than 0.05, confirming their significance at a 95% confidence level. The study found that jaggery had the most significant effect on pH (Table 2), followed by yeast and previous bioenzyme inoculums. The least p-value <0.0001 was found for jaggery indicating that it had the most significant effect on pH followed by yeast (p=0.0304) and previous bioenzyme inoculum (p=0.0092) whereas the day of sample extraction had a non-significant (p=0.4146) effect on pH. The results demonstrate a strong interaction, where increasing yeast culture in combination with previous bioenzyme inoculum led to a reduction in pH.
Effect of variable factors on days of settling
Settling time was chosen as a response variable to evaluate the physical stability and clarity of the bioenzyme, which are essential for downstream application and storage. During fermentation, microbial biomass, unutilized substrates, and particulate matter gradually settle, indicating the end of active microbial activity and product maturation. A shorter settling time suggests a more efficient fermentation process, reducing processing time and energy costs. Furthermore, settling correlates with the release and activity of enzymes such as cellulase and laccase that contribute to the degradation of peels, reducing suspended solids and enhancing bioenzyme clarity. The days required for bioenzyme settling were significantly affected by the interactive effects of jaggery concentration, previous bioenzyme inoculum, and yeast culture. The response surface plot (Fig. 1e) shows a strong interaction between jaggery and previous bioenzyme inoculum concentrations, where increasing both led to a reduction in days of settling. The shortest days of settling of 31 days was recorded at 30% jaggery and 20% inoculum, with the optimal range identified as 25%–30% jaggery and 15%–20% inoculum. Similarly, jaggery and yeast culture interaction (Fig. 1f) showed that increasing jaggery while maintaining low yeast levels reduced days of settling, with the shortest days of settling 33 days were observed at 30% jaggery and 0% yeast. The most effective range for minimizing days of settling was 25%–30% jaggery and 0%–0.5% yeast culture. In addition, the interaction between previous bioenzyme inoculum and yeast culture (Fig. 1g) demonstrated a synergistic effect, where increasing both led to reduced days of settling. The minimum of 35 days of settling was achieved at 20% inoculum and 2% yeast, with an optimal range of 15%–20% inoculum and 1.5%–2% yeast culture.
The ANOVA results confirm that the model is statistically significant (p=0.0199), indicating that at least one factor substantially influences the response variable. Among the individual factors, jaggery concentration had the most pronounced effect (p=0.0013), followed by yeast culture (p=0.0477) and the quadratic term for the day of sample extraction (p=0.0058), all of which significantly impacted the response. Additionally, the interaction between jaggery and yeast was found to be significant (p=0.0354). Conversely, factors such as previous bioenzyme inoculum concentration (p=0.0957), the day of sample extraction (p=0.7775), did not exhibit statistical significance (p>0.05), suggesting that their effects on the response were minimal. Furthermore, the lack of fit was not significant (p=0.0729), indicating that the model effectively represents the data without considerable unexplained variation. Overall, the findings suggest that jaggery concentration, yeast culture, and the quadratic effect of day of sample extraction are key determinants of the days of settling, and the non-significant lack of fit, the model is considered a good fit for the data.
Effect of variable factors on cellulolytic activity
The surface plot (Fig. 1h) illustrates the interactive effects of jaggery concentration and previous bioenzyme inoculum levels on cellulolytic activity. The results indicate a significant interaction, with the highest cellulolytic activity (397.47 U/mL) observed at 30% jaggery concentration and 20% previous bioenzyme inoculum concentration. The optimal range for maximizing bioenzyme production was identified between 10%–30% jaggery and 15%–20% previous bioenzyme inoculum concentration. Whereas, the surface plot (Fig. 1i) depicts the combined effect of jaggery and yeast culture on cellulolytic activity. A strong interaction was observed, with the highest activity (407.63 U/mL) recorded at 10% jaggery and 2% yeast culture. The optimal range for bioenzyme production was found within 10%–15% jaggery and 1.5%–2.0% yeast culture.
The ANOVA outcomes demonstrate that the model is statistically significant (p=0.0473), indicating that at least one variable notably affects cellulolytic activity. Among the primary factors, jaggery concentration (p=0.0292) and previous bioenzyme inoculum concentration (p=0.0038) showed a significant impact, while yeast culture (p=0.8031) and incubation time (p=0.4353) did not present significant effects. Interaction analysis revealed that the combinations of jaggery with previous bioenzyme inoculum (p=0.2740) and jaggery with yeast (p=0.2865) were not statistically significant, implying a limited combined influence. In contrast, interactions between jaggery and day of sample extraction (p=0.0330) and between previous bioenzyme inoculum and yeast (p=0.0499) were significant, highlighting their synergistic effect on cellulolytic activity. Furthermore, the model’s lack-of-fit test was non-significant (p=0.7079), suggesting a strong agreement between the model and the experimental data. These findings emphasize that jaggery and previous bioenzyme inoculum concentrations are key contributors to enhancing cellulolytic activity, with specific interaction effects also playing an important role. Overall, the model is statistically robust and suitable for predicting cellulolytic activity within the examined conditions.
Effect of variable factors on laccase activity
The surface plot (Fig. 1j) illustrates the interactive effects of jaggery concentration and previous bioenzyme inoculum levels on laccase activity. The analysis reveals a strong interaction, where an increase in both jaggery and previous bioenzyme inoculum concentration leads to an enhancement in laccase activity. The maximum laccase activity (0.24 U/mL) was recorded at 30% jaggery and 20% previous bioenzyme inoculum. The optimal range for maximizing bioenzyme production was identified between 25%–30% jaggery and 15%–20% previous bioenzyme inoculum. The surface plot (Fig. 1k) depicts the interactive effects of jaggery and yeast culture on laccase activity. A significant interaction was observed, with the highest laccase activity recorded at 30% jaggery and 2% yeast culture. The optimal conditions for bioenzyme production were found within 25%–30% jaggery and 0%–2% yeast culture.
The ANOVA results indicate that the model is statistically significant (p=0.0112, F = 3.61), suggesting that at least one of the factors has a notable impact on laccase activity. Among the main effects, jaggery concentration (p<0.0001) was found to be highly significant, demonstrating its crucial role in influencing laccase activity. However, previous bioenzyme inoculum (p=0.4741), yeast (p=0.6502), and day of sample extraction (p=0.1175) did not show significant individual effects, indicating that these factors alone do not strongly affect laccase activity. Additionally, all interaction terms were non-significant (p>0.05), suggesting that the combined effects of these variables do not significantly contribute to variations in laccase activity. The quadratic term for jaggery (A²) (p=0.0355) was significant, implying a non-linear relationship where an optimal concentration range exists for maximizing enzyme production, while the quadratic terms for previous bioenzyme inoculum, yeast, and day of sample extraction were non-significant (p=0.4539), confirming that the model adequately represents the data. Overall, the findings highlight that jaggery concentration is the most influential factor affecting laccase activity, with a quadratic effect suggesting an optimal range, while other variables and their interactions do not contribute significantly.
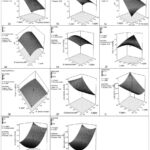 |
Figure 1: Surface plots of effect variables on response variables |
Fig. 1 presents surface plots illustrating the effects of various factors on a response variable across multiple subplots (1a to 1k). Each subplot examines the interaction between two factors, such as A (jaggery), B (previous bioenzyme inoculum), C (yeast), and D (day of sample extraction ), on the response variable (pH, days of settling, cellulase and laccase enzyme activity). The plots show how the response variable changes with different combinations of factor levels, with color gradients representing the magnitude of the response. Actual factors and their ranges are specified in each subplot, providing a visual analysis of the interaction effects in the experimental design.
Model fitting of optimized conditions obtained in RSM
Model adequacy was evaluated based on the coefficient of determination (R²), p-values, and Fisher’s F-values, as derived from ANOVA. The R² values demonstrated the strength of correlation between experimental and predicted responses, encompassing both main effects and interaction terms. Specifically, R² values for pH, days of settling, cellulolytic activity, and laccase activity were 0.9273, 0.7591, 0.7161, and 0.7829, respectively. Corresponding adjusted R² values were 0.8545, 0.5182, 0.4322, and 0.5658, while predicted R² values were 0.6809, –0.3094, -0.2006, and –0.0272. The close agreement between adjusted and predicted R² values (difference <0.2) supported the model’s suitability for prediction. Adequate precision values, reflecting the signal-to-noise ratio, were 14.159 (pH), 7.539 (days of settling), 5.707 (cellulolytic activity), and 6.097 (laccase activity), all exceeding the threshold of 4, indicating adequate signal strength to explore the design space. Moreover, the non-significant lack-of-fit F-values are 0.82, 1.44, 0.70, and 1.23, respectively which further validated the model’s robustness. Finally, model terms with p-values below 0.05 confirmed the statistical significance of the fitted models in predicting bioenzyme attributes (Table 3).
Table 3: Optimized conditions of RSM
|
Optimized conditions |
Responses | Predicted values | Desirability | Experimental values |
| Jaggery (25.36%)
Previous bioenzyme inoculum (20%) Yeast (2%) Day of sample extraction (40 days) |
pH | 3.01 | 0.97 |
3.24 |
|
Days of settling |
30 | 0.98 | 41 | |
| Cellulolytic activity(U/ml) | 403.4 | 0.92 |
454.2 |
|
|
Laccase activity(U/ml) |
0.27 | 0.99 | 0.21 | |
| Optimized desirability |
0.97 |
|||
Validation of model
The bioenzyme was reproduced under the optimal conditions suggested by the model, which included a jaggery concentration of 25.36%, a previous bioenzyme inoculum concentration of 20%, a yeast culture of 2%, and a fermentation period of 40 days. The resulting values for the dependent variables pH, days of settling, cellulolytic activity, and laccase activity was recorded as 3.01, 30 days, 403.4 U/mL, and 0.27 U/mL, respectively. These results closely matched both the best experimental run and the model’s predicted values at the optimum conditions. This close agreement confirmed the accuracy, reliability, and applicability of the model in optimizing the selected physicochemical parameters.
Fourier Transform Infrared (FT-IR) Spectroscopy
The FT-IR analysis (Fig. 2) of the validated bioenzyme produced through RSM optimization revealed characteristic absorption bands. A broad peak between 3400 and 3200 cm⁻¹ indicated O–H stretching vibrations, while sharp peaks near 2850 cm⁻¹ were associated with C–H stretching. The absorption observed around 1740 cm⁻¹ confirmed the presence of carbonyl (C=O) groups. Peaks detected within the 1600–1500 cm⁻¹ range corresponded to C=C stretching vibrations. The fingerprint region, located below 1500 cm⁻¹, displayed a series of distinctive peaks crucial for molecular identification. Additionally, absorption bands between 1200 and 1000 cm⁻¹ were linked to C–O stretching vibrations, and C–H bending vibrations appeared within the 900–700 cm⁻¹ range.
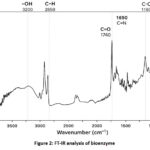 |
Figure 2: FT-IR analysis of bioenzyme. |
Fig. 2 displays the FT-IR analysis of bioenzyme produced in model validated conditions, depicts the absorbance (%) across a range of wavenumbers (cm⁻¹) from 4000 to 1000. Key peaks are identified at 3270 cm⁻¹ (-OH), 2850 cm⁻¹ (C-H), 1740 cm⁻¹ (C=O), 1650 cm⁻¹ (C=N), and 1160 cm⁻¹ (C-O), indicating the presence of specific functional groups in the bioenzyme sample.
Discussion
Citrus peels, rich in bioactive compounds like flavonoids and essential oils, present a sustainable resource for bioenzyme production, contributing to effective waste management. Utilizing citrus waste for bioenzyme synthesis mitigates landfill burden and reduces methane emissions, aligning with environmental sustainability goals.17 Key enzymes include proteases, amylases, cellulases, lipases, laccases and pectinases, which aid in degrading proteins, carbohydrates, complex compounds, fats, and pectin, respectively.18
In the study conducted above the bioenzyme was synthesized under RSM model-predicted optimal conditions, comprising 25.36% jaggery, 20% previous bioenzyme inoculum, 2% yeast culture, and a 40-day fermentation period. Similar to these previous studies conducted before reported effectiveness of Response Surface Methodology (RSM) combined with Artificial Neural Networks (ANN) for optimizing bioenzyme production and boosting enzymatic activities was tested. A fermentation blend composed of of pineapple peel and citrus peel, was subjected to ultrasound treatment and the highest enzymatic activities for amylase, lipase, and protease at a pH 6, temperature of 37°C, agitation speed of 218 RPM, and a fermentation duration of 3 days were achieved.11 The pH of bioenzymes is a critical factor influencing their stability and catalytic performance. Following fermentation, the bioenzymes typically demonstrate a mildly acidic pH ranging from 3.6 to 3.97, compared to the initial values between 4.31 and 7.08, a shift primarily due to the accumulation of organic acids as observed in study conducted.¹⁹ This observation is consistent with findings from other studies, which indicated that rising levels of organic acids are associated with a corresponding decrease in pH.²⁰
The fermentation process occurs in distinct phases, during the initial 30 days, microbial metabolism generates carbon dioxide (CO₂), causing the peels to float. Between 30 and 60 days, the solids begin to settle, and by 90 days, the mixture stabilizes, forming a clear bioenzyme liquid at the top while organic residues accumulate at the bottom.21 Therefore, days of sample extraction was taken as a response variable to validate the production of cellulase and laccase enzyme activity at various time period. Additionally, the native microbial succession in citrus peel fermentation in bioenzyme production plays a crucial role in enzyme production, with early-stage colonizers like Burkholderiales driving hydrolysis and later dominance of Acetobacteraceae promoting acidogenesis.5 Yeast inoculation, while preparation particularly with S. cerevisiae, is known to accelerate sugar metabolism, lower pH more rapidly, and enhance anaerobic conditions factors that can significantly shorten fermentation time and potentially boost enzyme yield.21 Therefore as standardized above Saccharomyces cerevisiae mediated bioenzyme production has faster organic substrate breakdown activity and synergistically with natural microflora of peels the bioenzyme produced have shown higher activity of laccase and cellulase enzyme which can be due to presence of predominately Pseudomondata group on the peels which can utilize sweet lemon peels as substrate for enzyme production and create favorable conditions for other gram positive bacteria to colonize and produce multienzyme solution called as bioenzyme.
Further, FT-IR analysis of the validated bioenzyme produced after RSM revealed key functional groups. More peaks and better compounds production was reported in our study as compared to non-yeast mediated production. A broad absorption band around 3400–3200 cm⁻¹ indicated O–H and N–H stretching, typical of hydroxyl groups in alcohols, carboxylic acids, polysaccharides, and primary amines, suggesting strong hydrogen bonding in complex biomolecules like proteins and carbohydrates.22,23 Sharp peaks near 2850 cm⁻¹ were attributed to C–H stretching of alkyl chains from lipids and fatty acids. A distinct peak at 1740 cm⁻¹ confirmed carbonyl (C=O) groups, associated with esters, carboxylic acids, aldehydes, and ketones formed during fermentation. Peaks between 1600–1500 cm⁻¹ indicated C=C stretching, suggesting the presence of alkenes and aromatic compounds such as flavonoids and polyphenols. In the fingerprint region (<1500 cm⁻¹), peaks at 1200–1000 cm⁻¹ corresponded to C–O stretching, typical of carbohydrates, glycosidic bonds, and cellulose derivatives, while C–H bending between 700–500 cm⁻¹ confirmed aromatic structures.22
Several studies have demonstrated the effectiveness of bioenzymes through FT-IR analysis. In the production of nanocellulose, bioenzyme pretreatment FT-IR results confirmed that utilizing varying ratios of bioenzymes enhanced the cleavage of cellulose-1,4 bonds more efficiently than the use of a single enzyme.24 Likewise, FT-IR analysis of bioenzyme-treated old corrugated containers showed that pretreatment improved energy efficiency by promoting greater fiber swelling and inter-fiber bonding.23 Overall, FT-IR spectral data confirmed the complex biochemical composition of bioenzymes, revealing characteristic functional groups such as hydroxyl, carbonyl, amide, and glycosidic linkages markers typically associated with polysaccharides, proteins, and organic acids. The detection of these functional groups underscores the enzymatic activity and biochemical versatility of bioenzymes, supporting their broad applicability in biocatalysis, bioenergy production, and environmental remediation.23
By validating the model and conducting FT-IR analysis, the optimized conditions for sweet lemon-based bioenzyme production demonstrated desirability of 0.97 and when standardized against non yeast mediated sweet lemon bioenzyme production as the desirable model for yeast mediated bioenzyme production as desirability is near to 1 indicating the effectiveness of the optimized production parameters considered valid for enhanced bioenzyme production which can have applications in various industries as leather and textile industries due to presence of high cellulase and laccase activity and low pH. Further due to the presence of acidic pH and high enzymatic contents and less preparation time bioenzyme prepared can be utilized in pretreatment processes of bioremediation and bioenergy production.
Conclusion
This study demonstrated that sweet lemon (Citrus limetta) peel waste can be effectively utilized for the accelerated production of bioenzyme and in the study through RSM, the fermentation period was significantly reduced from the conventional 90 days to 40 days through the use of Saccharomyces cerevisiae and previous bioenzyme inoculum. The optimized conditions 25.36% jaggery, 20% previous bioenzyme inoculum, 2% yeast culture, and a 40-day fermentation period yielded low pH, reduced days of settling and high cellulase and enzymatic activities. These values substantially outperformed the non-yeast-mediated prepared bioenzyme in enhancing microbial activity and fermentation efficiency.
The findings highlight the potential of a low-cost, rapid, and sustainable approach for bioenzyme production using fruit waste, with applications in waste management. However, further research is needed to assess the long-term stability, field performance, and microbial dynamics of the optimized bioenzyme under real-world conditions. Further investigations should be conducted on investigating the long-term storage stability and shelf-life of optimized bioenzyme formulations and the microbial community structure during different fermentation stages using metagenomics. The industrial efficacy of the bioenzyme in soil health improvement, composting, biogas production or bioremediation under field conditions need to be explored and scale-up potential of bioenzyme in small bioreactors to validate the feasibility for decentralized waste management systems need to be studied.
Acknowledgement
The authors are thankful to Punjab Agricultural University, Ludhiana, India and ICAR-AICRP for providing the necessary research facilities.
Funding Sources
This research work was supported and funded by the financial support provided by ICAR under All India Coordinated Research Project on “Upscaling Bioenzymes Production from Organic Waste and its use for Enhancing Biogas Generation” on grant no. LDH/EAAI/DRET-BCT/2023/1, New Delhi, India for carrying out this work.
Conflict of Interest
The authors do not have any conflict of interest.
Data Availability Statement
All data utilized in the analysis are available upon request from the authors.
Ethics Statement
This research does not involve human participants, animal subjects, or any other material that requires ethical approval.
Informed Consent Statement
This study did not involve human participants, and therefore, informed consent was not required.
Clinical Trial Registration
This research does not involve any clinical trials.
Permission to Reproduce Material from Other Sources
Not Applicable
Author Contributions
- Harmandeep Kaur: Investigation, Data collection and Original draft preparation
- Urmila Gupta Phutela: Conceptualization and quality improvement of the manuscript, Funding acquisition
- Yashika Aggarwal: Writing–Review and Editing.
- Karvembu Palanisamy: Data analysis and Manuscript formatting
- Iqbal Singh: Visualization and Manuscript formatting
References
- Younis K., Ahmad S., Osama K., et al. Optimization of de-bittering process of mosambi (Citrus limetta) peel: Artificial neural network, Gaussian process regression and support vector machine modeling approach. Food Process Eng. 2019; 42(6):e13185. DOI: https://doi.org/10.1111/jfpe.13185
CrossRef - Dubey P., Tripathi G., Mir S.S., et al. Current scenario and global perspectives of citrus fruit waste as a valuable resource for the development of food packaging film. Trends Food Sci. Technol. 2023;141:104190. DOI: https://doi.org/10.1016/j.tifs.2023.104190
CrossRef - Maqbool Z., Khalid W., Atiq H.T., et al. Citrus waste as a source of bioactive compounds: extraction and utilization in health and food industry. Molecules. 2023;28(4):1636. doi: https://doi.org/10.3390/molecules28041636
CrossRef - Barman I., Hazarika S., Gogoi J., et al. A Systematic Review on Enzyme Extraction from Organic Wastes and its Application. Biochem. Technol. 2022;13(3):32-37. DOI: https://doi.org/10.51847/JVfUPnKi16
CrossRef - Sehair N., Ahmed I., Khalid N. Isolation and Identification of Microbial Communities from Citrus limetta Food Saf. Health. 2025;1–11. DOI: https://doi.org/10.1002/fsh3.70018
CrossRef - Kurniawan A., Mustikasari D., Muntoro S.J., et al. The Preliminary Study about Physico-Chemical Property of Bio-enzyme Produced from Orange Fruits Waste Treated with Different Concentrations of Probiotic. J Ilmu Lingkungan. 2024;22(4):861-867. DOI: https://doi.org/10.14710/jil.22.4.861-867
CrossRef - Kurniawan A., Mustikasari D., Kurniawan A., et al. Short communication: taxonomic profiling of bacteria in the bio-enzyme produced from orange fruit waste. Al-Kauniyah J Biol. 2025;18(1):91–99. DOI: https://doi.org/10.15408/kauniyah.v1i1.36711
CrossRef - Lima C.A., Contato A.G., de Oliveira F., et al. Trends in enzyme production from citrus by-products. Processes. 2025;13(3):766. DOI: https://doi.org/10.3390/pr13030766
CrossRef - Joshi V.S., Gupta S.M. Production of bio enzyme from kitchen waste by anaerobic fermentation using mixture of yeast and fungal culture. World J Pharm Sci. 2023;12(8):1137–1141. DOI: https://doi.org/10.20959/wjpps20238-25475
- Thakiyal S., Bhatia S., Kaur C., et al. Bioenzyme mediated hydrodistillation (BMHD) for extraction of mint oil from mentha leaves: improvement in yield and menthol content. Biosyst. Eng. 2024;47(9):1471-1482. DOI: https://doi.org/10.1007/s00449-024-03041-0
CrossRef - Dar R.A., Gupta R.K., Phutela U.G. Enhancement of euryhaline Asterarcys quadricellulare biomass production for improving biogas generation through anaerobic co-digestion with carbon rich substrate. 3 Biotech 2021;11(5):251. DOI: https://doi.org/10.1007/s13205-021-02792-x
CrossRef - Arun C., Sivashanmugam P. Study on optimization of process parameters for enhancing the multi-hydrolytic enzyme activity in garbage enzyme produced from preconsumer organic waste. Bioresour Technol. 2017;226:200-210. DOI: https://doi.org/10.1016/j.biortech.2016.12.029
CrossRef - Lakshmi Tulasi D.D., Tallapudi D.P., Guduri V.R., et al. A brief study and analysis of bio-enzyme based on natural product. World J Pharm Life Sci. 2024;10(8):102-107.
- Patel B.S., Solanki B., Mankad A.U. Effect of eco-enzymes prepared from selected organic waste on domestic wastewater treatment. World J. Adv. Res. Rev. 2021;10(1):323-333. DOI: https://doi.org/10.30574/ wjarr.2021.10. 1.0159
CrossRef - Miller G.J. Use of Dinitrosalicylic Acid Reagent for Determination of Reducing Sugars. Chem. 1959;31(3):426-428. DOI: https://doi.org/10.1021/ac60147a030
CrossRef - Yadav D. Engineering of small laccase (SLAC) from Streptomyces coelicolor for application in biocatalysis and surface functionalisation [dissertation]. Durban, South Africa: Durban University of Technology; 2021. Accessed April 21, 2025. Available online: https://hdl.handle.net/10321/3786
- Kadiroğlu, P. FTIR spectroscopy for prediction of quality parameters and antimicrobial activity of commercial vinegars with chemometrics. Sci. Food Agric. 2018;98(11), 4121-4127. DOI: https://doi.org/10.1002/jsfa.8929
CrossRef - Olabinjo O.O. Citrus peels: an effective source of bioactive compounds. Waste Manag Sustainable Future. 2025;4. DOI: https://doi.org/10.5772/intechopen.1004330
CrossRef - Gumilar G.G., Kadarohman A., Nahadi N. Ecoenzyme Production, Characteristics and Applications: A Review. Kartika Kimia. 2023;6(1):45-59. DOI: https://doi.org/10.26874/jkk.v6i1.18
CrossRef - Rasit N., Fern L.H., Ghani W.A.W.A.K. Production and Characterization of Eco Enzyme Produced from Tomato and Orange Wastes and its Influence on the Aquaculture Sludge. Int J. Civ. Eng. Technol. 2019;10(3):967-980. DOI: http://www.iaeme.com/ijciet/issues.asp?JType=IJCIET&VType=10&IType=03
- Yuan X., Wang T., Sun L., et al. Recent advances of fermented fruits: A review on strains, fermentation strategies, and functional activities. Food Chem.: X. 2024;22:101482. DOI: https://doi.org/10.1016/j.fochx.2024.101482
CrossRef - Phutela U.G., Arora R., Kumar A., et al. Potential Use of Mosambi Peel-Based Bioenzymes for the Wound Management in Animals. Indian J Anim Reprod. 2025;46(1):61-67. DOI: https://doi.org/10.48165/ijar.2025. 46.01.10
CrossRef - Wu X., Yuan X., Zhao J., et al. Study on the effects of different pectinase/cellulase ratios and pretreatment times on the preparation of nanocellulose by ultrasound-assisted bio-enzyme heat treatment. RSC Adv. 2023;13(8):5149-5157. DOI: https://doi.org/10.1039/D2RA08172E
CrossRef - Li D., Wan J., Ma Y., et al. Study on the use of bioenzymes for pre-treatment to improve the refining performancee of old corrugated container. Biomass Convers. Biorefin. 2025;15(2):2687-2698. DOI: https://doi.org/10.1007/s13399-023-05002-1
CrossRef
Accepted on: 03 Sep 2025
Second Review by: Jantima Teeka
Final Approval by: Dr. Cheng Lai Hoong


Web of Science Coverage
Emerging Sources Citation Index (ESCI)
2024 Journal Impact Factor: 1.1
Scopus Journal Metrics
CiteScore 2024: 1.9
CiteScore Details
Sustainable Nutrition: Food Systems, Nutrient Retention, and Public Health Impact
![]()
This journal is a member of, and subscribes to the principles of, the Committee on Publication Ethics (COPE)


