Food Portion Size Estimation Skill Among Post Graduate Dietetics Students
 , Vidisha Sharma, Anjani Bakshi and Ravinder Chadha
 Department of Food and Nutrition, Lady Irwin College, University of Delhi, New Delhi, India
Corresponding Author Email: shally.sharma303@gmail.com
Download this article as:
ABSTRACT:Accuracy in food portion size estimation is essential for precise diet assessment and relevant nutrition counselling in dietetic practice. The study assessed food portion size estimation skill of post graduate dietetics students (n=54) selected purposively from three government institutions of Delhi, India. Students estimated pre-weighed portion sizes of 40 food items (raw and cooked) from different food categories and food types (amorphous, solid and liquid) in terms of household utensils and/or food exchanges. A total of 3240 portion size estimations were made by the students. Statistically significant difference in estimated and actual portion size was observed in 80% of the food items (p<0.05). Mean percent absolute error observed across all food categories when food items were estimated using food exchanges was 44.7±62.4% and using household utensils was 27.77±26.66%. Across all food categories, highest estimation error was observed for fruit juice (79.5±43.2%, when estimated using household utensils) and salads (74.9±87.3%, when estimated in terms of food exchanges). Lowest estimation error was observed for vegetables (23.7±66.3%, when estimated in terms of food exchanges and 18.0±19.19% using household utensils). Majority (87.5%) of the food items had >25% error when estimated using food exchanges while in terms of household utensils 45% of the items exceeded this much error. Mean percent absolute error was observed to be significantly lower when food items were estimated using household utensils than food exchanges (p<0.05). There is a need for improving portion size estimation skill among dietetics students through training.
KEYWORDS:Diet; Dietary Assessment; Dietetics; Food; Portion Size; Portion Size Estimation
Introduction
Accurate assessment of dietary intake is required not only for prevention of diseases and health promotion but also for nutritional surveillance and evaluation of nutritional status of patients in clinical and public health settings.1,2 Precise measurement of dietary intake of populations is essential to assess and monitor the composition and quality of their diets, to investigate diet-health relations among them as well as to formulate food, nutrition, and agricultural policies and programmes.3
National level surveys like National Health and Nutrition Examination Survey (NHANES) in United States4 and National Food Consumption Survey (NFCS) in South Africa record dietary information in terms of portion sizes as a part of 24 hour dietary recall or food records.5,6 Dietary assessment methods like food records, 24-hour dietary recalls, and food frequency questionnaires etc., obtain data on consumption of food portions usually in terms of standardized utensils, household utensils, calibrated food models or by use of standardized portion sizes for a population group. This involves collecting dietary data followed by manual coding and entry of information into the database. All these are subject to errors that can influence overall accuracy of diet assessment.7-10 The important sources of error in diet assessment studies include, incomplete recall of food items eaten, incorrect description of food items, inaccurate estimation of food portion sizes, and inclusion of extraneous food items. Out of these, errors associated with quantification of portion size are found to be the largest of all measurement errors in dietary assessment.3,11-13
Problems in visually estimating food quantity can be due to poor conceptualization, poor food portion size estimation skill and difficulty in retrieval of dietary information from memory.14 Estimating the amount of food consumed is a complex cognitive task which involves attention, perception, organization, retention, retrieval and formulation of response.15
Dietary assessment is best done by a trained and experienced dietitian who plays a decisive role in accurate estimation of food portion sizes while recording dietary intake of patients.16 Dietitians use portion size estimation aids (PSEAs) to help estimate accurate portion size.14,17 Food portion size estimation can be facilitated by using a range of tools, including line drawings, 2-dimensional food images, measuring spoons and cups, food models, and reference objects like a packet of playing cards.18 Data on food portion size estimation aids for Asian food are very limited with household utensils still playing an important role in clinical practice and large-scale surveys.19 Effective education about food portion sizes and how these compare to recommendations is a fundamental skill of nutrition practitioners.8 Dietitians have duties for planning, educating, supervising and evaluating clinically devised eating plans to restore the patient to functional nutritional health.20,21 If food portion sizes are estimated incorrectly, the estimations of calories and other nutrients will also be incorrect.6 Therefore, it is very important for the diet practitioners to estimate food portion sizes accurately.
The purpose of this study was to assess the food portion size estimation skill among students pursuing post graduate diploma in dietetics using food exchanges and household utensils.
Materials and Methods
Sample
A sample of 54 female students pursuing post graduate diploma in dietetics was selected from three Government institutions of Delhi, India, using purposive sampling technique. These students were enrolled in one year diploma course in dietetics and had not done any internship in this area. Informed written consent was obtained from all the students who agreed to participate.
Selection of food items
Food items from different food categories, i.e., cereals, pulses etc. and different food types i.e., amorphous (e.g. aloo matar curry, rice kheer etc.), solid (e.g. chapati, apple etc.) and liquid (e.g. milk, orange juice) were selected for assessing food portion size estimation skill. The selection was based on food items commonly consumed by urban adults or adolescents in Delhi and were identified from Master’s dissertation work on dietary assessment among these population groups conducted at Food and Nutrition Department from one of the colleges included in the target sample group.22-27
The selected food items (n=40) were categorized into eleven food categories: cereals (n=6), pulses (n=4), vegetables (n=5), fruits (n=3), milk and milk products (n=5), meat (n=1), fruit juice (n=1), snacks (n=3), salads (n=6), nuts and oil seeds (n=3) and sugars (n=3). They were also classified as solid (n=16), amorphous (n=22) or liquid (n=2) depending on their nature and the way they were presented for estimation. All food portions were presented in the form they are commonly consumed in either see through plates, bowls or glasses (in case of liquids). The presentation and nature of all the selected food items is given in Table 1 and a brief description is provided in Supplementary Material 1.
Tools and techniques
Household utensils (glasses, bowls, ladles and spoons) of different capacities, food models, salted replicas (standardized food preparations in which excessive amount of salt is added as a preservative, so that these can be stored and reused for display) and food items (raw or cooked) were used. Participants recorded their responses in a proforma.
Standardization of recipes
Recipe standardization was done by preparing the recipes using measured raw ingredients and then weighing the recipe yield after transferring it to an appropriate utensil (in terms of which it was to be estimated by the students). The capacities of various utensils were measured by filling them with water (0.5 cm below brim for bowls, 1 cm below brim for glasses, and up to the brim for spoons and ladles), transferring the water to a measuring cylinder and noting the volume.
Raw food items (like fruits and nuts) were weighed directly on the weighing scale. Liquids were measured using a measuring cylinder. Food models (for chapati and paneer) and salted replica (for plain paratha) were also prepared and used throughout the entire data collection period. In case of cooked preparations (such as rajmah curry, bhindi dry, rice kheer etc.), the recipe yield (i.e. the final amount of cooked food) as well as the quantity of cooked food item in appropriate serving utensils (e.g. bowls and ladles) was weighed on a digital food weighing scale (Bulfyss brand, model number YS-900).
Assessment of food portion size estimation skill
Pre weighed food items (raw or cooked preparations) as well as a standardized set of utensils were displayed in front of the participants. They were asked to estimate the quantity of food items displayed, in terms of household utensils and/or food exchange amounts (as per the food exchange list used in their institutions) and record their responses in the proforma provided. Food exchange list is a collection of similar food items categorized in different exchange groups such as cereals, milk, meat, vegetables, fat etc. The food items within an exchange group contribute the same amount of any one of the macronutrients (protein, carbohydrate or fat). Using these lists, food items within a particular exchange group can be interchanged for planning of diets providing ease and flexibility in calculation.28-30 Food exchange lists used at two institutions were similar, while there were minor variations in the exchange list of the third institution. These differences between the food exchange lists of the three institutions were considered while computing the error in estimation of food portion sizes.29,31,32
Each household utensil used for portion size estimation had a code written on it which the participant reported, and for food exchanges they mentioned the number of exchanges in terms of raw food item while estimating the quantity displayed. For estimation of orange juice in exchanges, the number of oranges that will make up the shown volume of juice was asked.
Table 1: Presentation and nature of food items displayed for food portion size estimation
|
Food category |
Food item | Presentation |
Nature |
|
Cereals |
Chapati1, Plain paratha, Sandwich, Biscuits and rusk | Full Plate | Solid |
| Boiled Rice | Full Plate |
Amorphous |
|
|
Pulses |
Red gram dal (V1 and V2)2 and Rajmah curry (V1 and V2) | Bowl | Amorphous |
| Vegetables | Aloo matar curry, Bhindi dry, Aloo methi dry, Spinach saag, Mixed vegetable dry | Bowl |
Amorphous |
| Boiled potato (whole) | Quarter Plate | Solid | |
|
Milk and milk products |
Milk | Glass | Liquid |
| Paneer (Cottage cheese)1 | Quarter Plate |
Solid |
|
|
Curd, rice kheer and broken wheat porridge |
Bowl | Amorphous | |
| Meat | Chicken curry | Bowl |
Amorphous |
|
Fruit juice |
Orange juice | Glass | Liquid |
| Snacks | Bread pakora, mathri and samosa | Quarter Plate |
Solid |
|
Fruits |
Apple, Banana | Whole fruit on quarter plate | Solid |
| Papaya | Cubes on quarter plate |
Amorphous |
|
|
Salad |
Onion and Tomato | Round slices on quarter plate | Amorphous |
|
Cucumber and Carrot |
2” long pieces on quarter plate |
Amorphous |
|
| Mixed Salad (sprouts, finely chopped onion and tomato) | Bowl |
Amorphous |
|
|
Nuts and oil seeds |
Almonds, cashewnuts and peanuts (without shell) | Bowl | Solid |
| Sugars | Granulated sugar | Bowl |
Amorphous |
|
Jaggery |
Bowl | Solid | |
| Jam | Bowl |
Amorphous |
In case of chapati and paneer (cottage cheese), real size food models made of cardboard and thermocol, respectively, were used. For plain paratha, a salted replica was made. For all the other food items, real food samples were used.
V1 and V2 are variations in consistency, V1 is thick consistency of preparation and V2 is relatively thinner consistency of the preparation.
(Brief description of food preparations in Table 1 are given in supplementary material-1)
Each student made 20 estimations in terms of household utensils and 40 in terms of food exchanges (household utensils, n= 20 x 54= 1080 observations and food exchanges, n= 40 x 54= 2160 observations, 3240 observations in total) during two sessions of 15-20 minutes each. Students were not allowed to interact or discuss with each other while estimating portion sizes to avoid bias.
Statistical Analysis
Data were entered and analyzed using Microsoft Excel 2013 and IBM SPSS v.25. Responses given by participants in household utensils and number of food exchanges were converted into grams. Absolute difference in estimation was calculated for each participant by subtracting the actual quantity of food displayed from the quantity the participant had estimated. The resulting value was taken as positive (+) for absolute difference.
Absolute difference in estimation (g or ml) = |Estimated Quantity (g or ml)* – Actual Quantity (g or ml)|
*Quantity estimated by the participant in exchanges or household utensils (it was converted into ml for liquids)
Absolute percentage error in the estimation of food portion sizes was also calculated for each food item:
Absolute percentage error in estimation (%) = Estimated Quantity (g or ml)* – Actual Quantity (g or ml) x 100
Actual Quantity (g or ml)
Error in estimation was calculated for each food category and also separately for various items within the food categories. One Way Analysis of Variance (ANOVA) was used to check the difference in the mean estimation error between and within the food categories. Wherever ANOVA indicated a significant difference, post hoc analysis was done using Fisher’s Least Significant Difference (LSD) test. Wilcoxon signed rank test was used to assess significance of difference between actual and estimated food portion sizes. Differences in mean absolute error percentage for same food item, estimated using household utensils and food exchanges was compared using paired t test. Error was also calculated for different types of food items (solid, amorphous and liquid) and the difference between them was compared using ANOVA or independent t-test.
Results
The present study aimed to assess errors in food portion size estimation by students pursuing post graduate course in dietetics from three government institutions in Delhi, India. The mean age of the participants was 21.4±2.6 years (range 20-25 years). A total of 3240 observations were made by the students. Results indicated that 80% of the food items (32 out of 40) were significantly inaccurately estimated when compared to their actual amounts (in grams) using food exchanges.
The mean absolute error percentage for all the items estimated in terms of food exchanges was 44.7±62.4% (Table 2). A statistically significant difference in mean percent absolute error was observed across food categories (n=9) (F=19.68, p=0.00) (Post hoc comparison across the food categories with significantly different mean absolute estimation error is given in Table 1 of supplementary material- 2). The highest error percentage was observed in salads (74.9±87.33%) while least in vegetable preparations (23.7±66.3%) (Table 2). Onion salad had the highest estimation error (125±104.9%) among all the food items.
The mean absolute error percentage in estimation for 17 food items (out of 40 items) was more than 50% while 33 items had more than 30% error, for food exchanges. Post hoc analysis revealed that food portion size estimations were significantly different for some food items (mentioned in Table 3) such as within cereals (F=5.779), pulses (F=15.356), vegetables (F=14.094), salads (F=11.94), snacks (F=3.188) and sugars (F=24.498) (p<0.05). A significantly higher error in estimation was observed for some amorphous food items as compared to solid food items, such as boiled rice compared to chapati (p=0.000); boiled whole potato compared to aloo matar curry (p=0.045) or dry vegetable preparations such as spinach saag (p=0.001) or bhindi dry (p=0.011). Participants also faced difficulty in estimating liquid items (milk and fruit juice). Higher error was observed in estimation of food items containing multiple ingredients like bread pakora (57.8±76.1%) and mixed salad (69.3±94.5%).
Table 2: Food portion size estimation error observed in various food categories using food exchanges (n=54)
|
Food Categories |
Absolute error percentage for food items in each food category (Mean±SD1 ) | Absolute error percentage for food category (Mean±SD)2 |
| Cereals | Chapati (12.6±27.5); Plain paratha (33.7±20.7); Sandwich (43.3±75.7); Boiled rice (54.5±19.3); Biscuits (58.3±73.7); Rusk (65.3±60.0) |
44.2±60.62 |
|
Pulses |
Red gram dal V1 3 (20.4±34.0); Red gram dal V2 (24.5±33.1); Rajmah curry V2 (32.4±18.4); Rajmah curry V1 (66.1±59.0) | 35.9±42.7 |
| Vegetables | Boiled potato, whole (14.6±27.0); Aloo methi dry (29.7±34.4); Aloo matar curry (35.9±31.3); Bhindi dry (41.8±50.2); Mixed vegetable dry (42.5±96.4);
Spinach saag (57.2±21.1) |
23.7±66.3 |
|
Milk and milk products |
Milk (38.9±54.7); Broken wheat porridge (41.7±37.4); Paneer (46.6±21.1); Rice kheer (47.8±38.1); Curd (60.6±69.0); | 46.5±44.8 |
| Meat | Chicken curry (29.9±33.9) |
29.9±33.9 |
|
Fruit juice |
Orange juice (55.5±23.4) | 55.5±23.4 |
| Snacks | Mathri (31.9±29.0); Samosa (47.0±62.3); Bread pakora (57.8±76.1) |
49.9±67.2 |
|
Fruits |
Banana (47.0±17.2); Apple (48.4±10.3);
Papaya (50.7±46.0) |
48.7±28.9 |
| Salad | Cucumber (20.4±30.7); Mixed salad (69.3±94.5); Carrot (96.5±86.1); Onion (125±104.9), Tomato (74.1±39.7) |
74.9±87.3 |
|
Nuts and oil seeds |
Almonds (45.1±28.2); Cashewnuts (51.4±74.4); Peanuts (55.6±73.8) | 50.7±62.4 |
| Sugars | Granulated sugar (38.4±21.6); Jaggery (56.6±20.0); Jam (62.8±14.1) |
52.6±21.4 |
|
Total (all food categories) |
44.7±62.4 |
|
SD= Standard deviation
F=19.68, p=0.00 as per one-way ANOVA (between food categories)
V1 and V2 are variations in consistency of pulses, V1 is thick consistency of preparation and V2 is relatively thinner consistency of the preparation.
Note. Statistically significant difference was observed between the actual portion sizes of food items (in grams) shown to the participants and those estimated by them using food exchanges (converted into gram equivalents) for 32 food items using Wilcoxon signed rank test (z value ranging from -6.214 to -5.767) (p<0.05). 0+-(Post hoc analysis across the food categories is given in Table 1 of supplementary material-2)
Table 3: Post hoc comparison of the food items within food categories having significant difference in mean absolute estimation error percent (using food exchanges)
|
Food Category |
Food item | Food item | Significance value1 |
|
Cereals |
Chapati |
Boiled rice | 0.000 |
| Vegetable sandwich |
0.001 |
||
| Biscuit |
0.000 |
||
|
Rusk |
0.000 |
||
| Plain paratha | Biscuit |
0.031 |
|
|
Rusk |
0.006 |
||
|
Vegetable sandwich |
Rusk |
0.018 |
|
|
Pulses |
Red gram dal V1 | Rajmah curry V1 | 0.000 |
|
Red gram dal V2 |
Rajmah curry V1 |
0.000 |
|
| Rajmah curry V1 | Rajmah curry V2 |
0.000 |
|
|
Vegetables |
Aloo matar curry |
Spinach saag | 0.044 |
|
Mixed vegetable |
0.000 |
||
| Boiled potato (whole) |
0.045 |
||
|
Bhindi dry |
Mixed vegetable | 0.000 | |
| Boiled potato (whole) |
0.011 |
||
|
Aloo methi dry |
Spinach saag | 0.009 | |
| Mixed vegetable |
0.000 |
||
|
Spinach saag |
Mixed vegetable | 0.009 | |
| Boiled potato (whole) |
0.001 |
||
|
Salad |
Cucumber |
Onion | 0.000 |
|
Carrot |
0.000 |
||
| Tomato |
0.001 |
||
|
Mixed salad |
0.000 |
||
|
Onion |
Tomato | 0.001 | |
| Mixed salad |
0.000 |
||
|
Carrot |
Mixed salad | 0.037 | |
| Snacks | Bread pakora | Mathri |
0.014 |
|
Sugars |
Granulated sugar |
Jaggery | 0.000 |
| Jam |
0.000 |
1Significance values as per Fisher’s Least Significant Difference (LSD) test.
Mean absolute error percentage across all the food categories was 27.77±26.66% for 20 items which were estimated using household utensils (Table 4). Significant difference in food portion size estimation was observed across the nine food categories using household utensils (F= 44.08, p<0.05) (Post hoc comparison across the food categories with significantly different mean absolute estimation error is given in Table 2 of supplementary material- 2). The maximum estimation error was observed in fruit juice (79.5±43.2%) while minimum was in case of vegetables (18.0±19.19%). Significant differences in food portion size estimation were also observed within food category in case of pulses (F=15.794) and milk and milk products (F=1.361) using one-way ANOVA (p<0.05). (Post hoc analysis of food items with significantly different mean absolute estimation error within the food categories is given in Table 3 of supplementary material 2).
When ranked on the basis of mean absolute error percentage (highest to lowest), it was observed that seven food items among the top ten, estimated using food exchanges were amorphous. For these items, mean estimation error was observed to be more than 60% (77.01±80.37%). The mean absolute error percentage was observed to be less than 35% (23.26±30.67%) for solid food items such as chapati, boiled potato (whole), mathri and plain paratha, thus indicating higher error in estimation of amorphous food items when compared to solid items. A significantly higher error in estimation was observed for liquid food item as compared to amorphous food items, such as, milk compared to curd (p=0.000), rice kheer (p=0.000) or broken wheat porridge (p=0.000) when estimated using household utensils.
Table 4: Food portion size estimation error observed in various food categories using household utensils (n=54)
|
Food Categories |
Absolute error percentage for food items in each food category (Mean±SD1 ) |
Absolute error percentage for food category (Mean±SD2) |
| Cereals | Boiled rice (41.1±17.6) |
41.1±17.6 |
|
Pulses |
Rajmah curry V23 (15.1±17.3); Rajmah curry V1 (15.6±16.0); Red gram dal V1 (30.1±16.4); Red gram dal V2 (31.4±16.1) |
23.0±18.1 |
|
Vegetables |
Bhindi dry (14.6±24.8); Aloo methi dry (14.9±18.8); Spinach saag (18.1±19.9); Mixed vegetable dry (20.7±13.3); Aloo matar curry (21.8±16.8) | 18.0±19.19 |
| Milk and milk products | Broken wheat porridge (16.8±31.8); Rice Kheer (20.9±34.4); Curd (25.9±17.1); Milk (52.0±21.6) |
28.9±30.3 |
|
Meat |
Chicken curry (21.6±20.8) | 21.6±20.8 |
| Fruit juice | Orange juice (79.5±43.2) |
79.5±43.2 |
|
Fruits |
Papaya (22.6±20.9) | 22.6±20.9 |
| Salad | Mixed salad (30.4±23.5) |
30.4±23.5 |
|
Sugars |
Jam (30.4±7.3); Granulated sugar (31.9±17.8) |
31.1±13.6 |
|
Total (all food categories) |
27.77±26.66 |
|
SD= Standard deviation
F= 44.08, p=0.00, as per one-way ANOVA between food categories
V1 and V2 are variations in consistency of pulses, V1 is thick consistency of preparation and V2 is relatively thinner consistency of the preparation
Some food items were estimated using food exchanges as well as household utensils (n=20). The mean absolute error percentage in estimation using household utensils was significantly lower than food exchanges for 14 out of 20 food items (p<0.05) (Figure 1).
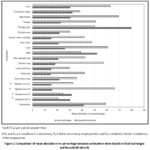 |
Figure 1: Comparison of mean absolute error percentage between estimations done based on food exchanges and household utensils |
Discussion
The present study aimed to assess errors in food portion size estimation by students pursuing post graduate course in dietetics from three government institutions in Delhi, India. Of the forty food items displayed, majority were inaccurately estimated by the students using either household utensils or food exchanges.
Significant error was observed across food groups when items were estimated using food exchanges. Similar results have been observed in other studies where the accuracy of estimates varied between different food groups.Highest error in estimation was observed for salad items amongst all the food groups. The amorphous nature of salad items (displayed as slices or rounds) may be the reason behind the difficulty faced by participants in correctly estimating the quantities. Wenhold and Mclntyre also mentioned that amorphous food is particularly challenging to estimate accurately in terms of portion size. It shows that the irregular, shapeless nature of these food leads to greater errors when individuals try to visually estimate portions without aids. They when used bean bags to mimic the volume and amorphous form of such food, the accuracy of portion size estimation improved suggesting use of appropriate portion size estimation aid for accuracy.34
Inaccurate estimation of food portion sizes leads to systematic error.35 In a study on validation of a food quantification picture book involving adolescent and adult participants, >25% error in estimation of food portion sizes had been considered unacceptable.36 In the present study, when categorized based on error percentage, majority of the food items estimated using food exchanges had >25% error (n=35). Out of those, 17 items had >50% error in estimation of food portion size. However, when estimated using household utensils, nine items had >25% error and only two items had >50% error. However, as these results pertain to food portion size estimation by dietetics students who are being trained for planning and preparation of normal and therapeutic diets, this magnitude of error in food portion size estimation is undesirable.
Mean absolute estimation error of all the solid food items when compared with all the amorphous/liquid food items, no statistically significant difference was observed between items estimated using household utensils. Food portion size estimations are likely to be affected by the nature of food. Studies on estimation of food portion sizes have observed that amorphous food items are less accurately estimated than solid and liquid items, as also observed in our study.8,37,38
As future dietitians, students pursuing dietetics course will be involved in assessing, planning and modifying diets of their patients. Therefore, they should have the ability to accurately visualize the amounts of food items in terms of food exchanges and do quick portion size assessment and calculations of constituent nutrients. There is a need for training to improve familiarization of food exchange amounts by direct observation and hands on training which includes weighing, estimation and standardization of recipes of various food items.8,39,40 This can also be facilitated by the use of various food portion size estimation aids and software available.41-44 Studies have shown that training can help in reducing portion size estimation errors.9,40,42,44-46
Strengths and Limitations
A key strength of the present study is that, no similar work has been conducted in India involving postgraduate-level dietetics students, who are going to be future dieticians. Additionally, the food items included in the study were reflective of those commonly consumed among North Indian population groups and covered a range of physical forms- liquid, amorphous, and solid- thereby enabling assessment of the students’ skills in estimating portion sizes across food items of different nature. However, a limitation of the study is the relatively small sample size, which may restrict the generalizability of the findings. The study provides valuable baseline evidence that can guide future research, training of dietetic students, and uniform nutrition education strategies in similar populations.
Conclusion
Accurate estimation of food portion size is a fundamental skill for dietitians for effective diet assessment, planning and nutrition counselling. The findings of this study showed that dietetic students estimated food portion sizes using household utensils more accurately than when using food exchanges. Therefore, there is a need to improve food portion size estimation skill among students pursuing dietetics course. A few practical exercises focused on food portion size estimation skill especially using household utensils can be an important component of the curriculum for dietetics students as it may enhance the estimation accuracy among them. There is also a need for further research on the effect of training using different portion size estimation aids on food portion size estimation skill of dietetics students.
Acknowledgement
The authors are thankful to the Department of Food and Nutrition, University of Delhi and Institute of Hotel Management, Pusa, New Delhi, India for permitting us to conduct research at their institutes.
Funding Sources
The author(s) received no financial support for the research, authorship, and/or publication of this article.
Conflict of Interest
The authors do not have any conflict of interest.
Data Availability Statement
The manuscript incorporates all datasets produced or examined throughout this research study.
Ethics Statement
Ethical approval was taken from Institutional Ethics Committee of Lady Irwin College, University of Delhi, India.
Informed Consent Statement
The informed consent was obtained for experimentation and that it conforms to the standards currently applied in the country of origin. The privacy rights of human subjects must always be observed.
Clinical Trial Registration
This research does not involve any clinical trials.
Permission to Reproduce Material from Other Sources
Not applicable
Author Contributions
- Shally Sharma: Data collection, analysis, interpretation of results and content preparation of the manuscript.
- Vidisha Sharma: Conceptualization and designing of the study along with data analysis, interpretation of findings, critical review and finalization of the manuscript.
- Anjani Bakshi: Facilitation of data collection process, review of the content and finalization of the manuscript.
- Ravinder Chadha: Conceptualization and designing of the study, critical review and finalization of the manuscript.
References
- Bross R, Noori N, Kovesdy CP, et al. Dietary assessment of individuals with chronic kidney disease. Seminars in dialysis. 2010;23(4):359-364. doi: 10.1111/j.1525-139X.2010.00743.x.
CrossRef - Naska A, Lagiou A, Lagiou P. Dietary assessment methods in epidemiological research: current state of the art and future prospects. F1000Research. 2017;6. doi: 10.12688%2Ff1000research.10703.1.
CrossRef - Gibson RS, Charrondiere UR, Bell W. Measurement errors in dietary assessment using self-reported 24-hour recalls in low-income countries and strategies for their prevention. Adv Nutr. 2017;8(6):980-991. doi: 3945/an.117.016980
CrossRef - National Centre for Health Statistics. Centers for Disease Control and Prevention. National Health and Nutrition Examination Survey – Dietary. https://wwwn.cdc.gov/nchs/nhanes/continuousnhanes/questionnaires.aspx?BeginYear=2021. Accessed: 2021.
- Hebert JR, Hurley TG, Steck SE, et al. Considering the value of dietary assessment data in informing nutrition-related health policy. Advances in nutrition. 2014;5(4):447-455.
CrossRef - Young LR, Nestle M. Portion sizes in dietary assessment: issues and policy implications. Nutrition Reviews. 1995;53(6):149-158. doi: 1111/j.1753-4887.1995.tb01542.x.
CrossRef - Rogers B, Somé JW, Bakun P, et al. Validation of the INDDEX24 mobile app v. a pen-and-paper 24-hour dietary recall using the weighed food record as a benchmark in Burkina Faso. British Journal of Nutrition. 2022;128(9):1817-31. doi: https://doi.org/10.1017/S0007114521004700
CrossRef - Arroyo M, De la Pera CM, Ansotegui L, et al. A short training program improves the accuracy of portion-size estimates in future dietitians. Archivos Latinoamericanos De Nutricion. 2007;57(2):163-167.
- Schoeller DA. Limitations in the assessment of dietary energy intake by self-report. Metabolism. 1995;44:18-22. doi: 1016/0026-0495(95)90204-X
CrossRef - Plummer M, Clayton D. Measurement error in dietary assessment: an investigation using covariance structure models. Part I. Statistics in Medicine. 1993;12(10):925-935. doi:10.1002/sim.4780121004.
CrossRef - Baranowski T. 24-hour recall and diet record methods. In: W. Willet. Nutritional Epidemiology. 3rd United States of America: Oxford University Press; 2013:49-55.
CrossRef - Gibson RS. Measurement error in dietary assessment. In: Principles of nutritional assessment. 2nd edition. United States of America: Oxford University Press. 2005:105-113.
CrossRef - Jonnalagadda SS, Egan SK, Heimbach JT, et al. Fatty acid consumption pattern of Americans: 1987–1988 USDA nationwide food consumption survey. Nutr Res. 1995;15(12):1767-1781. doi: 10.1016/0271-5317(95)02046-2.
CrossRef - Nelson M, Haraldsdóttir J. Food photographs: practical guidelines I. Design and analysis of studies to validate portion size estimates. Public Health Nutr. 1998;1(4): 219-230.
CrossRef - Chambers IV, EDGAR, Godwin SL, et al. Cognitive strategies for reporting portion sizes using dietary recall procedures. J Am Diet Asso. 2000;100(8):891-897. https://doi.org/10.1016/S0002-8223(00)00259-5.
CrossRef - Donze LF, Cheskin LJ. Obesity Treatment. 2003;4232-4240.
CrossRef - Boushey CJ, Kerr DA, Wright J, et al. Use of technology in children’s dietary assessment. European Journal of Clinical Nutrition. 2009;63(S1):S50-S57.doi: 10.1038/ejcn.2008.65.
CrossRef - Hooper A, McMahon A, Probst Y. The role of various forms of training on improved accuracy of food-portion estimation skills: a systematic review of the literature. Advances in Nutrition. 2019;10(1):43-50. doi: 10.1093/advances/nmy060.
CrossRef - Thoradeniya T, De Silva A, Arambepola C, et al. Portion size estimation aids for Asian foods. Journal of Human Nutrition and Dietetics. 2012;25(5):497-504. doi: 1111/j.1365-277X.2012.01245.x.
CrossRef - Bednarczuk B, Czekajlo-Kozlowska A. Role of nutritional support provided by qualified dietitians in the prevention and treatment of non-communicable diseases. Roczniki Państwowego Zakładu Higieny. 2019;70(3). doi: 32394/rpzh.2019.0080.
CrossRef - Cuervo M, Brehme U, Egli IM, et al. Nutrition, dietetics and food sciences degrees across Europe. Annals of nutrition & metabolism. 2007;51(2):115-118. doi: 10.1159/000102102.
CrossRef - Singh P, Jaiswal N, Bhatia N. Nutritional profile of police personnel in Delhi in relation to lifestyle and occupational stress. Lady Irwin College, University of Delhi. 2016. [Unpublished Masters thesis]
- Anushree, Mathur P. Nutritional status of gainfully employed women and homemakers of Delhi belonging to middle income group. Lady Irwin College, University of Delhi. 2015. [Unpublished Masters thesis]
- Rathi K, Singh K. Assessment of nutritional status of police head constables in Delhi and development of a nutrition counselling aid. Lady Irwin College, University of Delhi. 2014. [Unpublished Masters thesis]
- Kochar N, Bhatia N. Assessment of overweight/obesity and associated factors among affluent adult women (26-35 years) in Gurgaon city. Lady Irwin College, University of Delhi. 2013. [Unpublished Masters thesis]
- Mahajan N, Singh K. Occupational stress, eating behaviour and weight status among women IT professionals and development of an audio-visual counselling aid. Lady Irwin College, University of Delhi. 2013. [Unpublished Masters thesis]
- Puri R, Raizada P. Assessment of BMI, diet pattern and sociodemographic factors in dysmenorrhic college going girls. Lady Irwin College, University of Delhi. 2013. [Unpublished MSc thesis].
- Martínez-Sanz JM, Menal-Puey S, Sospedra I, et al. Development of a sport food exchange list for dietetic practice in sport nutrition. Nutrients. 2020;12(8):2403. doi: 3390/nu12082403.
CrossRef - Lady Irwin College, University of Delhi. Technical Series 6: Compilation of Food Exchange List. Delhi India: Global Books Organisation; 2017.
- Sidahmed E, Cornellier ML, Ren J, et al. Development of exchange lists for Mediterranean and Healthy Eating Diets: implementation in an intervention trial. Journal of Human Nutrition and Dietetics. 2014:27(5):413-425. doi: 10.1111/jhn.12158.
CrossRef - Institute of Home Economics, University of Delhi. Food Exchange Lists. (n.d.). [Unpublished]
- Institute of Hotel Management, Catering and Nutrition, Pusa, New Delhi, India. Food Exchange Lists. (n.d.). [Unpublished]
- Gittelsohn J, Shankar AV, Pokhrel RP, et al. Accuracy of estimating food intake by observation. Journal of the American Dietetic Association. 1994;94(11): 1273-1277. doi: 10.1016/0002-8223(94)92459-7. doi: 1016/0002-8223(94)92459-7.
CrossRef - Jonnalagadda SS, Mitchell DC, Smiciklas-Wright H, et al. Portion Size Estimation: A Source of Error in Diet Assessment Studies. Journal of the American Dietetic Association. 1995;95(9):A21. doi: 1016/S0002-8223(95)00422-X
CrossRef - Szenczi-Cseh J, Horváth Z, Ambrus A. Validation of a food quantification picture book and portion sizes estimation applying perception and memory methods. International Journal of Food Sciences and Nutrition. 2017;68(8):960-972. doi: 10.1080/09637486.2017.1309521.
CrossRef - Ervin RB, Smiciklas-Wright H. Accuracy in estimating and recalling portion sizes of foods among elderly adults. Nutrition Research. 2001;21(5):703-713. doi: 10.1016/S0271-5317(01)00288-3.
CrossRef - Weber JL, Cunningham-Sabo L, Skipper B, et al. Portion-size estimation training in second-and third-grade American Indian children. The American journal of clinical nutrition. 1999;69(4):782S-787S. doi: 10.1093/ajcn/69.4.782S. doi: 1093/ajcn/69.4.782S.
CrossRef - Byrd‐Bredbenner C, Schwartz J. The effect of practical portion size measurement aids on the accuracy of portion size estimates made by young adults. Journal of human nutrition and dietetics. 2004;17(4):351-357. doi:1111/j.1365-277X.2004.00534.x.
CrossRef - Wenhold FA, MacIntyre UE. Estimation accuracy of bean bags as portion size estimation aids for amorphous foods. South African Journal of Clinical Nutrition. 2024 Dec 30;37(3):106-15.
CrossRef - Bolland JE, Ward JY, Bolland TW. Improved accuracy of estimating food quantities up to 4 weeks after training. Journal of the American Dietetic Association. 1990;90(10):1402-1404.
CrossRef - Sharma V, Chadha R. Effectiveness of food portion size estimation aids for diet assessment: a systematic review. Int J Food Sci Nutr. 2017;2(5):106-112.
- Brown LB, Oler CHK. A food display assignment and handling food models improves accuracy of college students’ estimates of food portions. Journal of the Academy of Nutrition and Dietetics. 2000;100(9):1063. doi: 10.1016/S0002-8223(00)00309-6.
CrossRef - Sharma V, Chadha R. Development and evaluation of food photograph series software for portion size estimation among urban North Indian adults. Mediterranean Journal of Nutrition and Metabolism. 2023;16(4):293-312. https://doi.org/10.3233/MNM-230039
CrossRef - Slawson DL, Eck LH. Intense practice enhances accuracy of portion size estimation of amorphous foods. Journal of the Academy of Nutrition and Dietetics. 1997;97(3):295. doi: 1016/S0002-8223(97)00076-X.
CrossRef - Ayala GX. An experimental evaluation of a group-versus computer-based intervention to improve food portion size estimation skills. Health Education Research. 2005;21(1):133-145. doi: 1093/her/cyh049.
CrossRef - Bolland JE, Yuhas JA, Bolland TW. Estimation of food portion sizes: effectiveness of training. Journal of the American Dietetic Association. 1988;88(7):817-821.
CrossRef
Accepted on: 03 Sep 2025
Second Review by: Anwara Khatun
Final Approval by: Dr. Reema Tayyem


Web of Science Coverage
Emerging Sources Citation Index (ESCI)
2024 Journal Impact Factor: 1.1
Scopus Journal Metrics
CiteScore 2024: 1.9
CiteScore Details
Sustainable Nutrition: Food Systems, Nutrient Retention, and Public Health Impact
![]()
This journal is a member of, and subscribes to the principles of, the Committee on Publication Ethics (COPE)


