Assessment of Nutritional Status, Physical Activity, and Quality of Life among Elderly Women in Old Age Homes of Delhi-NCR: A Cross-Sectional Study
 and Vandana Garg*
 Department of Nutrition and Dietetics, Manav Rachana International Institute of Research and Studies, Faridabad, India
Corresponding Author Email: vandanagarg.fas@mriu.edu.in
Download this article as:
ABSTRACT:An improved life expectancy has led to an increase in the elderly population. The shift to nuclear families has raised the demand for institutional care for older adults in India. Therefore, understanding nutritional health, physical activity levels, and quality of life is crucial to promoting healthy aging among older people living in old age homes. This study assessed the nutritional status, physical activity levels, quality of life, and perceived services of elderly women residing in old age homes in Delhi-NCR. A cross-sectional descriptive study was conducted among 100 elderly women aged ≥60 years residing in two old age homes. Data were collected using a structured questionnaire assessing institutional services, factors affecting physical activity, quality of life and nutritional risk and physical activity level assessed using validated tools such as the Mini Nutritional Assessment (MNA) and Rapid Assessment of Physical Activity (RAPA). Descriptive and inferential statistics, including Pearson’s correlation, were used to analyze relationships between variables. The mean age of participants was 75.56±8.86 years. Overall satisfaction with services was moderate (mean = 26.78). Nutritional risk scores (mean = 21.19), MNA scores (mean = 9.30), and RAPA scores reflected moderate nutritional risk and low physical activity. A strong positive correlation was found between quality of life and nutritional status (r = 0.706, p < 0.001). MNA scores were positively correlated with physical activity levels (RAPA1: r = 0.301, p = 0.002). Barriers such as chronic illness, lack of facilities, and motivation were commonly reported. While institutional services supported moderate satisfaction, gaps remain in nutritional support and physical activity promotion. Strengthening nutrition care and structured physical activity programs in old age homes may improve overall health and quality of life among elderly women.
KEYWORDS:Elderly Women; Institutional Care; Mini Nutritional Assessment; Nutritional Status; Old Age Homes
Introduction
Globally, the proportion of the elderly population is increasing, and India is no exception. According to the Longitudinal Ageing Study in India (LASI), nearly 8.6% of India’s population is aged 60 years and above, and this percentage is projected to rise significantly in the coming decades.1 According to the 2001 census, the gender ratio among the Indian elderly aged 60 years and older is 1,028 females for 1,000 males.2 With this demographic shift, institutional care settings such as old age homes are becoming more prominent. However, these environments pose unique challenges in ensuring the health, dignity, and well-being of older adults.3, 4
Aging is often associated with a decline in physical function, nutritional deficiencies, and psychosocial challenges. Nutritional status in the elderly can be compromised due to physiological changes, dental problems, reduced appetite, and chronic illnesses.1,5–7Physical inactivity further exacerbates health risks, contributing to functional decline and increased morbidity.8 Quality of life in institutionalized elderly is influenced by multiple factors, including availability of services, emotional support, autonomy, and dietary satisfaction.3, 4, 9
NITI Aayog’s recent report published in 2024 emphasized the need for integrated senior care models, gaps in service delivery, caregiver training, and institutional care or infrastructure needs.10 These findings are aligned with Sankala Foundation 2025 report, which stated the biopsychosocial challenges faced by institutionalized elderly, including nutritional deficiencies, physical inactivity, and emotional isolation.11 A recent study conducted in Bhopal, reveal that while institutionalized elderly may benefit from structured routines and social interaction, they often experience reduced autonomy and environmental satisfaction.12 Another study further highlights the cultural stigma surrounding old age homes, which can negatively impact residents’ emotional well-being.13, 14
Several tools have been validated for assessing elderly health in institutional settings. The Mini Nutritional Assessment (MNA) is a widely used tool for screening malnutrition among older adults.15 Similarly, the Rapid Assessment of Physical Activity (RAPA) tool offers a practical measure of physical activity levels specific to aging populations.16 Our study adopted the biopsychosocial model as its guiding framework, which posits that health outcomes in elderly populations are shaped by the interaction of biological, psychological, and social factors.17 In the context of institutional care nutritional status, physical activity levels, quality of life, service satisfaction were studied to understand the biological, psychological, and social factors.
This study aimed to evaluate the nutritional status, physical activity level, quality of life, and service satisfaction among elderly women living in old age homes in the Delhi-NCR region. The findings will help identify health gaps and inform policy interventions that enhance care quality and dignity in institutional settings.
Materials and Methods
Study Design and Participants
A cross-sectional descriptive study was conducted in January-February 2025 among elderly women residing in two old age homes located in Delhi-NCR. These homes exclusively catered to women and permitted data collection.
Sample Size and Selection
Purposive sampling was used. From the total residents, a 1/10th proportion was selected, resulting in 120 participants. After exclusions, complete data were collected from 100 elderly women aged 60 years and above who had resided at the old age home for at least 6 months and were cognitively able to participate.
Data Collection Tools
A self-structured questionnaire assessed; Satisfaction with old age home services; Factors affecting physical activity; Quality of life and Nutritional risk. Scoring systems included Likert and frequency-based scales. Additionally, the Mini Nutritional Assessment (MNA) and Rapid Assessment of Physical Activity (RAPA) tools were also administered.
The section on evaluating old age home services gathered information on participants’ satisfaction with various aspects of their living environment at the old age home. It included questions on cleanliness, hygiene, healthcare services, caregiver availability, medical check-ups, safety, and recreational activities. Responses were measured using a 5-point Likert scale ranging from “Very Dissatisfied” to “Very Satisfied,” and from “Very Poor” to “Very Good, making the maximum possible score 45 and the minimum 9. A score less than or equal to 20 indicates low satisfaction; 20 to 35 reflects moderate satisfaction, and a score above 35 suggests adequate service levels. This scoring system helps evaluate the perceived quality of care and services provided to elderly residents.
The second section of the questionnaire was focused on the factors affecting physical activity behavior of the participants. It assessed how often they engaged in activities like walking or yoga, their access to physical activity programs, motivation levels, and barriers such as pain, lack of facilities, or staff encouragement. It also included self-assessment of mobility, ability to move independently, and perceived changes in activity levels since joining the old age home. Responses were collected using frequency scales and checklists to better understand the physical functioning and exercise habits of elderly women. The score is calculated based on 8 questions, each with 5 response options scored from 1 to 5. The minimum possible score is 8 (if a person scores 1 on all questions) and the maximum possible score is 40 (if a person scores 5 on all questions). A higher total score reflects favorable factors to engage in physical activity.
Section three explored the emotional and social well-being of the participants. It included questions about their perceived quality of life, social interactions, loneliness, mental health, enjoyment of daily life, and feelings of anxiety or depression. Participants rated their experiences on 5-point frequency and satisfaction scales. The objective was to evaluate how the institutional environment affects their psychological and emotional state, with a focus on both social connection and mental resilience. There are 6 questions, each having 5 response options scored from 1 to 5. The maximum score is 30 and the minimum score is 6. A higher total score reflects a better quality of life since the participants reside at an old age home.
This section evaluated the nutritional risk among the participants. It included items related to food satisfaction, frequency of balanced meals, unintentional weight loss, chewing/swallowing difficulties, digestive issues, and fatigue caused by poor nutrition. It also assessed intake of protein-rich foods and availability of nutritious choices. Response options included frequency-based scales and satisfaction ratings. The nutritional risk status of elderly women is assessed through 8 questions. Six questions have five response options each, while two questions (Q2 and Q3) have four options. The questions are scored on a scale of 1 to 5 or 1 to 4, depending on the number of options. The maximum possible score is 38, and the minimum score is 8. A higher total score reflects better nutritional status and lower risk, whereas a lower score may indicate poor nutrition and a higher level of nutritional risk.
The Rapid Assessment of Physical Activity (RAPA) tool was used to evaluate the physical activity levels of older adults in this study.16 Designed and validated specifically for aging populations; RAPA is a brief, self-administered questionnaire that effectively captures both aerobic and strength/flexibility activity patterns. Its simplicity and cultural adaptability make it suitable for diverse community and institutional settings. RAPA is divided into two sections: RAPA1 focuses on aerobic activity through seven yes/no items. The total score ranges from 1 to 7, categorizing individuals into five levels: sedentary (1), underactive (2), regular underactive with light activities (3), regular underactive (4), and regular active (5–7). A score of 6 or higher is considered indicative of adequate aerobic activity. RAPA2 addresses strength and flexibility activities using two additional items. The responses are scored separately: strength only = 1, flexibility only = 2, and both = 3. The maximum combined score is 3.
Higher scores in both RAPA1 and RAPA2 reflect greater engagement in physical activity. This structured format allows for easy interpretation and stratification of participants based on their physical activity profiles. This tool was selected due to its efficiency, validity, and relevance in assessing physical function and health behavior in elderly populations.
Mini Nutritional Assessment (MNA)
The MNA tool was adapted from the original study “The Mini Nutritional Assessment (MNA) and its use in grading the nutritional state of elderly patients.15 It is a comprehensive and widely accepted screening tool designed specifically for elderly individuals. The MNA evaluates nutritional status through various parameters including anthropometric data, dietary intake, global health status, and subjective assessments. It classifies respondents into three categories: normal nutritional status, at risk of malnutrition, and malnourished, based on a cumulative score. The tool was selected due to its reliability and effectiveness in identifying early signs of malnutrition especially relevant in institutional care settings where elderly women are more vulnerable to dietary neglect and health complications. The MNA Screening (Short Form) includes 6 questions in total. Five of these questions have 3 response options each, scored from 0 to 2, while one question has 2 response options, scored from 0 or 1. This makes the maximum possible score 11 and the minimum score 0. Based on the updated scoring criteria: a score ≥10 indicates normal nutritional status, a score 8–9 signifies the individual is at risk of malnutrition, and a score <7 indicate the person is malnourished and should proceed to the full MNA assessment.
The Full MNA (Mini Nutritional Assessment) comprises 11 questions. Out of these, 9 questions are scored on a 3-point scale (0 to 2), while the remaining 2 questions are scored on a 2-point scale (0 to 1). This brings the maximum possible score to 22. Based on the total score, nutritional status is classified as follows: a score greater than 20 indicate normal nutritional status, scores between 17 and 21 indicate being at risk of malnutrition, and a score less than or equal to 16 indicates the individual is malnourished.
Statistical Analysis
Data were entered into MS Excel and analyzed using SPSS 26.0. Descriptive statistics (mean, SD, percentage) and inferential statistics (Pearson correlation, ANOVA) were used. Significance was set at p<0.05.
Results
A total of 100 elderly women residing in two old age homes in Delhi-NCR were consented to participate in the current study. The data for the study was collected in January-February 2025. The data was focusing on their nutritional status, physical activity levels, quality of life, and institutional service satisfaction. Figure 1 shows the age distribution of the participants in the study, where most (29%) were aged 76–83 years, followed by 26% in the 60–67 age category and 25% in the 68–75 age category. The lowest percentage, 20%, was from the oldest group aged 84–89 years.
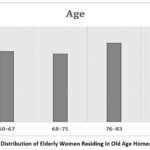 |
Figure 1: Age Distribution of Elderly Women Residing in Old Age Homes in Delhi-NCR |
Table 1 presents the descriptive statistics for various variables assessed among 100 participants residing in old age homes. The average age of participants was 75.56 years (SD = 8.86). The mean score for satisfaction with old age home services was 26.78 (SD = 3.90), suggesting moderate overall satisfaction. Factors affecting physical activity (PA) had a mean score of 23.75 (SD = 3.84), while the quality of life was rated with a mean of 17.69 (SD = 2.97), reflecting a lower perception of life quality. Nutritional risk was also assessed, showing a mean score of 21.19 (SD = 3.41), highlighting potential dietary concerns. The Mini Nutritional Assessment (MNA-2) full form scored a mean of 9.30 (SD = 4.12), further indicating varied nutritional status. Additionally, the RAPA-1 (aerobic activity) and RAPA-2 (strength/flexibility) scores had means of 4.46 (SD = 1.56) and 0.89 (SD = 1.02), respectively, reflecting low engagement in physical activity and flexibility exercises among the elderly group.
Table 1: Descriptive Statistics of Age, Nutritional, Physical Activity, and Quality of Life Scores Among Study Participants (n = 100)
| Characteristics | Mean | Standard Deviation |
| Age (in years) | 75.56 | 8.86 |
| Old Age Home Service Score | 26.78 | 3.90 |
| Factors Affecting Physical activity Score | 23.75 | 3.84 |
| Quality of Life Score | 17.69 | 2.97 |
| Nutritional Risk Score | 21.19 | 3.41 |
| MNA-2 (Full Form Score) | 9.30 | 4.12 |
| RAPA-1 Score (Aerobic Activity) | 4.46 | 1.56 |
| RAPA-2 Score (Strength/Flexibilty) | 0.89 | 1.02 |
Table 2 presents the distribution of elderly women according to their physical activity levels. Only 4% were sedentary, while 10% were underactive. A combined 31% were regular underactive (light or otherwise). About 30% were regular active, and 25% were categorized as fully active, showing a fair proportion with desirable activity levels. For RAPA 2, which assesses strength and flexibility, the results were less favorable: 55% did not do any such exercises, 42% did either strength or flexibility, and only 3% engaged in both. This indicates a need to promote strength and flexibility activities among the elderly
Table 2: Classification of Participants Based on RAPA-1 and RAPA-2 Scoring Criteria
| Categories (RAPA 1) | Percentage |
| 1. Sedentary | 4 |
| 2. Underactive | 10 |
| 3. Regular underactive (light activity) | 11 |
| 4.Regular underactive | 20 |
| 5. Regular active | 30 |
| 6. Active | 25 |
| Categories (RAPA 2) | Percentage |
| 1. None | 55 |
| 2. Either strength or flexibility | 42 |
| 3. Both strength or flexibility | 3 |
Table 3 compares the mean scores of various indicators across different perceived levels of services in old age homes. Those reported adequate services had the highest physical activity score (26.00 ± 1.41) and MNA-2 score (12.50 ± 4.95), suggesting better nutritional status and activity. However, their Quality of Life score was lower (15.50 ± 2.12), compared to those with Moderate Services (17.87 ± 3.03). The Low Service group had the lowest Nutritional Risk Score (19.50 ± 1.69), while the Adequate group scored 15.50 ± 2.12. These results suggest better services are linked to improved physical and nutritional health, though not necessarily higher perceived quality of life.
Table 3: Comparison of Mean Scores Across Service Levels in Old Age Homes (n=100)
| Variables | Low Service (≤ 20) | Moderate Service (21–35) | Adequate Service (> 35) | F value | P value |
| Age | 79.0 ± 8.071 | 75.12 ± 8.87 | 81.50 ± 10.6 | 1.16 | 0.31 |
| Factors Affecting PA Score | 22.88 ± 3.72 | 23.78 ± 3.88 | 26.00 ± 1.41 | 0.54 | 0.48 |
| Quality of Life Score | 16.25 ± 1.75 | 17.87 ± 3.03 | 15.50 ± 2.12 | 1.66 | 0.19 |
| Nutritional Risk Score | 19.50 ± 1.69 | 21.47 ± 3.40 | 15.50 ± 2.12 | 4.32 | 0.16 |
| MNA-1 | 5 ± 2 | 4.90 ± 1.86 | 6 ± 1.41 | 0.34 | 0.72 |
| MNA-2 | 8.13 ± 4.35 | 9.33 ± 4.09 | 12.50 ± 4.95 | 0.93 | 0.39 |
| RAPA-1 Score | 4.38 ± 1.48 | 4.46 ± 1.59 | 5 ± 0 | 0.13 | 0.87 |
| RAPA-2 Score | 0.25 ± 0.70 | 0.94 ± 1.03 | 1 ± 1.41 | 1.72 | 0.18 |
Pearson correlation coefficients were calculated to explore the relationships between variables including old age home service scores, barriers to physical activity, quality of life, nutritional risk scores, nutritional status (as measured by Mini Nutritional Assessment short and full forms), and physical activity levels (rapa1 and rapa2 scores) among older adults (N = 100) Figure 2. A statistically significant positive correlation was observed between old age home service scores and the Mini Nutritional Assessment (MNA) full form score (r = 0.224, p = 0.025), indicating that better services in old age homes are associated with improved nutritional status. Similarly, MNA short form scores were strongly and positively correlated with MNA full form scores (r = 0.819, p < 0.001), establishing consistency between the two instruments. The quality of life score demonstrated a strong and statistically significant positive correlation with the nutritional risk score (r = 0.706, p < 0.001). While this suggests a direct association, the direction and interpretation should consider the nature of the nutritional risk scoring system used in the study. Both MNA scores were positively correlated with physical activity as measured by the Rapid Assessment of Physical Activity-1 (rapa1) score. Specifically, the correlation was r = 0.294 (p = 0.003) for the MNA short form and r = 0.301 (p = 0.002) for the MNA full form, indicating that better nutritional status is associated with higher physical activity levels. A significant negative correlation was found between RAPA 1 and RAPA 2 scores (r = -0.379, p < 0.001), suggesting that these two physical activity scales may capture different or inverse dimensions of activity. No statistically significant associations were found between the barriers to physical activity score and any other variable measured in the study. The correlation analysis indicates that old age home services have a modest but statistically significant positive relationship with the nutritional status of older adults, specifically with the Mini Nutritional Assessment (MNA) full form score (r = 0.224, p = 0.025). This suggests that better or more comprehensive services provided by old age homes are associated with improved nutritional outcomes among their residents. However, old age home services did not show significant associations with other key variables such as quality of life, physical activity levels (rapa1, rapa2), or nutritional risk scores. This may indicate that while such services positively impact nutrition to some extent, their effect on broader dimensions of health and well-being may be limited or mediated by other factors like psychosocial support, individual health conditions, or institutional quality.
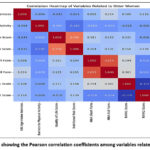 |
Figure 2: Heat map showing the Pearson correlation coefficients among variables related to older women. |
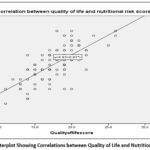 |
Figure 3: Scatterplot Showing Correlations between Quality of Life and Nutritional Risk Score |
Figure 3 shows a clear positive link between quality of life and nutritional status among elderly women. As quality of life scores increase, nutritional scores also go up. This means that participants who feel better about their lives also tend to have better nutrition. The line in the graph (y = 6.83 + 0.81x) tells us that for every 1-point increase in quality of life, the nutrition score goes up by about 0.81 points. The R² value of 0.499 means that nearly 50% of the changes in nutrition scores can be explained by changes in quality of life. A Figure 4 graph shows a positive but weak relationship between the quality of services in old age homes and the nutritional status of participants. The regression equation is y = 2.96 + 0.24x, meaning that for every 1-point increase in service quality, the MNA score increases by 0.24. The R² value is 0.050, indicating that only about 5% of the changes in nutritional status can be explained by the services provided. This suggests that while better services may slightly improve nutrition, other factors like personal health, food intake, or emotional well-being might play a larger role in influencing nutritional outcomes.
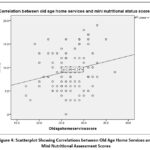 |
Figure 4: Scatterplot Showing Correlations between Old Age Home Services and Mini Nutritional Assessment Scores |
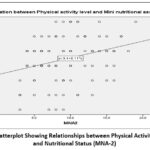 |
Figure 5: Scatterplot Showing Relationships between Physical Activity (RAPA-1) and Nutritional Status (MNA-2) |
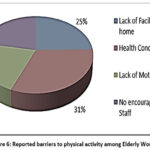 |
Figure 6: Reported barriers to physical activity among Elderly Women |
Figure 5 graph shows a mild positive relationship between physical activity (RAPA-1 scores) and nutritional status (MNA-2 scores). The regression line equation is y = 3.4 + 0.11x, indicating that as nutrition improves, physical activity levels slightly increase. However, the R² value is just 0.090, meaning only 9% of the changes in physical activity are explained by nutritional status. This means that while better nutrition might help participants feel more energetic and active, the connection is not very strong. Other factors such as physical ability, pain, motivation, or environment could have a greater influence on how active elderly women are in old age homes. Figure 6 shows that distribution of key barriers that prevent elderly women from engaging in physical activity within the old age home. The most frequently reported barrier was health conditions (31%), indicating that chronic illnesses or physical limitations hinder participation. This was followed by lack of facility at the old age home (25%), suggesting infrastructural gaps in promoting movement and exercise. Both lack of motivation (22%) and no encouragement from staff (22%) were also significant factors, highlighting the need for emotional support and staff-driven engagement. These findings suggest that both personal and institutional challenges must be addressed to improve physical activity among institutionalized elderly.
Discussion
This study reveals moderate satisfaction with institutional services and highlights significant concerns in nutrition and physical activity. The mean MNA score (9.30) suggests a risk of malnutrition in many participants. Similar findings were reported from old age homes in Pune city, found that 46% of elderly in institutional care were malnourished or at risk.18 49.3 percent of older adults were malnourished in another study conducted among 353 elderly (>60 years) individuals at two urbanized villages of East Delhi.19 Only 3% performed strength and flexibility exercises, resonating findings by Arjuna et al. (2024) who emphasized that physical activity is rarely structured in Indian old age homes.16 High rates of emotional distress were reported: 46% often felt lonely, 46% experienced frequent depression or anxiety, and 50% derived little joy from daily life. This mirrors Samuel and McLachlan (2016), who found institutionalized elderly exhibited significantly poorer cognitive and emotional health due to limited engagement.20 Moreover, our study’s significant positive correlation between nutritional status and quality of life aligns with Sharma et al., reinforcing that good nutrition enhances emotional and social well-being.21
Interestingly, despite better services, quality of life was not always higher, suggesting the influence of psychosocial and emotional factors, as noted by Soni and Lodha’s study.12 Our findings also support the multidimensional nature of aging, where physical, psychological, and social domains interact. Some of key strength of this study was using validated tools to assess physical activity and nutritional risk, ensuring reliability and comparability of the findings. The inclusion of key domains related to old age home services provided the valuable insights that can inform targeted interventions and care practices. From a policy perspective, the study highlights the urgent need for integrated elder care models that go beyond basic service provision. The India Ageing Report 2023 recommends strengthening geriatric care, emotional support systems, and digital literacy programs to promote dignity and inclusion. Institutional reforms should prioritize; regular mental health screenings and counseling; structured physical activity programs tailored to elderly women; nutritionally balanced meal planning with regular assessments; staff training in empathetic caregiving and emotional support.22
The study has certain limitations which include a relatively small sample size and data collection restricted to only two old age homes, which may limit the generalizability of the findings. This was due to limited time-frame for MSc Nutrition & Dietetics research work. Additionally, reliance on self-reported data may introduce recall bias or social desirability bias, potentially reflect their self-perception. Despite the statistical rigor, the study is deficient in exploration of gender-specific factors and institutional dynamics. Elderly women often face compounded disadvantages due to gender-specific caregiving roles, widowhood, and financial dependency, which can exacerbate emotional isolation and reduce autonomy. Old age home services such as caregiver availability, recreational activities, and emotional support plays a pivotal role in shaping older women’s well-being. These need to be studied in more detailed using longitudinal studies to assess changes in quality of life over time.
Conclusion
Institutionalized elderly women in Delhi-NCR exhibit moderate satisfaction with old age home care but show concerning significant levels of nutritional risk and low engagement in physical activity and emotional well-being. The data reveal strong correlations between nutritional status and quality of life, emphasizing the need for holistic care approaches. Institutional reforms must address not only physical health but also emotional and social dimensions to foster healthy aging. These findings underscore the importance of gender-sensitive policies and comprehensive elder care models that prioritize dignity, autonomy, and emotional support. Interventions focusing on diet quality, regular assessments, and exercise programs are needed to support healthy aging in old age homes.
Acknowledgement
We would like to express our sincere gratitude to the elderly participants of the Old Age Home for their cooperation also the Manav Rachna International Institute of Research & Studies for providing us the opportunity to complete this work.
Funding Sources
The authors received no financial support for the research, authorship, and/or publication of this article.
Conflict of Interest
The author(s) received no financial support for the research, authorship, and/or publication of this article.
Data Availability Statement
The data supporting the findings of this study are available from the corresponding author upon reasonable request.
Ethics Statement
Ethics approval was obtained from Ethical committee, Manav Rachna International Institute of Research & Studies (MRIIRS/SAHS/N&D/2024-25/N-009).
Informed Consent Statement
Informed consent was obtained from all individual participants included in the study.
Clinical Trail Registration
This research does not involve any clinical trials.
Permission to Reproduce Material from Other Sources
Not Applicable
Author Contributions
- Vandana Garg –conception, design, analysis, and drafting, reviewed and approved.
- Vidushi Makhijani –conception, design, data collection and drafting, reviewed and approved.
References
- Perianayagam A, Bloom D, Lee J, et al. Cohort profile: The Longitudinal Ageing Study in India (LASI). Int J Epidemiol. 2022;51(4):e167–e176. doi:10.1093/ije/dyab266.
CrossRef - Smith JP, Majmundar MK. Aging in Asia: Findings from New and Emerging Data Initiatives. Washington, DC: National Academies Press; 2012.
- Annapuranam K. Challenges of older adults in India: A qualitative study of institutional care, preferences and government initiatives. Res Aging Soc Policy. 2025;13(1):1–22. doi:10.17583/rasp.14536.
CrossRef - Santhosh Naik JK, Krishna V, Professor A. Well-being and institutional care in older adults. Int J Novel Res Dev. 2024. Available from: ijnrd.org.
- Çiftçi S, Erdem M. Comparing nutritional status, quality of life and physical fitness: aging in place versus nursing home residents. BMC Geriatr. 2025;25(1):102. doi:10.1186/s12877-025-05751-w.
CrossRef - Ministry of Statistics and Programme Implementation. Elderly in India 2021. New Delhi: Government of India; 2021. Available from: https://mospi.gov.in/web/mospi/reports-publications.
- Roy S, Maheshwari V, Basu S. Prevalence of multiple non-communicable disease risk factors among self-reported healthy older adults living in community dwelling in India: Evidence from the Longitudinal Ageing Study in India. Clin Epidemiol Glob Health. 2024;28:101680. doi:10.1016/j.cegh.2024.101680.
CrossRef - Battista F, Duregon F, Vecchiato M, et al. Sedentary lifestyle and physical inactivity: A mutual interplay with early and overt frailty. Nutr Metab Cardiovasc Dis. 2025;35(6):103971. doi:10.1016/j.numecd.2025.103971.
CrossRef - Menezes DC. Aging in India: From family to institutional care. Asian J Health Psychol. 2024;2. Available from: ahpsy.in.
- NITI Aayog. Senior Care Reforms in India – Reimagining the Senior Care Paradigm: A Position Paper. New Delhi: Government of India; 2024.
- Sankala Foundation. Ageing in India: Challenges and Opportunities. New Delhi: Sankala Centre for Climate and Sustainability, Sankala Foundation; 2025.
- Soni A, Lodha RS. A comparative study of quality of life of elderly living in old age homes and within family. Int J Community Med Public Health. 2024;11(7):2656–2660. doi:10.18203/2394-6040.ijcmph20241819.
CrossRef - Kumar S, Gupta A, Mazta SR, et al. Quality of life of occupants of old age homes of a northern Indian province. Int J Community Med Public Health. 2023;10(11):4329–4333. doi:10.18203/2394-6040.ijcmph20233472.
CrossRef - Indu PV, Remadevi S, Philip S, et al. A qualitative study on the mental health needs of elderly in Kerala, South India. J Geriatr Ment Health. 2018;5(2):143–151. doi:10.4103/jgmh.jgmh_12_18.
CrossRef - Vellas B, Guigoz Y, Garry PJ, et al. The mini nutritional assessment (MNA) and its use in grading the nutritional state of elderly patients. Nutrition. 1999;15(2):116–122. doi:10.1016/S0899-9007(98)00171-3.
CrossRef - Arjunan P, Annamalai M, Subramaniam A, et al. Physical activity, functional status, and quality of life among older adults in India. SAGE Open Nurs. 2024;10:23779608241290384. doi:10.1177/23779608241290384.
CrossRef - Card AJ. The biopsychosociotechnical model: a systems-based framework for human-centered health improvement. Health Syst (Basingstoke). 2022;12(4):387–407. doi:10.1080/20476965.2022.2029584.
CrossRef - Khole CV, Soletti A. Nutritional status of elderly in the old age homes: A study in Pune city. Curr Res Nutr Food Sci. 2018;6(1):234–240. doi:10.12944/CRNFSJ.6.1.27.
CrossRef - Vaish K, Patra S, Chhabra P. Nutritional status among elderly: A community-based cross-sectional study. Indian J Public Health. 2020; 64(3):266–270. doi:10.4103/ijph.IJPH_150_19.
CrossRef - Samuel R, McLachlan CS, Mahadevan U, et al. Cognitive impairment and reduced quality of life among old-age groups in Southern Urban India: home-based community residents, free and paid old-age home residents. QJM. 2016; 109(10):653–659. doi:10.1093/qjmed/hcw040.
CrossRef - Sharma S, Yadav DK, Karmacharya I, et al. Quality of life and nutritional status of the geriatric population of the south-central part of Nepal. J Nutr Metab. 2021;2021:6621278. doi:10.1155/2021/6621278.
CrossRef - UNFPA India, IIPS. India Ageing Report 2023. New Delhi: United Nations Population Fund; 2023. Available from: https://india.unfpa.org/en.
Accepted on: 06 Oct 2025
Second Review by: Sabiha Hussain
Final Approval by: Dr. Suhad Bahijri


Web of Science Coverage
Emerging Sources Citation Index (ESCI)
2024 Journal Impact Factor: 1.1
Scopus Journal Metrics
CiteScore 2024: 1.9
CiteScore Details
Sustainable Nutrition: Food Systems, Nutrient Retention, and Public Health Impact
![]()
This journal is a member of, and subscribes to the principles of, the Committee on Publication Ethics (COPE)


