Nano-Chitin from White Leg Shrimp: Production by Acid Hydrolysis Combined with Ultra-sonic and Saltiness Enhancing Ability
 , Ho-Phu Ha1and Tien-Thanh Nguyen1*
 1Department of Chemistry and Life Sciences, Hanoi University of Science and Technology, Hanoi, Vietnam
2Department of Food Technology, University of Economics–Technology for Industries, Hanoi, Vietnam
Corresponding Author Email: thanh.nguyentien@hust.edu.vn
DOI : http://dx.doi.org/10.12944/CRNFSJ.13.3.31
Download this article as:
![]()
Nano-Chitin is a nanometer-sized derivative of chitin. It is highly water-dispersible, positively charged, and biocompatible thus is considered to have potential applications in food, medicine, and environmental. This article presents a study on preparing Nano-Chitin from chitin for application in food technology, aiming to reduce salt content in food products. The Nano-Chitin was obtained from white leg shrimp chitin using acid hydrolysis combined with ultrasonic treatment. During hydrolysis, chitin powder was treated with 3.5N HCl at an acid-to-chitin ratio of 25:1 (mL/g). The reaction was carried out at 90°C for 120 minutes. After the reaction, the mixture was washed to remove residual acid, then subjected to ultrasonication at 77% amplitude for 34 minutes, using a solvent-to-solid ratio of 67:1 (mL/g). The ultrasonicated product was then freeze-dried to obtain Nano-Chitin. The resulting Nano-Chitin had an average particle size of 248 nm, a solubility of 73.1%, and a zeta potential of 24.5 mV. When added to a 0.65% NaCl solution at a concentration of 90 μg/mL, Nano-Chitin enhanced the perceived saltiness to a level similar to that of a 0.69% NaCl solution. Similarly, at 84 μg/mL, it increased the saltiness of a 0.61% NaCl solution to match that of a 0.65% solution. This enhancement in saltiness perception was observed at both 0.61% and 0.65% NaCl concentrations, which are commonly used in food. These results suggest that Nano-Chitin has potential as a tool for reducing sodium intake without compromising taste
KEYWORDS:Nano-Chitin; Optimization; Saltiness; Solubility; White Leg Shrimp
Introduction
Chitin, mostly found in the shells of shrimp, crabs, and squids, is the second most abundant polysaccharide in nature just after cellulose. Regarding structure, chitin is in the form of “fibre bundles”, consisting of crystalline regions distributed among amorphous regions. Crystalline regions remain stable, whereas amorphous areas are less ordered and readily dissolve under acidic conditions. Chitin exhibits high biocompatibility, biodegradability. However, chitin cannot dissolve or disperse in water, so its application is limited.1,2 Nano-Chitin, a nanoscale derivative of chitin, typically exists in two morphological forms: fibrous and rod-shaped crystalline structures. Compared to raw chitin, Nano-Chitin offers superior characteristics, notably better dispersion and a charged surface. Consequently, Nano-Chitin disperses well in a wide range of solvents and develops a positive charge in aqueous solution, facilitating interactions with anionic species. In NaCl solutions, Nano-Chitin can interact with Cl⁻ ions, resulting in increased mobility of Na⁺ ions and enhancing the perception of saltiness.3-5
Chitin can be obtained from different sources such as crab shells,6,7 and mushrooms,8 for Nano-Chitin developement. In Vietnam, white leg shrimp (Litopenaeus vannamei) is widely farmed and has a high annual production. As a result, chitin derived from this species is abundant. Moreover, shrimp shells are a byproduct of seafood processing. Utilizing them not only increases economic value but also helps reduce environmental pollution.
With different chitin sources, previous studies have used various methods, such as grinding,6-8 high-pressure homogenization,9 intermediate oxidation,10,11 to produce Nano-Chitin. These techniques often come with limitations, for example grinding may result in uneven particle size, high-pressure homogenization requires costly equipment and high energy input, and oxidation can involve harsh chemicals. In contrast, the combination of hydrolysis, and ultrasound,1,12 offers several advantages, including simplicity, efficiency, and better control over particle size and surface properties. These studies only stated the size of Nano-Chitin, but there were not many descriptions about the properties of Nano-Chitin, such as solubility or application in food production. Despite the growing interest in Nano-Chitin production, the role of ultrasound parameters in facilitating chitin size reduction remains poorly reported.
Nano-Chitin, is gaining significant attention due to its unique properties such as mechanical strength, biocompatibility, and biodegradability, offering broad application potential. In agriculture, Nano-Chitin functions as a growth promoter, and pesticide. Biomedical applications include tissue engineering, wound healing, and drug delivery, and in environmental contexts, Nano-Chitin aids in water purification and pollution control. Furthermore, in cosmetics, Nano-Chitin provides properties like biocompatibility, antibacterial, anti-inflammatory, moisturizing, and anti-aging effects, affirming the great potential of this material. In the food industry, Nano-Chitin enhances preservation, acts as a functional additive, and promotes gut health, while also being explored for biodegradable packaging materials.13,14
Recently, it is well aware that excessive consumption of table salt poses significant health risks such as high blood pressure, heart disease, stroke, kidney damage, and osteoporosis.15,16 To address this challenge, developing compounds that can enhance the perception of saltiness—such as Nano-Chitin—represents a promising strategy for reducing dietary salt intake in the food industry. However, the specific potential of Nano-Chitin to enhance saltiness perception, including its effective concentration and the magnitude of its enhancement effect, has not yet been thoroughly investigated.
This study aimed to use a combination of acid hydrolysis and ultrasonication to produce Nano-Chitin from Vietnamese Lipopenaeus vannamei shell, which considered as waste by-products from seafood processing industry and rich in protein and chitin may cause environmental polution when released without treatment. The research focused on optimizing key technological parameters of both the hydrolysis and ultrasound processes and characterizing the resulting Nano-Chitin—particularly its properties relevant to enhancing saltiness perception in NaCl solutions, such as zeta potential and solubility. The findings provide a foundation for producing Nano-Chitin with saltiness-enhancing capabilities, facilitating salt reduction in food products, increasing the economic value of seafood, and contributing to environmental pollution reduction.
Materials and Methods
Materials
The chitin used in this study was purified from White Leg Shrimp (Lipopenaeus vannamei), sourced from a seafood processing company in Binh Thuan, Vietnam.
Methods
Production of Nano-Chitin
Generally, Nano-Chitin was prepared following a procedure including two steps hydrolysis and ultrasonication as shown in Fig. 1. Briefly, purified chitin was ground into powder (size <0.3 mm), and hydrolysised in HCl solution. Following hydrolysis, the suspended solid was washed with distilled water through multiple cycles of centrifugation (9000 rpm/10 min) until neutral pH and then subjected to ultrasonication. After ultrasonication, the samples were collected by freeze-drying. In each step, the effects of parameters were investigated as follow described.
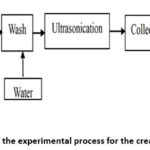 |
Figure 1: Diagram of the experimental process for the creation of Nano-Chitin. |
Single Factor Experiment
The hydrolysis step. The hydrolysis method used in this study was adapted from previous published researches17-19 using settling time of hydrolysed chitin exhibiting the hydrolysis intensity as decisive criteria. Five grams of chitin powder were mixed with HCl solution in a sealed flask. The mixture was subsequently heated to the target temperature and held at that temperature for the duration required to complete hydrolysis. In the hydrolysis experiments, the factors were investigated sequentially in the following order: temperature, HCl concentration, hydrolysis time and ratio of HCl to chitin. After each experiment for a given factor, the most appropriate value for that factor was selected to be applied in the investigation of the next factor. Firstly, temperature was varied from 60°C to 100°C in 10°C increments. Other factors were fixed as follow: a duration of 90 minutes, an acid-to-chitin ratio of 30:1, and an HCl acid solution concentration of 3N. Then, the concentration of hydrochloric acid (HCl) ranged from 1.5 N to 4.5 N, increasing by 0.5 N per step. Reaction time was studied from 30 to 210 minutes, with 30-minute intervals. The ratio of HCl solution to chitin (v/w) was adjusted from 10:1 to 40:1, in increments of 5:1. After hydrolysis, the sample was washed by centrifugation as previously described, and the settling time of the centrifuged solid fraction, which served as an indicator of particle size of resulted chitin fragments showing the degree of hydrolysis, was subsequently evaluated.
After each parameter was investigated, the condition that resulted in the longest settling time of the solid fraction, indicative of the smallest particle size, was selected for use in subsequent experiments.
In the ultrasonication step, 4 grams of the solid obtained from previous step were mixed with distilled water and treated using Q700 Sonicator (Qsonica, Newtown, US). In these experiments, factors such as amplitude, ultrasonication time, and water-to-solid ratio were investigated sequentially. For each individual factor under investigation, the other factors were kept constant. Firstly, the ultrasonic amplitude was varied from 30% to 90% in 10% increments (100% amplitude corresponding to a power output of 700 W), sonication time and water/solid ratio were fixed at 30 minutes and 50/1, respectively. Upon completion of the ultrasonication process, the samples were freeze dried using ScanVac CoolSafe FRE4570 system (Labogene, Denmark), operated at -50 °C for 48 hours.20 The freeze-dried products were dispersed in distilled water and then measured for viscosity and solubility. The condition that resulted in the highest viscosity and solubility of the dispersion was choosen for subsequent experiment.
When amplitude was choosen, the effect of ultrasonication time were invesitgated with varied duration of 15 to 45 minutes in 5-minute increments with fixed water/solid ratio of 50/1. Finally, the water/solid ratio was varied from 20:1 to 80:1, in steps of 10:1, with choosen amplitude and ultrasonication time to find out at which the in the highest viscosity and solubility of the dispersion will be obtained.
The results obtained from the single factor experiments served as the basis for subsequent experimental modeling.
Experimental Programming and Optimization for Ultrasonication Step
To optimize the ultrasonication step, the experimental design using the Box-Behnken method21 considered three factors: time, amplitude, and solvent/solid. Each factor was evaluated at three levels (-1, 0, +1), which were determined based on the results of the single factor experiments shown in Table 2.
The experimental design included 17 trials, including five replicates at the center point, with two response functions including viscosity (Y1) and solubility (Y2). From the experimental results, as shown in Table 3, quadratic regression models for viscosity and solubility were constructed as follows.
Y1 = a0 + a1 A + a2B+ a3C + a12 AB + a13 AC + a23 BC + a11 A2 + a22 B2 + a33 C2 (1)
Y2 = b0 + b1 A + b2B+ b3C + b12 AB + b13 AC + b23 BC + b11 A2 + b22 B2 + b33 C2 (2)
The desirability function algorithm was used to optimize ultrasonic conditions.21,22
Investigation of Nano-Chitin for enhancing saltiness of NaCl solution
Zeta potential of Nano-Chitin and NaCl mixtures was evaluated by preparing Nano-Chitin solutions at concentrations ranging from 30 to 150 μg/mL and mixing them with NaCl solutions at concentrations of 0.03% and 0.05%. The zeta potential of each mixture, along with a control sample containing Nano-Chitin alone in distilled water, was measured. The difference in zeta potential between the control and the NaCl-containing mixtures was used as an indicator to assess the saltiness-enhancing potential of Nano-Chitin.
To evaluate the effect of Nano-Chitin on saltiness perception, a 0.65% NaCl solution was used as the base. Nano-Chitin was added to the test samples at concentrations ranging from 70 to 110 μg/mL, while the unmodified 0.65% NaCl solution served as the control. Sensory analysis was conducted using a ranking test to assess perceived saltiness across all samples. The Nano-Chitin concentration that produced the greatest enhancement in saltiness perception was subsequently identified from the test results.23
To determine the Nano-Chitin ability in NaCl usage reducing without diminishing perceived saltiness, three NaCl solutions at concentrations of 0.61%, 0.65% and 0.69% were prepared. Nano-Chitin (at different concentration of 84 μg/mL, 90μg/mL and 120 μg/mL) was added in these solutions, and their saltiness was evaluated using a sensory ranking test, following the same procedure as previously described.
Analytical Methods
Settling time Determination
The solid fraction for measurement was dispersed in a tube containing distilled water. The mixture was allowed to settle naturally at room temperature, and the settling time was recorded upon completion of the process.24,25
Particle Size Determination
Particle size was determined by laser diffraction method.26 The samples (Nano-Chitin, post-hydrolysis products) were dispersed in water and analyzed using a laser particle size analyzer (Model LA-950V2, Horiba, Japan).
Determination of relative Viscosity
The Nano-Chitin sample was dispersed in water at a solid concentration of 1.5%, and its viscosity was measured using an Ostwald viscometer. In this method, relative viscosity was calculated as the ratio of the sample’s flow time to that of distilled water at 20 °C, expressed in°E unit.27
Characterization of chitin nanoforms
Chitin nanoform was observed using field emission scanning electron microscopy.6,7
The morphology of Nano-Chitin was analyzed using a field emission scanning electron microscope (FE-SEM, model JSM-IT800 (Jeol, Japan). The principle of the device involves directing a beam of electrons onto the sample surface, where the interaction between the electrons and the surface generates electrical signals. These signals are amplified and converted into an image displayed as contrasting light and dark areas on the screen.
Determination of solubility
Solubility was determined using a previously described method.26 An amount of 0.1–0.2 g of the sample was weighed and dispersed in 50 mL of distilled water. The dispersion was then centrifuged at 6000 rpm for 20 minutes to separate the supernatant. The collected supernatant was dried to a constant weight. Solubility (%) was calculated as the ratio of the dry solid content in the supernatant to the initial weight of the sample.
Determination of Zeta potential
A Zetasizer Nano ZS90 (Malvern Panalytical, UK) was employed to determine the zeta potential using dynamic light scattering methodology.28-30 The principle of the method involves directing a laser beam through the Nano-Chitin solution, causing the particles to scatter light in various directions. When an electric field is applied to the solution, the charged particles move in accordance with their respective charges. This movement results in a shift in the frequency of scattered light. The device analyzes the particle motion and calculates the zeta potential.
Sensory Evaluation
Sensory evaluation was conducted using the ranking test as discribed in ISO 8587:2006 with amendment 1:2013. The panel consisted of eight experts in sensory analysis who regularly participated in product evaluations and were trained to enhance their sensory performance and testing techniques. Panelists ranked the samples in ascending order of saltiness: 1, 2, 3, and 4, with 1 being the least salty and 4 the saltiest. The rankings were converted into corresponding scores based on Fisher and Yates’s method (1942): 1.03, 0.30, -0.30, and -1.03. The analysis of variance (ANOVA) was then applied to compare the samples and determine their saltiness level.23,31
Statistical Analysis
The experiments were repeated three times, with the data analysed through analysis of variance (ANOVA) and evaluated using Fisher’s criterion at a 95% confidence interval.
Results
Production of Nano-Chitin
Factors Influencing Chitin Hydrolysis by HCl
Four influencing factors were investigated including temperature, HCl concentration, hydrolysis time, and the acid solution-to-chitin ratio. The results are presented in Fig. 2.
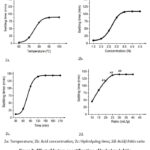 |
Figure 2: Effect of factors on settling time of hydrolyzed chitin. |
When these four factors were varied during the hydrolysis of chitin with HCl, the settling time, an indicator of the size of the resulting chitin fragments, increased until reaching a plateau range (Fig. 2). For example, when the temperature increases from 60 to 100°C, the settling time gradually increases; however, above 80°C, the increase in settling time slows down until it levels off at approximately 90 minutes (Fig. 2a). A similar trend is observed with the remaining factors (Fig. 2b, 2c, 2d). Based on the hydrolysis results, three samples with long settling times (corresponding to three different degree of hydrolysis) were selected and labelled as A1, A2, and A3 (Fig. 2d) for use in the ultrasonication treatment. The hydrolysis conditions and settling times according to 3 samples were as follows: A1 (90°C, 3.5N, 120 min, 20:1 ratio, 117 min); A2 (90°C, 3.5N, 120 min, 25:1 ratio, 137 min); and A3 (90°C, 3.5N, 120 min, 30:1 ratio, 140 min).
Factor Influencing Ultrasonication Process
Three influencing factors were investigated in the ultrasonication step: ultrasonic amplitude, sonication time, and the solvent-to-solid ratio on three samples: A1, A2, and A3. The viscosity and the relative solubility (%) of the ultrasound treated chitin are shown in Fig. 3.
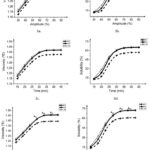 |
Figure 3: Effect of different factors on product viscosity and solubility of Nano-Chitin product. 3(a-b): Ultrasonic amplitude. 3(c-d): Sonication time; 3(e-f): Solvent/solid ratio |
Fig. 3 shows that within the investigated range, the viscosity and solubility of the product increase with ultrasound intensity, sonication time, and the solvent-to-solid ratio for all selected acid-hydrolysis intensity A1, A2 and A3. At hydrolysis intensity A1, the results for relative viscosity and solubility under various conditions were consistently lower than those observed at hydrolysis intensity A2 and A3 (Fig. 3). No clear difference was observed between the samples hydrolyzed A2 and A3 (Fig. 3). Therefore, sample with the degree of hydrolysis A2 corresponding to a settling time of 137 minutes, was selected for subsequent studies.
Table 1: Characteristics of sonicated samples
| Parameter | A21 | A22 | A23 |
| Solubility (%) | 64 | 70.67 | 72 |
| Relative viscosity (°E) | 1.415 | 1.450 | 1.455 |
| Average size (nm) | 537 | 270 | 263 |
| Zeta potential (mV) | 10.5 | 20.8 | 21.1 |
To evaluate the product’s characteristic properties, in the A2 sample series, three samples (coded A21, A22, A23) were selected with solubility and viscosity values as follows: A21 (1.415°E, 64%), A22 (1.450°E, 70.67%), and A23 (1.455°E, 72%) (Fig. 3e-f). Size and zeta potential of these samples were analyzed with the results of A21 (537 nm; 10.5 mV), A22 (270nm; 20.8mV) and A23 (263 nm; 21.1 mV). As a result, the sample A22 with a viscosity of 1.45°E exhibited a small average size (270 nm), high zeta potential (20.8 mV), and solubility (70.67%), suitable for the goal of reducing salt in food.
Optimization of Ultra-sonication Process
Using the Box-Behnken model for the three factors listed in Table 2, the experimental matrix layout and results are presented in Table 3.
Table 2: Code and value of experimental ultrasonication variables
| Variable | Code | Unit | Level | ||
| -1 | 0 | 1 | |||
| Sonication time | A | min | 30 | 35 | 40 |
| Ultrasonic amplitude | B | % | 60 | 70 | 80 |
| Solvent/solid ratio | C | mL/g | 50 | 60 | 70 |
Table 3: Experimental ultrasonication matrix and results
| Run | A | B | C | Viscosity Y1 (oE) | Solubility Y2 (%) |
| 1 | 35 | 70 | 60 | 1.451 | 70.71 |
| 2 | 35 | 60 | 70 | 1.417 | 64.74 |
| 3 | 35 | 60 | 50 | 1.383 | 57.26 |
| 4 | 30 | 70 | 70 | 1.427 | 67.32 |
| 5 | 40 | 70 | 50 | 1.418 | 65.03 |
| 6 | 35 | 80 | 50 | 1.421 | 65.41 |
| 7 | 35 | 70 | 60 | 1.451 | 70.72 |
| 8 | 35 | 70 | 60 | 1.450 | 70.67 |
| 9 | 40 | 60 | 60 | 1.416 | 64.33 |
| 10 | 35 | 80 | 70 | 1.460 | 73.11 |
| 11 | 40 | 80 | 60 | 1.458 | 72.85 |
| 12 | 30 | 60 | 60 | 1.390 | 59.23 |
| 13 | 35 | 70 | 60 | 1.448 | 70.65 |
| 14 | 30 | 70 | 50 | 1.393 | 59.89 |
| 15 | 40 | 70 | 70 | 1.459 | 72.88 |
| 16 | 35 | 70 | 60 | 1.449 | 70.66 |
| 17 | 30 | 80 | 60 | 1.426 | 67.25 |
Based on the experimental results, regression analysis was conducted for the functions Y1, Y2, with the results as presented in Table 4 and Table 5.
Table 4: ANOVA for quadratic model – viscosity (Y1)
| Source | Sum of squares | df | Mean square | F-value | p-value | |
| Model | 0.0103 | 9 | 0.0011 | 934.57 | < 0.0001 | significant |
| A | 0.0017 | 1 | 0.0017 | 1353.44 | < 0.0001 | |
| B | 0.0032 | 1 | 0.0032 | 2587.24 | < 0.0001 | |
| C | 0.0027 | 1 | 0.0027 | 2241.64 | < 0.0001 | |
| AB | 9.000E-06 | 1 | 9.000E-06 | 7.37 | 0.0300 | |
| AC | 0.0000 | 1 | 0.0000 | 10.03 | 0.0158 | |
| BC | 6.250E-06 | 1 | 6.250E-06 | 5.12 | 0.0582 | |
| A² | 0.0006 | 1 | 0.0006 | 467.86 | < 0.0001 | |
| B² | 0.0010 | 1 | 0.0010 | 844.30 | < 0.0001 | |
| C² | 0.0008 | 1 | 0.0008 | 666.04 | < 0.0001 | |
| Residual | 8.550E-06 | 7 | 1.221E-06 | |||
| Lack of Fit | 1.750E-06 | 3 | 5.833E-07 | 0.3431 | 0.7969 | Not significant |
Table 5: ANOVA for quadratic model – solubility (Y2).
| Source | Sum of Squares | df | Mean Square | F-value | p-value | |
| Model | 397.71 | 9 | 44.19 | 59715.72 | < 0.0001 | significant |
| A | 57.24 | 1 | 57.24 | 77358.11 | < 0.0001 | |
| B | 136.62 | 1 | 136.62 | 1.846E+05 | < 0.0001 | |
| C | 115.98 | 1 | 115.98 | 1.567E+05 | < 0.0001 | |
| AB | 0.0625 | 1 | 0.0625 | 84.46 | < 0.0001 | |
| AC | 0.0441 | 1 | 0.0441 | 59.59 | 0.0001 | |
| BC | 0.0121 | 1 | 0.0121 | 16.35 | 0.0049 | |
| A² | 13.77 | 1 | 13.77 | 18609.80 | < 0.0001 | |
| B² | 36.85 | 1 | 36.85 | 49802.12 | < 0.0001 | |
| C² | 28.32 | 1 | 28.32 | 38271.65 | < 0.0001 | |
| Residual | 0.0052 | 7 | 0.0007 | |||
| Lack of Fit | 0.0013 | 3 | 0.0004 | 0.4467 | 0.7330 | Not significant |
The significance of the regression coefficients and the model’s goodness-of-fit were evaluated using regression analysis (Tables 4 and 5). The F- values of the two models were 934.57 (Y1) and 59715.72 (Y2), respectively, showing that the model was entirely statistically significant with a confidence level of 99.99% (p<0.0001).
The F values for the incompatibility of the model Y1 and Y2 were of 0.3431 (p=0.7969); 0.4467 (p=0.733), respectively; in addition, the multiple correlation coefficient (R2) of the two models is 0.9992; 1.0 respectively, showing that the simulation model is correct with the experiment. Thus, the viscosity and solubility of the product can be represented by the second-order model as follows:
Y1 = 1.45 +0.0144A+0.0199B+0.0185C+0.0015AB+0.0018AC+0.0012BC-0.0117A2 – 0.0157B2 – 0.0139C2 (3)
Y2= 70.68+2.67A+4.13B+3.81C+0.125AB+0.105AC+0.055BC-1.81A2-2.96B2-2.59C2 (4)
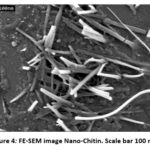 |
Figure 4: FE-SEM image Nano-Chitin. Scale bar 100 nm. |
The statistical software Design-Expert 11.1 was used with the ‘desirability function’ algorithm proposed by Derringer and Suich to optimize the ultrasonic process and resulted in the optimal conditions including: ultrasonic amplitude of 77%, a duration of 34 minutes, and a solvent/solid ratio of 67 mL/g. These optimal conditions were experimental validated. The results showed that Nano-Chitin has a rod shape (Fig. 4), an average size of 248 nm (determined by laser diffraction), a solubility of 73.10% (compared to predicted value of 73.08 %), and a zeta potential of 24.5 mV.
Investigation of Nano-Chitin for enhancing saltiness of NaCl solution
Zeta potential of Nano-Chitin solutions at varying concentrations are illustrated in Fig. 5. The results show that the zeta potential of the Nano-Chitin solution increased sharply as the Nano-Chitin concentration rises from 30 μg/mL to 70 μg/mL. When the concentration increased from 70 μg/mL to 90 μg/mL, the zeta potential continued to increase but at a slower rate. Beyond this point, further increases in Nano-Chitin concentration do not lead to any significant change in zeta potential (Fig. 5).
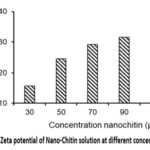 |
Figure 5: Zeta potential of Nano-Chitin solution at different concentrations |
Based on these findings, concentrations of 70, 90 and 150 μg/mL were selected for study the changes in zeta potential when NaCl was added Nano-Chitin solution.
Fig. 6 shows the zeta potential measured for pure Nano-Chitin and Nano-Chitin-NaCl mixtures. The presence of NaCl in the solution mixture led to a decrease in zeta potential. A NaCl concentration of 0.05% caused a greater reduction in zeta potential compared to a concentration of 0.03%.
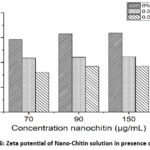 |
Figure 6: Zeta potential of Nano-Chitin solution in presence of NaCl |
Effect of Nano-Chitin on saltiness perception: Samples comprising NaCl solutions with added Nano-Chitin, and control samples were prepared and evaluated for saltiness using a sensory evaluation method based on ranking tests. The converted scores were analysed using analysis of variance, as shown in Table 6
Table 6: Effect on saltiness perception of Nano-Chitin.
| Samples | NaCl 0.65% | NaCl 0.65%
+ Nano-Chitin 70 μg/ml |
NaCl 0.65%
+ Nano-Chitin 90 μg/ml |
NaCl 0.65%
+ Nano-Chitin 110 μg/ml |
| Average* | 0.67a | 0.5a | -0.5b | -0.67b |
*The letters assigned to the exponents of the mean values indicate differences between those values.23
Table 6 shows that Nano-Chitin at a concentration of 90 μg/mL significantly enhances the perception of saltiness in a 0.65% NaCl solution. Nano-Chitin at a concentration of 110 μg/mL exhibits a similar saltiness-enhancing effect as the 90 μg/mL concentration.
The saltiness perception to NaCl solutions at concentrations of 0.61%, 0.65% and 0.69% (which are typical salt levels found in human food) supplemented with varying concentrations of Nano-Chitin was compared to each other and to the control samples (pure NaCl solutions). The converted scores from the ranking test were analysed using analysis of variance, as shown in Table 7.
Table 7: The saltiness perception level of the NaCl solutions in presence of Nano-Chitin.
| Samples | NaCl 0.61% | NaCl 0.65% | NaCl 0.69% | NaCl 0.65%
+ Nano-Chitin 90 μg/ml |
NaCl 0.65%
+ Nano-Chitin 120μg/ml |
NaCl 0.61%
+ Nano-Chitin 84 μg/ml |
| Average* | 1.27 e | 0.48c | -0.55d | -0.69d | -0.87d | 0.37c |
*The letters assigned to the exponents of the mean values indicate differences between those values.23
The results in Table 7 indicated that Nano-Chitin at a concentration of 90 μg/mL enhances the saltiness of a 0.65% NaCl solution to a level equivalent to that of a 0.69% NaCl solution. However, increasing the concentration of Nano-Chitin to 120 μg/mL does not further enhance the saltiness effect.
At a concentration of 84 μg/mL, Nano-Chitin enhances the saltiness of a 0.61% NaCl solution to a level equivalent to that of a 0.65% NaCl solution.
Discussion
The findings from our study on Nano-Chitin formation align with established scientific principles. During the hydrolysis stage, factors such as temperature, duration, acid concentration, and the acid-to-chitin ratio all demonstrated a clear influence on the extent of chitin hydrolysis. Within the investigated range, increasing these factors led to a rise in settling time, indicating improved hydrolysis efficiency (Fig. 2). A significant increase in settling time was observed at a temperature of 90°C, an acid concentration of 3.5N, a hydrolysis time of 120 minutes, and a solvent/chitin ratio of 25/1. After that, further increases in these factors resulted in only a slight change in settling time. This may be due to the influence of temperature, acid concentration, hydrolysis time, and solvent/chitin ratio on the hydrolytic cleavage of chitin fibres. Accordingly, at higher temperatures, greater acid concentrations, longer hydrolysis times, and higher acid solution-to-chitin ratios, the hydrolysis reaction occurs more intensively. However, once a certain threshold is reached, the reaction rate no longer increases. Perhaps, chitin possesses a highly crystalline structure (especially in the α-chitin form), where polymer chains are tightly packed through intra- and intermolecular hydrogen bonds. This compact arrangement hinders the penetration of hydrolytic agents such as HCl into the deeper regions of the structure. During hydrolysis, the amorphous regions are degraded first, while the crystalline domains remain resistant.
During ultrasonic processing, increases in ultrasonic amplitude, treatment duration, and the solvent/solid ratio led to higher viscosity and solubility, reduced particle size, and improved efficiency in Nano-Chitin formation (Fig. 3). This behavior may be attributed to the enhanced capacity of the hydrolyzed product to absorb ultrasonic energy under these conditions. As a result, the disruption of molecular structure becomes more favorable, leading to smaller particle sizes and a more efficient production of Nano-Chitin with finer dimensions.32
Our research results are consistent with previously published findings. For instance, Dufresne et al.1 produced Nano-Chitin with an average length of 240 nm from crab shell chitin; Pereira et al.20 obtained Nano-Chitin from crab shells with an average length of 214 nm; Meshkat et al.33 synthesized Nano-Chitin from shrimp shells with a length of 300 nm, and Jung et al.18 also produced Nano-Chitin from shrimp shells with an average length of 300 nm. According to Naiu et al.,26 Nano-Chitin has an average size of 185.4 nm to 319.3 nm and solubility ranges from 68.92% to 71.72%. However, our research product exhibits higher solubility (73.1%), with Nano-Chitin having a clear rod shape and a zeta potential of 24.5 mV, which characterizes its ion absorption ability. Furthermore, our study has specifically determined the parameters of the ultrasonic process, which were not disclosed in the author’s research.
Zeta potential analysis of the Nano-Chitin solution revealed that at low concentrations, the zeta potential was minimal. As the concentration of Nano-Chitin increased, the zeta potential also rose. Within the concentration range of 70 to 150 μg/mL, the zeta potential remained high but increased only slightly. This can be explained by the fact that, at low concentrations, the molecular density is low, resulting in fewer functional groups capable of carrying charge, and therefore a lower zeta potential. As the concentration of Nano-Chitin increases, the number of these charged functional groups also rises, leading to an increase in zeta potential. However, once a specific concentration is reached, further increases cause the functional groups to undergo more complex interactions with surrounding molecules, which limits any substantial rise in zeta potential.29,32,34
When NaCl was added to the Nano-Chitin solution, the zeta potential of the mixture decreased compared to the control Nano-Chitin solution. This suggests that Nano-Chitin, having positive charge groups such as NH3+ interacts with Cl⁻ ions, resulted in the decreasing the surface potential. This zeta potential descreas was observed more in presence of NaCl concentration of 0.05% compared to 0.03%. These findings demonstrate the potential of Nano-Chitin to interfere the interaction of Cl– on Na+, thus “free” more Na+ ions and enhance the saltiness perception. The results are consistent with previous studies.29,32
The study results showed that Nano-Chitin at a concentration of 90 μg/mL enhanced the perceived saltiness of a 0.65% NaCl solution to a level comparable to that of a 0.69% NaCl solution (without Nano-Chitin). Similarly, at 84 μg/mL, Nano-Chitin elevated the saltiness of a 0.61% NaCl solution to match that of a 0.65% NaCl solution (Table 6). Our findings align with previously published studies29,34,35 confirming that Nano-Chitin has saltiness-enhancing capabilities. At a concentration of 80 μg/mL, several authors reported that Nano-Chitin enhanced the saltiness of a 0.3% NaCl solutions.29,34,35 In our study, results indicated that Nano-Chitin enhances the saltiness of NaCl solutions at concentrations of 0.61% and 0.65%. On the other word, the presence of Nano-Chitin can enhance the saltiness of NaCl solutions, suggest that the NaCl usage can be reduced to reach the target saltiness. These findings would practical applications in food processing.
Conclusion
The study demonstrates that purified chitin from white leg shrimp can be processed into Nano-Chitin using a hydrolysis-ultrasound method. The raw chitin was ground and hydrolyzed at 90°C in a 3.5N HCl solution, with a solution-to-chitin ratio of 25:1 for 120 minutes. After hydrolysis, the acid was removed by washing, followed by ultrasound treatment at an amplitude of 77% for 34 minutes, using a solvent/solid ratio of 67 mL/g. The final product was obtained by freeze-drying.
The obtained Nano-Chitin had average size of 248 nm, high solubility (73.10%), and a high surface charge (24.5 mV). At a concentration of 90 μg/mL, the Nano-Chitin enhanced the saltiness of a 0.65% NaCl solution to a level equivalent to that of a 0.69% NaCl solution. At a concentration of 84 μg/mL, the Nano-Chitin enhanced the saltiness of a 0.61% NaCl solution to a level equivalent to that of a 0.65% NaCl solution.
These findings suggested that Nano-Chitin could be applied as a saltiness enhancer in food, offering a potential solution for reducing salt intake in diets. However, reducing salt content by adding Nano-Chitin may also affect the structure of food products, therefore, Nano-Chitin can be further studied for its gel-forming ability, film-forming capacity, and antimicrobial properties to broaden its potential applications in the food industry.
Acknowledgement
The authors gratefully acknowledge the support of the Key Laboratory of Veterinary Biotechnology and the BSL-3 Laboratory, Faculty of Veterinary Medicine, Vietnam National University of Agriculture, for access to laboratory equipments.
Funding Sources
The author(s) received no financial support for the research, authorship, and/or publication of this article.
Conflict of Interest
The authors do not have any conflict of interest.
Data Availability Statement
The data that support the findings of this study are available from the corresponding author upon reasonable request
Ethics Statement
This research did not involve human participants, animal subjects, or any material that requires ethical approval.
Informed Consent Statement
This study did not involve human participants, and therefore, informed consent was not required.
Clinical Trial Registration
This research does not involve any clinical trials.
Permission to Reproduce Material from Other Sources
Not applicable
Author Contributions
- Nguyen-Thi Cha: Methodology, Investigation, Writing – Original Draft.
- Ho-Phu Ha: Methodology, Manuscript editing.
- Tien-Thanh Nguyen: Methodology, Supervision, Revision and Submission
References
- Gopalan Nair K., Dufresne A. Crab shell chitin whisker reinforced natural rubber nanocomposites. Processing and swelling behavior. Biomacromolecules. 2003; 4(3): 657-665. DOI: https://doi.org/10.1021/bm020127b
CrossRef - Kandra P., Challa M. M., Kalangi Padma Jyothi H. Efficient use of shrimp waste: present and future trends. Appl Microbiol Biotechnol. 2012; 93(1): 17-29. DOI: 10.1007/s00253-011-3651-2
CrossRef - Azuma K., Ifuku S. Nanofibers based on chitin: A new functional food. Pure Appl Chem. 2016; 88(6): 605-619. DOI: https://doi.org/10.1515/pac-2016-0504
CrossRef - Jiang W. J., Tsai M. L., Liu T. Chitin nanofiber as a promising candidate for improved salty taste. LWT-Food Sci Technol. 2017; 75: 65-71. DOI: https://doi.org/10.1016/j.lwt.2016.08.050
CrossRef - Ngasotter S., Sampath L., Xavier K. M. Nano-Chitin: An update review on advances in preparation methods and food applications. Carbohydr Polym. 2022: 119627. DOI: https://doi.org/10.1016/j.carbpol.2022.119627
CrossRef - Ifuku S., Nogi M., Abe K., et al. Preparation of Chitin Nanofibers with a Uniform Width as α-Chitin from Crab Shells. Biomacromolecules. 2009; 10(6): 1584-1588. DOI: https://doi.org/10.1021/bm900163d
CrossRef - Ifuku S., Nogi M., Yoshioka M., et al. Fibrillation of Dried Chitin into 10–20nm Nanofibers by a Simple Grinding Method Under Acidic Conditions. Carbohydr Polym. 2010; 81(1): 134-139. DOI: https://doi.org/10.1016/j.carbpol.2010.02.006
CrossRef - Ifuku S., Nomura R., Morimoto M., et al. Preparation of Chitin Nanofibers from Mushrooms. Materials. 2011; 4(8): 1417-1425. DOI: https://doi.org/10.3390/ma4081417
CrossRef - Salaberria A. M., Fernandes S. C., Diaz R. H., et al. Chitin Nanocrystals and Nanofibers as Nano-Sized Fillers into Thermoplastic Starch-Based Biocomposites Processed by Melt-Mixing. Chem Eng J. 2015; 116: 286-291. DOI: https://doi.org/10.1016/j.cej.2014.07.009
CrossRef - Fan Y., Saito T., Isogai A. TEMPO-Mediated Oxidation of β-Chitin to Prepare Individual Nanofibrils. Carbohydr Polym. 2009; 77(4): 832-838. DOI: https://doi.org/10.1016/j.carbpol.2009.03.008
CrossRef - Jiang J., Ye W., Yu J., et al. Chitin Nanocrystals Prepared by Oxidation of α-Chitin Using the O₂/Laccase/TEMPO System. Carbohydr Polym. 2018; 189: 178-183. DOI: https://doi.org/10.1016/j.carbpol.2018.01.096
CrossRef - Lu Y., Weng L., Zhang L. Morphology and Properties of Soy Protein Isolate Thermoplastics Reinforced with Chitin Whiskers. Biomacromolecules. 2004; 5(3): 1046-1051. DOI: https://doi.org/10.1021/bm034516x
CrossRef - Ngasotter S., Meitei M. M., Xavier K. M., et al. Global trends and perspectives in Nano-Chitin research: A comprehensive review of types, properties, applications, and scientometric analysis. Int J Biol Macromol. 2025: 144438. DOI: https://doi.org/10.1016/j.ijbiomac.2025.144438
CrossRef - Bai L., Liu L., Esquivel M., et al. Nano-Chitin: chemistry, structure, assembly, and applications. Chem Rev. 2022; 122(13): 11604-11674. DOI: https://doi.org/10.1021/acs.chemrev.2c00125
CrossRef - Liem D. G., Miremadi F., Keast R. S. J. Reducing Sodium in Foods: The Effect on Flavor. Nutrients. 2011; 3(6): 694-711. DOI: https://doi.org/10.3390/nu3060694
CrossRef - Webstera J. L., Dunforda E. K., Hawkesb C., et al. Salt Reduction Initiatives Around the World. J Hypertens. 2011; 29(6): 1043-1050. DOI: https://doi.org/10.1097/HJH.0b013e328345ed83
CrossRef - Revel J. F., Marchessaultf R. H. In Vitro Chiral Nematic Ordering of Chitin Crystallites. Int J Biol Macromol. 1993; 15(6): 329-335. DOI: https://doi.org/10.1016/0141-8130(93)90049-R
CrossRef - Jung H. S., Kim M. H., Park W. H. Preparation and Structural Investigation of Novel β-Chitin Nanocrystals from Cuttlefish Bone. ACS Biomater Sci Eng. 2019; 5(4): 1744-1752. DOI: https://doi.org/10.1021/acsbiomaterials. 8b01652
CrossRef - Ni Y., Jing Y., Jiang Q., Gao R. Combination of starch and nano‐chitin whiskers for surface treatment of cellulosic paper. Starch‐Stärke. 2021; 73(5-6): 2000219. DOI: https://doi.org/10.1002/star.202000219
CrossRef - Pereira A. G., Muniz E. C., Hsieh Y. L. Chitosan-Sheath and Chitin-Core Nanowhiskers. Carbohydr Polym. 2014; 107: 158-166. DOI: http://dx.doi.org/10.1016/j.carbpol.2014.02.046
CrossRef - Montgomery D. C. Design and Analysis of Experiments. 8th ed. Hoboken, NJ: John Wiley & Sons; 2017. DOI: https://doi.org/10.1002/qre.458
CrossRef - Derringer G., Suich R. Simultaneous optimization of several response variables. J Qual Technol. 1980; 12(4): 214-219. DOI: https://doi.org/10.1080/00224065.2018.1404886
CrossRef - Tu H. D. Sensory Analysis Techniques. Ha Noi: Bach khoa Publishing House; 2006.
- Bin N. Processes and Equipment in Chemical and Food Technology. Volume 2. Ha Noi: Ha Noi: Science and Technology Publishing House; 2004.
- Le V. V. M., Lai Q. D., Nguyen T. H., et al. Food Processing Technology. 2nd ed. Ho Chi Minh City Publishing House; 2011.
- Naiu A. S., Berhimpon S., Montolalu R. I., et al. The effect of hcl-thermal pressure hydrolysis and high-speed destruction of chitin on particle size distribution and functional group of nano-chitin compound. Curr Res Nutr Food Sci Jour. 2020; 8(1): 197-205. DOI: http://dx.doi.org/10.12944/CRNFSJ.8.1.18
CrossRef - Harangus K., Kakucs A. Mass-Measurement-based Automatization of the Engler-Viscometer. Acta Polytech Hung. 2021; 18(5): 77-92. DOI:12700/APH.18.5.2021.5.6
CrossRef - Goodrich J. D., Winter W. T. α-Chitin Nanocrystals Prepared from Shrimp Shells and Their Specific Surface Area Measurement. Biomacromolecules. 2007; 8(1): 252-257. DOI: https://doi.org/10.1021/bm0603589
CrossRef - Tsai W. C., Wang S. T., Chang K. L. B., et al. Enhancing Saltiness Perception Using Chitin Nanomaterials. Polymers. 2019; 11(4): DOI: https://doi.org/10.3390/polym11040719
CrossRef - Li Z., Wang H., An S., Yin X. Nano-Chitin Whisker Enhances Insecticidal Activity of Chemical Pesticide for Pest Insect Control and Toxicity. J Nanobiotechnol. 2021; 19: 1-13. DOI: https://doi.org/10.1186/s12951-021-00792-w
CrossRef - ISO8587:2006. Sensory analysis – Methodology – Ranking. Vietnam Institute of Standards and Quality (VISQ); 2013 https://tieuchuan.vsqi.gov.vn/tieuchuan/view?sohieu=TCVN+11183%3A2015
- Somsak P., Sriwattana S., Prinyawiwatkul W. Ultrasonic-Assisted Chitin Nanoparticle and Its Application as Saltiness Enhancer. Int J Food Sci Technol. 2021; 56(2): 608-617. DOI: https://doi.org/10.1111/ijfs.14715
CrossRef - Meshkat S. S., Nezhad M. N., Bazmi M. R. Investigation of Carmine dye removal by green chitin nanowhiskers adsorbent. Emerg Sci J. 2019; 3: 187-194. DOI: http://dx.doi.org/10.28991/esj-2019-01178
CrossRef - Jiang W. J., Tsai M. L., Liu T. Chitin Nanofiber as a Promising Candidate for Improved Salty Taste. LWT-Food Sci Technol. 2017; 75: 65-71. DOI: https://doi.org/10.1016/j.lwt.2016.08.050
CrossRef - Hsueh C. Y., Tsai M. L., Liu T. Enhancing Saltiness Perception Using Chitin Nanofibers When Curing Tilapia Fillets. LWT-Food Sci Technol. 2017; 86: 93-98. DOI: https://doi.org/10.1016/j.lwt.2017.07.057
CrossRef
Accepted on: 19 Aug 2025
Second Review by: Endah Puspitojati
Final Approval by: Dr. Prasad Shekhar Variyar


Web of Science Coverage
Emerging Sources Citation Index (ESCI)
2024 Journal Impact Factor: 1.1
Scopus Journal Metrics
CiteScore 2024: 1.9
CiteScore Details
Sustainable Nutrition: Food Systems, Nutrient Retention, and Public Health Impact
![]()
This journal is a member of, and subscribes to the principles of, the Committee on Publication Ethics (COPE)


