Physicochemical and Nutritional Characterization of Jamun (Syzygium Cuminii)
 , ,
, , 1Food Process Engineering Department, National Institute of Technology, Rourkela, Odisha, India
2Division of Food Science and Post-harvest Technology, IARI, New Delhi, India.
Corresponding author Email: pradhanrc@nitrkl.ac.in
DOI : http://dx.doi.org/10.12944/CRNFSJ.5.1.04
Download this article as:
![]()
Jamun (Syzygium cuminii) is an important minor fruits in India. Minor fruits are good source of nutrition and pharmaceuticals properties. Among all minor fruits Jamun is highly perishable but nutritious. It is mainly used for diabetes patients and in the pharmaceuticals industries. It is a good source of anthocyanin, effective against the analgesic properties. There is no proper data available for the Indian Jamun. The fruit is having a very good market value, but due to its unavailability and perishability it is still unexploited. Physicochemical, mechanical and sensory properties had been investigated for Jamun fruit as well as seed in this paper for further use and storage. Weight of the whole fruit was 8.99±1.89gm whereas the seed weight was 1.64±0.21gm. In case of mechanical property whole fruit can be penetrated up-to 4.1mm whereas, at the same load for seed it can penetrate up-to 2.53mm. Purple colour for pulp, juice and whole fruit was -9.7, -0.9, and -0.76 respectively. High amount of polyphenol (203.76±9.84, 386.51±10.25) tannin (94.52±9.19, 388.99±7.34) and anthocyanin (195.58±6.15, 18.47±1.99) present in both fruit and seed. In case of minerals, presence of K, Ca and Na are significant. In case of sensory analysis mouthfeel and colour was good compared to market sample. This study is helpful for the postharvest processing, machine designing and for further analysis of Jamun.
KEYWORDS:Jamun fruits; Jamun seed; Physicochemical properties; Mechanical properties; Colour; Sensory analysis
Introduction
Among several tropical fruits in India, Jamun (Syzygium cuminii), a potentially important indigenous minor commercial fruit as well as have high medicinal uses. This species is endemic to South East Asia and India, but also reported to be grown in Hawaii, Australia, Philippines Kenya, Florida etc. There is no standard cultivar of Jamun. Jamun is harvested in monsoon season and its harvesting time is short and limits for 30–40 days. Jamun is dark purple in colour and its shape is oval. Fruit is generally fleshy and having a hard seed inside. The tree, fruits once in a year and the berries are sweetish sour in taste. Jamun is having higher amount of antioxidants when compared to the other seasonal fruits like papaya, sapota, guava and banana. Not only antioxidants jamun is having high amount of vitamins, tannin and anthocyanins. Each part of jamun fruit holds its significant values. Whole fruit is used for extracting juice or to prepare jam, jelly, squash etc. whereas seeds having its own medicinal value for curing diarrhoea and diabetics.1
Jamun undergoes huge losses during cultivation, harvesting and processing because of its unorganized processing and since jamun is perishable in nature it multiplies the losses during storage. The fruit can be stored for few days (1-2 days) at normal temperature whereas it can be stored for 3 weeks at 85 – 95 % when precooled and packed into perforated polythene bags. In recent studies, the main concern is on medicinal properties of various food product from Jamun,1 separation and concentration of anthocyanin content,2 purification of anthocyanin from Jamun juice,3 phytochemical constituents and its uses.4
Jamun seeds are used for antimicrobial treatment5 antioxidant activity6 which helps in vivo studies related to skin cancer7 gastro intestinal problem.8 The major research with Jamun seed had been done for the treatment of diabetic. It has an antidiabetic property9 hypolipidemic property10 cardioprotective property11 immunomodulatory property12 neuro-psychopharmacological property.13
Physical properties are very important in designing of machines to determine the performance of the equipment for unit operations like grading, cleaning and separating. Size of the fruit (length, breadth and thickness) an shape are core features in machine designing especially used for separation, pulping and deseeding. Aspect ratio and sphericity are used to define shape and also impacts on flow characteristics of products. According to Kachroo et al., and Dash et al.,14,15 the density and 100 seed weight are necessary for designing the drying equipment, storage units and for transport industry.
There is no systematic study on the physical, mechanical, chemical and sensory properties of Jamun fruit, seed and pulp. Research has proved that basic physical properties have significant importance in designing and processing of machines.16 These properties governs the control of machine and also decides the characterization of output.
Material and Methods
Sample
The fruits were proclaimed from local fruit market of Rourkela, Odisha (located at 84.54 E longitude and 22.12 N latitude) India. The rotten and unripe samples were discarded and fresh and ripe jamun fruits were selected after cleaning. Once the cleaning and sorting is done, the samples were packed in PE bags and shifted in deep freezer for storage. The storage of samples were done at -200 C.17 This will prevent the spoilage of the samples as it is perishable. Before experiments, samples are taken out from deep freezer and thawed for 3 hrs. For making juice the fruits were deseeded manually and the juice was extracted from de-pulped Jamun in a juice extractor. The grinded pulp was passed through muslin cloth for obtaining clear juice.
Physical Property
All physical properties of Jamun fruit and seed were determined using 100 repetitions at its initial moisture content of 79.21% (wb) and 52.24% (wb) respectively. Inner most part of the fruit is seed and outer part is edible matter. Whole fruit weight as well as edible and non- edible part was also weighted.
Digital vernier calipers ( 0.01 cm least count) was used to measeure the principal dimensions, i.e. length (l), width (w), thickness (t) of the fruits and the seeds. From these dimensions, Arithmetic Mean (AM) and Geometric Mean (GM) was calculated by the given formula.18
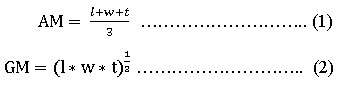
The Jamun fruit and seed volume was measured by water displacement method.19 If (A) is the initial volume of water; (B) is the final volume and is the total number of fruits (N) then volume can be calculated as
![]()
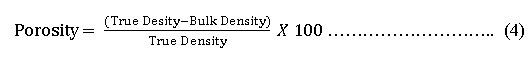
Bulk density was determined as the ratio of the mass of fruit to the solid volume occupied by the fruit20 and true density was determined by the ratio of the mass of sample to its true volume using toluene displacement method. Porosity was determined by the relationship given by18 as follows
The coefficient of friction (static) was obtained on material surface namely glass, iron, plastic, etc. The tangent of the angle of friction was the coefficient of friction which was determined using following relationship, where the coefficient of friction and θ is the tilt angle, degree
μ = tan θ (5)
Yield Determination
Percentage Consumable Matter
Randomly whole riped Jamun was taken and weight was measured. Fruits were deseeded manually to get the pulp.19 Then the weight of the pulp was measured. The percentage of consumable matter was calculated by the given formula

Percentage Juice content
The consumable part of the fruit (pulp) was weighted and known amount was taken for blending. The blended homogenized pulp was passed through a set of muslin cloth to separate the solid particles. The juice19 was collected in a measuring cylinder and percentage of juice content was given as follows:

Colour
Colour measurements were performed by colorimeter (Spectro Guide BYK model, Germany). Black and white tiles were used to standardize the instrument and the measurement was expressed in brightness/darkness (L), redness/greenness (a) and yellowness/blueness (b) values for fruit and pulp.
Mechanical Properties
Texture profile of Jamun Fruit were measured using CT3 texture analyser [probe: cylinder probe (TA39, 2 mm D, 20mm L), pre-test speed: 1.00 mm/s, test speed: 0.50 mm/s, post- test speed: 0.5 mm/s; load cell: 10000g]. The resistance of the material to these force is measured by a calibrated load cell and results were shown in either grams or Newton.21 The compression test was performed with the previous operating conditions mentioned above, for five replications. The whole fruit was kept on the base round table for providing quick and easy height adjustment to accommodate the sample and allowed to penetrate the probe inside the sample. The results were taken from the installed Texture Pro CT Software.
Chemical properties
Moisture and ash content was determinded by AOAC,1990.22 Digital Abbe type refractometer was used to detrmine the total soluble sugar (TSS) and expressed as degree Brix (0B). Total disolve solid was measured by TDS meter (HM Digital, TDS-3) and expressed as ppm. The pH was estimated with the help of a Elico pH meter. The viscosity of juice was determined using a U-Tube capillary viscometer (Zenith Glassware, Kolkata, India) at room temperature (30 ±10C). The unit of measurement used for viscosity was mPa.s.
For measuring the Total solid percent, 5ml of the sample was poured into a Petri plate. The weight of the empty and filled Petri plates were denoted as (Wp) and (Ws) respectively. Then the samples with Petri plates were kept into hot air oven at 100 °C for 24 hours. The final weight of the dried sample along with the petridish (Wd) was recorded.
![Colour Colour measurements were performed by colorimeter (Spectro Guide BYK model, Germany). Black and white tiles were used to standardize the instrument and the measurement was expressed in brightness/darkness (L), redness/greenness (a) and yellowness/blueness (b) values for fruit and pulp. 2.5 Mechanical Properties Texture profile of Jamun Fruit were measured using CT3 texture analyser [probe: cylinder probe (TA39, 2 mm D, 20mm L), pre-test speed: 1.00 mm/s, test speed: 0.50 mm/s, post- test speed: 0.5 mm/s; load cell: 10000g]. The resistance of the material to these force is measured by a calibrated load cell and results were shown in either grams or Newton [21]. The compression test was performed with the previous operating conditions mentioned above, for five replications. The whole fruit was kept on the base round table for providing quick and easy height adjustment to accommodate the sample and allowed to penetrate the probe inside the sample. The results were taken from the installed Texture Pro CT Software. 2.6 Chemical properties Moisture and ash content was determinded by AOAC,1990 [22]. Digital Abbe type refractometer was used to detrmine the total soluble sugar (TSS) and expressed as degree Brix (0B). Total disolve solid was measured by TDS meter (HM Digital, TDS-3) and expressed as ppm. The pH was estimated with the help of a Elico pH meter. The viscosity of juice was determined using a U-Tube capillary viscometer (Zenith Glassware, Kolkata, India) at room temperature (30 ±10C). The unit of measurement used for viscosity was mPa.s. For measuring the Total solid percent, 5ml of the sample was poured into a Petri plate. The weight of the empty and filled Petri plates were denoted as (Wp) and (Ws) respectively. Then the samples with Petri plates were kept into hot air oven at 100 °C for 24 hours. The final weight of the dried sample along with the petridish (Wd) was recorded.](http://www.foodandnutritionjournal.org/wp-content/uploads/2017/04/Vol5_No1_Phy_PAY_F8.jpg)
Carbohydrate content was determined by difference to 100% of main constituents (Fibre, ash, protein and fat).23 Total sugar was estimated by Lane and Eynon’s method reported (1934)24 with the help of Fehling’s solution A and B. Titrable acidity was determined as described by Gould, 1978. Fat was determined using soxhlet apparatus with the help of solvent extraction method(AOAC, 2000).22 Protein content was determined by Kjeldahl method, using nitrogen conversion factors 6.25 for juice and seed powder (AOAC, 2000). Analysis for Vitamin C was done using the 2, 6-dichloroindophenol titrimetric method (AOAC, 2000).
Pectin Content/Alcohol insoluble solids (AIS)
Pectin content was measured using alcohol. 10 g of juice was taken and 150 ml alcohol (80%) was added into it. Then the mixture was stirred, boiled and slowly simmered for half an hour. For separating the residue and the filtrate Whatman filter paper No 1 was used. The process continues till it became colourless. Then the filter paper with alcohol insoluble solids were dried at 1000C for 2 hr. Finally it was cooled down and calculated (% w/w) as the following equation.25
AIS= (weight of residue/weight of sample taken for estimation) x100
Total Phenol
The total phenolic content of Jamun fruits and seeds were determined spectrophotometrically at 765 nm following the Folin-Ciocalteu method as described by Singleton et al., (1999).26 Gallic acid (Merck, Germany) was used to make the standard calibration curve using the concentration range 1–500 mg/L. The results are expressed as milligrams of Gallic acid equivalents per 100 g of fruit.
Antioxidant Activity against DPPH
The DPPH (2,2-diphenyl-1-picrylhydrazyl) radical scavenging activity of juice and seed powder were determined according to the methods of Brand-William.27 2 g sample was taken in 25 ml ethanol and was kept overnight in dark at room temperature for extraction. Then to 0.2 ml of eluted extract, 1 ml of DPPH solution (80 μg/ml ethanol) was added and blank was maintained taking 0.2 ml distilled water and 1 ml DPPH solution. Both were kept at room temperature for 30 minutes. The absorbance was taken at 517 nm (UV–1800 spectrophotometer (Shimadzu, Japan), and initially spectrophotometer reading was set to zero using ethanol. The percentage of inhibition was calculated against blank.

Whereas; Ablank= absorbance of blank, Asample = absorbance of sample.
Total anthocyanin content
pH-differential method using two buffer systems [potassium chloride buffer, pH 1 (0.025 M) and sodium acetate buffer, pH4.5 (0.4 M)] was used to determine the total anthocyanin content.28 UV-Visible spectrophotometer (Systronics, India) was used to measure the absorbance at 510 and 700nm. The anthocyanin content was expressed as cyanidin 3-glucoside (Cyd 3-glu) per kg FW, using an extinction coefficient (e) of 26,900L cm-1mol-1 and a molecular weight of 449.2 g mol-1
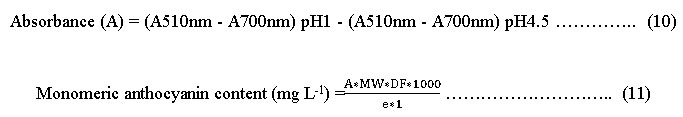
Where,
A = absorbance, MW = molecular weight (449.2), DF = dilution factor, e = molar absorptivity (26,900).
Mineral analysis
The first step for mineral content determination was digestion of the sample (0.5g) in concentrated HNO3 (AOAC 2000).22 Then 50 ml volumetric flask was used for further analysis and digested sample was mixed with water and volume make up was done. Microwave Plasma-Atomic Emission Spectrometer (Agilent 4100 MP-AESsystem, USA) was used for mineral analysis against respective aqueous standards and was expressed as mg /100g.
Sensory Analysis
Sensory analysis had been done with the help of nine point hedonic scale.21 20 testers had been selected for two different sample (Raw sample, market sample [Jamun Kala Khatta Juice, Paper Boat]). At each session, approximately 50mL per juice was evaluated, at temperatures between 20-250 C.
Results and Discussions
Physical parameter
Shape index of Jamun fruit was found as ‘elliptical’. The colour of whole Jamun fruit was blackish purple. Table 1 represents the physical properties of Jamun fruit as well as seed. Weight of the whole fruit was 8.99±1.89gm whereas the seed weight was 1.64±0.21gm. The market value of the fruit depends on the weight and the colour of the fruit. The maturity of the fruit was determined by the dimension of the fruit. To find that weather the fruit is matured or not the fruit passes through a ring of particular dimension. The whole fruit length, width and thickness was 28.1±0.31, 22.7±0.14, 20.8±0.21 mm respectively and in case of seed 22.5±0.23,10.9±0.11, 10.5±0.09 mm respectively.
Table 1: Physical properties of Jamun Fruit and Seed
| Physical Property | Whole Fruit | Jamun Seed |
| Weight (gm) | 8.99±1.89 | 1.64±0.21 |
| Volume (m3) | 8.73 X 10⁻⁶±1.03 | 1.13 X 10⁻⁶±0.23 |
| True Density (kg/m3) | 1070±0.15 | 1450±0.22 |
| Bulk Density (kg/m3) | 1030±0.12 | 870±0.15 |
| Porosity (decimal) | 0.373±0.013 | 0.40±0.011 |
| Length (mm) | 28.1±0.31 | 22.5±0.23 |
| Breadth (mm) | 22.7±0.14 | 10.9±0.11 |
| Thickness (mm) | 20.8±0.21 | 10.5±0.09 |
| Arithmetic mean (mm) | 23.9±0.16 | 14.6±0.09 |
| Geometric mean (mm) | 44.8±0.90 | 8.7±0.17 |
| Coefficient of friction | ||
| Coated GI | 0.24 | 0.24 |
| Iron | 0.26 | 0.44 |
| Aluminium | 0.19 | 0.28 |
| Plywood | 0.06 | 0.29 |
| Plastic | 0.1 | 0.34 |
| Yield Recovery Analysis | ||
| % consumable | 79.81±3.61 | |
| % non-Consumable | 19.25±2.68 | |
| % juice | 54.1±0.02 | |
Kashaninejad et al., and Bart-Plange and Baryeh29,30 in their studies pointed out that lengthwise growth had greater importance than the width of a fruit, in order to judge its normal and healthy growth. Volume of the fruit has a major role in the market price and export import. These indigenous minor fruits have a very large market outside India due to its high therapeutic value. So determination of volume also a major important factor. Volume lies between 8.5 x 10⁻⁶ – 10 x 10-6 m3 which matches the report with the Jamun fruit available in Pakistan.31
True density and the bulk density had a great combination with the weight and the volume of the fruit. In case of whole fruit true density and bulk density had a close relationship due to its structure but in case of seed there is a significant difference between two densities. Due to sticky fibrous material outside the seed coat was responsible for the changes.
To design the graders, de-seeder, pricking and packaging machines, physical properties of the fruits and seeds will be useful. For future studies and for the machine designing purpose coefficient of friction for the whole fruit as well as seed was mentioned in the Table 1. In case of whole fruit the maximum coefficient of friction value obtained for iron and minimum for plastic but in case of seed aluminium had the maximum value with a minimum value for coated GI. Due to the elliptical nature, there is a high rolling resistance in all surfaces.
Figure 1 shows the frequency distribution curve for length breadth and thickness. The curves were narrower and had higher peaks which implies that the mean values of the dimensions show a trend towards a normal distribution.
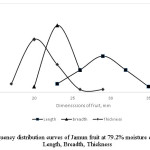 |
Figure 1: Frequency distribution curves of Jamun fruit at 79.2% moisture content (wb).Length, Breadth, Thickness |
Yield Recovery
From the yield recovery, it was observed that consumable (Table. I) from the whole fruit was 79.81% and non-consumable portion was 19.25% (seed). The juice yield from the consumable portion was measured as 54.1%. According to Shahnawaz and Sheikh32 for elliptical Jamun fruit, juice yield was 32%.
Mechanical properties
Figure 2(a) represents the comparative study between the whole fruit hardness and seed hardness. So at 79.2% moisture content (w.b.) of whole fruit the average hardness to penetrate the fruit was 32.17N where as for the seed it increased up to 37.83N. This difference in hardness is due to the soft fibrous pulp outside the fruit. In case of 1st fracture deformation in fruit and seed it was observed that the whole fruit can be penetrated up-to 4.1mm whereas at the same load for seed it can penetrate up-to 2.53mm due to its own hardness.
Texture of the Jamun fruit has a very soft in nature Shahnawaz and Sheikh,19 qualitatively as well as quantitavely it can be proved. Force-deformation-distance curve of Jamun fruit was demonstrated in Figure 2(b). It can be concluded from the figure that, the surface hardness was higher than the pulp. Due to the high fibre content of the pulp, the failure was not uniform. As the probe touches the surface of the fruit at 5.20mm, the load recorded was 4.98 N with a 0.00275 % of deformation. When the probe covers 12mm distance it touched the seed of the fruit then, breaking it with a load of 23.50N where deformation was 0.006%. Again after penetrating the seed the probe travelled through the fibrous material and finally covered 15mm with a load of 6.12N.
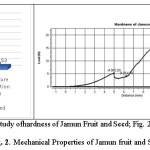 |
Figure 2 (a): Comparative study ofhardness of Jamun Fruit and Seed; Fig. 2 (b) Compression Test Profile of Jamun Fruit |
Colour analysis
Colour is one of the major parameter for fruits. It determines the market value of the product as well as the ripeness of the product. Three different form of the Jamun fruit was obtained and Figure 3(a) shows that in case of juice the L value (Lightness and darkness) is more than that of pulp and whole fruit. Pulp is darker in nature. For maintain the quality of the whole fruit a* (indicates the dark red colour) value is major important parameter. From the graph it can be concluded that whole fruit had the lowest value of a*(0.26) whereas pulp and juice value was recorded as 16.03 and 17.1 respectively. But in case of Jamun juice the major colour parameter was b* (indicates the blue colour in negative) value, which indicates the quality of the fruit juice. In case of pulp, juice and whole fruit the value of b* was -9.7, -0.9, and -0.76 respectively. Figure III(b) shows the comparison between Jamun juice and seed powder in case of wavelength variation.
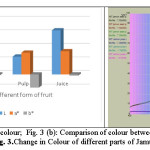 |
Figure 3 (a): Changes in colour; Fig. 3 (b): Comparison of colour between Jamun juice and seed |
Chemical Properties
Chemical composition of riped Jamun fruit and seed are given in Table 2. Moisture, ash, TSS, TDS, TS, pH, carbohydrate, sugar, acidity, pectin, fat, protein, ascorbic acid, polyphenol, antioxidant capacity, viscosity, tannin, fibre, anthocyanin contents were found 79.21% (wb) and 52.24% (wb), 1.03% and 3.13%, 14.860B and 1.40B, 615ppm and 217ppm, 20.33% and 47.75%, 3.87 and 2.5, 97.59% and 89.68%,7.88% and 5.54%, 2.65% and 0.04%, 4.7% and Nil, 0.18% and 1.28%, 0.65% and 4.68% 49.78% and 1.84%, 203.76 and 386.51mg GAE/g, 31.29% and 48.23% 1.03 Pa S and Nil, 94.52 and 388.99 mg/100g, 0.53% and 1.21%, 195.58 and 18.47mg/100g for whole fruit and seed, respectively. Shahnawaz and Sheikh,32 reported that ash, vitamin C, reducing sugar, total sugar, protein, fat, total solid, crude fibre present 0.32%, 19.4%, 5.72%,14.31%,0.72%, 0.27%, 18.68%, 0.22% respectively. In a comparative study of bioactive compounds V.R. de Souza et al.,33 reported the presence of chemical properties in blackberry, red raspberry, strawberry, blueberry and cherry. The presence of moisture, protein, lipid, ash, fibre, pH, TSS and TS was quite similar to Jamun fruit.
Mineral contents of Jamun fruits are presented in Table 2. Mineral elements were found to vary widely between whole fruits and seed. In case of fruit pulp according to results, K, Ca and Na contents were very high and in case of seed K, Ca, Mg contents are maximum. Amount of Zn, Fe, Cu, Mn, Pb and Cr contents of jamun pulp and seed were very low. Whereas there is a variation in blackberry reported by V.R. de Souza et al.,33 USDA (2013)34, Hakala et al.,35 Tosun et al.,36 They have mentioned that presence of P, K, Ca, Mg, Zn, Fe, were 7.25, 79.73, 7.25, 15.70, 0.20, 1.28 mg/100gfw respectively.
Table 2: Chemical properties and minerals in pulp and seed of Jamun Fruit
| Property | Pulp | Seed |
| Moisture (%wb) | 79.21±2.27 | 52.24±3.17 |
| Ash (%) | 1.03±0.08 | 3.13±0.16 |
| TSS (0B) | 14.86±1.47 | 1.4±0.15 |
| TDS (ppm) | 615±0.21 | 217±1.15 |
| TS (%) | 20.33±0.34 | 47.75±3.17 |
| pH | 3.87±0.01 | 2.5±0.1 |
| Total Carbohydrate (%) | 97.59±0.09 | 89.68±0.29 |
| Total Sugar (%) | 7.88±0.41 | 5.54±0.69 |
| Acidity | 2.65±0.21 | 0.04±0.001 |
| Pectin (%) | 4.7±0.13 | N/A |
| Fat (%) | 0.18±0.02 | 1.28±0.11 |
| Protein (%) | 0.65±0.03 | 4.68±0.35 |
| Ascorbic Acid (mg/100g) | 49.78±2.17 | 1.84±0.14 |
| Polyphenol (mg GAE/g) | 203.76±9.84 | 386.51±10.25 |
| Antioxidant Capacity (DPPH) (%) | 31.29±1.53 |
48.23±2.98 |
| Viscosity (Pa s) | 1.03±0.07 | N/A |
| Tannin (mg/100g) | 94.52±9.19 | 388.99±7.34 |
| Fibre (%) | 0.53±0.06 | 1.21±0.06 |
| Anthocyanin(mg/100g) | 195.58±6.15 | 18.47±1.99 |
| Minerals | ||
| Sodium | 11.73±1.70 | 43.86±12.09 |
| Potassium | 172.4±17.23 | 606.46±69.37 |
| Calcium | 81.4±11.15 | 135.86±26.81 |
| Zn | 0.46±0.06 | 0.46±0.17 |
| Iron | 4.66±0.81 | 4.2±0.80 |
| Mg | 27.13±3.43 | 111.6±18.06 |
| Cu | 1.8±0.41 | 2.13±0.86 |
| Mn | 0.2±0.007 | 0.4±0.11 |
| Pb | 0.33±0.13 | 0.66±0.06 |
| Cr | 1.06±0.13 | 1.4±0.61 |
Sensory Analysis
Sensory analysis had been performed between market sample and raw sample. Comparison of sensory analysis in web chart is given in Figure 4. From the figure it is observed that appearance of both the sample was same whereas market sample had a good flavour and odour due to the presence of external ingredients. But in case of raw sample nothing was added from outside, so flavour and odour was not good as compared to market sample. Mouth feel and colour was good in case of raw sample due to its originality. Since viscosity was same in both the sample, overall it was found that raw sample got higher marks than the market sample.
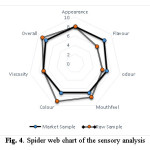 |
Figure 4: Spider web chart of the sensory analysis |
Conclusion
Being a minor fruit, Jamun is having lot of medicinal and pharmaceutical advantages. But it is an unexploited fruit. Thus the attempt was made to determine the physicochemical properties of Jamun and explore the nutritive benefits and usefulness of the fruit.
Based on this investigation the following conclusions can be drawn on the physical properties of Jamun fruit and seed also about it’s at a particular average moisture content of 79.21% (w.b) and 52.24 %(w.b). The frequency distribution curves tends to be a normal distribution. AM and GM are used for determining the volume of the seed as well as the fruit theoretically. The arithmetic mean diameter (AM) and geometric mean diameter (GM) were 23.9 and 44.8 mm, respectively for the whole fruit and 14.6 and 8.7 mm for the seed.
In case of chemicals property, high amount of polyphenols 203 and 306 (mg GAE/g) were present in fruit pulp and seed, respectively. The hardness of the seed is more than that of whole fruit due to its pulpy nature. Presence of Calcium and Potassium were determined in a large amount. Colour of the whole fruit, pulp, juice, as well as seed had been quantified with a yield recovery of 80%.
The physical properties, mechanical properties, chemical properties of Jamun fruit and seeds, enhance the knowledge in detail about the species and will also supplies the useful data for its post-harvest handling and other industrial processing.
Acknowledgements
We would like to thank the IARI, New Delhi campus and National Institute of Technology – Rourkela for their help to perform the experiments. This research did not receive any specific grant from funding agencies in the public, commercial, or not-for-profit sectors.
References
- Manjeshwar S, Baliga S. F, Karadka R, Thilakchand, D’souza P, Rao S. Scientific Validation of the Antidiabetic Effects of Syzygium jambolanum DC (Black Plum), a Traditional Medicinal Plant of India, The Journal of Alternative and Complementary Medicine, Karnataka, India: (2013).
- Chandrasekhar J, Raghavarao K.S.M.S. Separation and Concentration of Anthocyanins from jamun: Chemical Engineering Communications. An Integrated Process. Publisher: Taylor & Francis. CFTRI, Mysore, India: (2014).
- Jampani C, Naik A, Raghavarao K.S.M.S. Purification of anthocyanins from jamun (Syzygium cumini L.) employing adsorption. Separation and Purification Technology; 125: 170-178: (2014).
CrossRef - Ayyanar M, Subash-Babu P. Syzygium cumini (L.) Skeels: A review of its phytochemical constituents and traditional uses. Asian Pacific Journal of Tropical Biomedicine; 2(3): 240-246: (2012).
CrossRef - Banerjee J, Narendhirakannan R.T. Biosynthesis of silver nanoparticles from Syzygiumcumini (L.) seed extract and evaluation of their in vitro antioxidant activities. Dig J Nanomater Biostruct; 6(3): 961-968: (2011).
- Bajpai M, Pande A, Tewari S.K, Prakash D. Phenolic contents and antioxidant activity of some food and medicinal plants. International Journal of Food Sciences and Nutrition; 56(4): 287-291: (2005)
CrossRef - Vasi S, Austin A. Antioxidant potential of Eugenia jambolana Lam. seeds. Journal of Biological Sciences; 9(8): 894-898: (2009).
CrossRef - Chaturvedi A, Kumar M.M, Bhawani G, Chaturvedi H, Kumar M, Goel R.K. Effect of ethanolic extract of Eugenia jambolana seeds on gastric ulceration and secretion in rats. Indian Journal of Physiology and Pharmacology: 51(2): 131: (2007).
- Chitnis K.S, Palekar S.B, Koppar D.R, Mestry D.Y. Evaluation of Syzygium cuminilinn. Seed formulations available in the market using spectrophotometric and chromatographic techniques. International Journal of Pharmaceutical Sciences and Research; 3(2): 556: (2012).
- Sah A.K, Verma V.K. Syzygium cumini: An overview. J Chem Pharm Res; 3(3): 108-113: (2011).
- Mastan S.K, Latha T.B, Latha T.S, Srikanth A, Chaitanya G, Kumar K.E. Influence of methanolic extract of Syzygium cumini seeds on the activity of gliclazide in normal and alloxan-induced Diabetic rats. Pharmacol Online; 3: 845-850: (2009).
- Mastan S.K, Saraseeruha A, Gourishankar V, Chaitanya G, Raghunandan N, Reddy G.A, Kumar K.E. Immunomodulatory activity of methanolic extract of Syzygium cumini seeds. Pharmacology online; 3: 895-903: (2008).
- Kumar A, Ilavarasan R, Jayachandran T, Deecaraman M, Aravindan P, Padmanabhan N, Krishan M.R.V. Anti-diabetic activity of Syzygium cumini and its isolated compound against streptozotocin-induced diabetic rats. Journal of Medicinal Plants Research; 2(9): 246-249: (2008).
- Kachroo P, Leong S.A, Chattoo B.B. Pot2, an inverted repeat transposon from the rice blast fungus Magnaporthegrisea. Molecular and General Genetics MGG; 245(3): 339-348: (1994).
CrossRef - Dash A.K, Pradhan R.C, Das L.M, Naik S.N. Some physical properties of simarouba fruit and kernel. International Agrophysics; 22(2): 111: (2008).
- Amin A, Cohendet P. Architectures of knowledge: Firms, capabilities, and communities. Oxford University Press; (2004).
CrossRef - Benherlal P.S, Arumughan, C. Investigation on bioactive phytochemicals of jamun (syzygiumcumini) fruit (Doctoral dissertation, Agroprocessing and Natural products Division, National Institute for Interdisciplinary Science and Technology (CSIR), Thiruvananthapuram); (2010).
- Mohsenin N.N. Physical Properties of Plant and Animal Materials. Gordon and Breach Science Publishers, New York; (1980).
- Shahnawaz M, Sheikh S.A. Physicochemical characteristics of Jamun fruit. Journal of Horticulture and Forestry; 3(10): 301-306: (2011).
- Deshpande S.D, Bal S, Ojha T.P. Physical properties of soybean. Journal of Agricultural Engineering Research; 56(2): 89-98: (1993).
CrossRef - Paoletti F, Moneta E, Bertone A, Sinesio F. Mechanical properties and sensory evaluation of selected apple cultivars. LWT-Food Science and Technology; 26(3): 264-270: (1993).
CrossRef - AOAC, Official Methods of Analysis, 14th ed. Association of Official Analytical Chemists, Washington, DC; (2000).
- Serrem C.A, de Kock, H.L, Taylor J. Nutritional quality, sensory quality and consumer acceptability of sorghum and bread wheat biscuits fortified with defatted soy flour. International Journal of Food Science & Technology; 46(1): 74-83: (2011).
CrossRef - Lane J.H, Eynon L. Determination of reducing sugars by Fehling’s solution with methylene blue indicator. N. Rodger. (1934).
- Ranganna S. Handbook of analysis and quality control for fruit and vegetable products. New Delhi, India: Tata Mcgraw Hill; 833-834: (2005).
- Singleton V.L, Orthofer R, Lamuela-Raventos R.M. Analysis of total phenols and other oxidation substrates and antioxidants by means of folin-ciocalteu reagent. Methods in enzymology; 299C: 152-178: (1999).
CrossRef - Brand-Williams W, Cuvelier M.E, Berset C.L.W.T. Use of a free radical method to evaluate antioxidant activity. LWT-Food Science and Technology; 28(1): 25-30: (1995).
CrossRef - Lee J, Durst R.W, Wrolstad R.E. Determination of total monomeric anthocyanin pigment content of fruit juices, beverages, natural colorants, and wines by the pH differential method: collaborative study. Journal of AOAC international; 88(5): 1269-1278: (2005).
- Kashaninejad M, Mortazavi A, Safekordi A, Tabil L.G. Some physical properties of Pistachio (Pistaciavera L.) nut and its kernel. Journal of Food Engineering; 72(1): 30-38: (2006).
CrossRef - Bart-Plange A, Baryeh E.A. The physical properties of Category B cocoa beans. Journal of Food Engineering; 60(3): 219-227: (2003).
CrossRef - Shahnawaz M, Shiekh A. Analysis of viscosity of jamun fruit juice, squash and jam at different compositions to ensure the suitability of processing applications. IJPPB; 3(5): 89-94: (2011).
- Shahnawaz M, Sheikh S.A, Nizamani S.M. Determination of nutritive values of Jamun fruit (Eugenia jambolana) products. Pakistan Journal of Nutrition; 8(8): 1275-1280: (2009).
CrossRef - de Souza V.R, Pereira P.A.P, da Silva T.L.T, de Oliveira Lima L.C, Pio R, Queiroz F. Determination of the bioactive compounds, antioxidant activity and chemical composition of Brazilian blackberry, red raspberry, strawberry, blueberry and sweet cherry fruits. Food chemistry; 156: 362-368: (2014).
CrossRef - USDA-ARS (US Department of Agriculture, Agricultural Research Service) (2013). USDA nutrient database for standard reference, Release 25, Software 1.2.2, from the Nutrient Data Laboratory Page on the World Wide Web. <http:// www.nal.usda.gov/fnic/foodcomp>
- Hakala M, Lapvetelainen A, HoupalahtiKallio H, Tahvonen R. Effects of varieties and cultivation conditions on the composition of strawberries. Journal of Food Composition and Analysis; 16: 67–80: (2003).
CrossRef - Tosun I, Ustun N.S, Tekguler B. Physical and chemical changes during ripening of blackberry fruits. Scientia Agricola; 65(1): 87-90: (2008).
CrossRef.


Web of Science Coverage
Emerging Sources Citation Index (ESCI)
2024 Journal Impact Factor: 1.1
Scopus Journal Metrics
CiteScore 2025: 2.6
CiteScore Details
Sustainable Nutrition: Food Systems, Nutrient Retention, and Public Health Impact
![]()
This journal is a member of, and subscribes to the principles of, the Committee on Publication Ethics (COPE)


