Migration of Antimony and Phthalate Esters from Plastic Food Packaging: A Systematic Review of Reported Levels, Food Matrix Effects and Influencing Factors
 , , 2*, Harold Mênouwesso Hounhouigan1, Achille Todègnon Gantongbe1, Abdou Madjid Amoussa2, Jiangfeng Song3 and Latifou Lagnika2
 1Department of Food Science, Technology, and Human Nutrition, National University of Agriculture, Porto-Novo, Benin.
2Department of Integrative Biology for Therapeutic Innovation, University of Abomey-Calavi, Abomey-Calavi, Benin.
3Institute of Agro-Product Processing, Jiangsu Academy of Agricultural Sciences, Jiangsu, China.
Corresponding Author Email: lacamvet@yahoo.fr
DOI : http://dx.doi.org/10.12944/CRNFSJ.13.3.4
Download this article as:
![]()
Plastic food packaging represents a major source of chemical exposure, as materials such as polyethylene terephthalate (PET) and polyvinyl chloride (PVC) can release toxic elements including antimony (Sb) and phthalate esters (PAEs) into foods, raising growing concerns for public health and regulatory compliance. This review followed the PRISMA 2020 protocol and systematically screened 1,317 records from ScienceDirect, PubMed, and Scopus, retaining 45 original studies published between 2010 and 2025 that quantitatively assessed Sb or PAE migration from plastic food packaging. Among these, 32 articles (71.11%) investigated phthalate migration, 12 studies (26.67%) focused on antimony, and only one (2.22%) addressed both. Antimony migration, mainly from Polyethylene terephthalate (PET) bottles, was reported across 13 studies, with concentrations in bottled water generally below 5 µg/L under ambient storage, but reaching up to 18.5 µg/L in stress conditions such as high temperatures or acidic simulants. In soy sauce, total Sb levels were reported up to 6.6 µg/L, while fruit juices and carbonated drinks showed higher migration than plain water. For phthalates, analysis of 32 studies revealed consistently higher levels in lipid-rich or acidic matrices. In bottled waters, DBP, DEP, and DEHP ranged from non-detectable to 25 µg/L, with cumulative increases during storage up to 1283 days. Edible oils showed much higher concentrations, reaching mg/L levels of DBP, BBP, and DEHP, while convenience foods such as cakes contained DEHP up to 5.2 mg/kg. Milk products also revealed significant accumulation of DEP, DBP, and DEHP under refrigeration and ambient storage. Factors most strongly associated with increased migration included elevated temperatures (40-70 °C), prolonged storage (months to >1 year), and matrix composition (acidic or fatty foods). Despite regulatory limits of 5 µg/L for Sb and 1.5 mg/kg for DEHP, several studies reported exceedances under stress conditions. This synthesis provides a critical basis for risk assessment and calls for harmonized migration testing and regulatory updates covering non-aqueous foods and combined exposures to Sb and PAEs.
KEYWORDS:Antimony Migration; Food Safety; Phthalate Esters; Plastic Food Packaging; Storage Conditions
Introduction
The use of plastic packaging in the food industry has expanded considerably over the past decades, driven by its low production cost, light weight, ease of transport, and preservation properties that help extend food shelf life.1,2 Polymers such as polyethylene terephthalate (PET), polyethylene (PE), polypropylene (PP), and polyvinyl chloride (PVC) are particularly favored because they provide effective barriers against moisture, oxygen, and light, while being adaptable to a wide variety of shapes and uses.3,4 These features make them essential materials for bottling water and beverages, packaging dairy products, oils, processed foods, and ready-to-eat meals.5,6 However, this widespread use is accompanied by growing concerns regarding the migration of chemical substances from packaging into foods, especially under the influence of temperature, storage time, and the nature of the food matrix.7,8 Numerous studies have demonstrated that these materials are not inert barriers and can release various chemical compounds into food during storage or transport.9-14 Among these substances, antimony and phthalate esters attract particular attention due to their recurrent presence and potential health effects.
Antimony (Sb) is commonly used as a catalyst in the production of polyethylene terephthalate (PET), the most widely employed plastic for water and beverage bottles.15,16 Although generally present at residual levels, it can migrate into foods and beverages, with concentrations varying according to temperature, contact duration, and the type of liquid packaged.9,17,18 Exceedances of regulatory limits have been reported under certain extreme conditions, highlighting the need for continuous monitoring.19
Phthalate esters (PAEs), used as plasticizers to improve polymer flexibility, represent another major group of contaminants identified in packaged foods.8,6 These lipophilic compounds tend to accumulate preferentially in fatty or acidic matrices, such as oils, milk, or juices, and their migration is strongly influenced by temperature and storage duration.3,20,21 Among them, DEHP, DBP, and BBP are frequently detected and often studied for their toxicity and endocrine-disrupting potential.7,22
The toxicological implications of these migrations are well documented. Chronic exposure to antimony has been associated with adverse effects on the liver and lungs;23 while several phthalates are classified as reproductive toxicants or endocrine disruptors.22,24 In this context, many countries have established specific migration limits (SMLs) for these substances, such as 5 µg/L for antimony in water (EU Regulation 10/2011) and 1.5 mg/kg for DEHP.22
Despite this regulatory framework, the scientific literature reveals great variability in measured levels, reflecting the diversity of polymers, storage conditions, and food matrices studied.5,25,26 Therefore, a systematic synthesis of available data is needed to better characterize the extent of migration.
Despite numerous publications addressing antimony or phthalate migration, most previous works have investigated these contaminants separately and have primarily focused on bottled water or simple aqueous matrices. Very few studies have compared migration patterns across diverse food types or considered the combined influence of time, temperature, and matrix composition under real storage conditions. Moreover, there is still a lack of integrated synthesis linking the reported migration levels with international regulatory thresholds. The present review therefore aims to bridge these gaps by providing a comprehensive and comparative analysis of both Sb and PAE migration from plastic food packaging across multiple food matrices, based on 45 studies published between 2010 and 2025.
The objective of this systematic review is thus to evaluate, based on the scientific literature, the levels of migration of antimony and phthalate esters from plastic packaging into foods, in order to identify the reported concentrations and the conditions that favor this migration.
Materials and Methods
Literature search
A systematic review was conducted using three online databases (Scopus, PubMed, and ScienceDirect) to identify studies addressing the migration of antimony and phthalate esters from plastic packaging into foodstuffs, with a focus on the reported concentrations and the conditions favoring such migration. The search was carried out in accordance with the PRISMA guidelines.27 Queries were constructed using Boolean operators and keywords, relying on two main search equations. The search strings used were (“antimony” OR “Sb”) AND (“migration” OR “leaching”) AND (“food” OR “food simulant”) AND (“plastic packaging”) as well as (“phthalates” OR “phthalate esters”) AND (“migration” OR “leaching”) AND (“food” OR “food simulant”) AND (“plastic packaging”). Keywords were adapted according to the specifications of each database. The search covered the period from 2010 to September 3, 2025, without applying additional filters. The literature search was performed in English, and only articles published in this language were considered. The search resulted in the identification of 1,239 records from ScienceDirect, 62 from PubMed, and 16 from Scopus after applying the two search equations.
Inclusion and exclusion criteria
A total of 1,317 references were collected from all the databases consulted. The files were exported in RIS format for most of the databases, with the exception of PubMed, where the specific PubMed format was used. All references were then imported into EndNote X9, which enabled the detection and removal of 113 duplicates through both automated processing and manual verification. As a result, 1,204 unique references were obtained, converted into XML format, and imported into the SysRev platform for the selection process. The inclusion and exclusion criteria applied are presented in Table 1. Based on these criteria, titles and abstracts were screened, leading to the preselection of 86 articles that were subjected to full-text review for detailed analysis. During the final eligibility assessment, only original experimental or analytical studies were retained for the extraction of relevant quantitative data. At the end of this process, 45 publications were included in the final analysis. The overall selection process is illustrated in Fig 1.
Table 1: Inclusion and exclusion criteria applied to studies in SysRev
| Inclusion | Exclusion |
| Studies investigating the migration of antimony (Sb) or phthalate esters from plastic packaging into foods or food simulants | Studies not addressing food or food simulants |
| Studies providing details on migration conditions (temperature, contact time, type of food or simulant, and type of plastic) | Studies not reporting numerical migration values (e.g., expressed in µg/L or mg/kg) |
| Only studies published from 2010 onwards were included. | Studies published before 2010 |
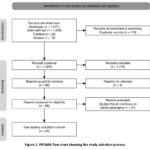 |
Figure 1: PRISMA flow chart showing the study selection process |
Data extraction process
Data were extracted from the selected studies based on the following parameters: author(s) and year of publication, type of food or simulant studied, type of plastic investigated (PET, PVC, PE, PP, etc.), and nature of the packaging (bottles, films, trays, etc.). Migration conditions, including exposure temperature (ambient, refrigeration, heating, pasteurization, etc.) and contact duration (hours, days, months), were also recorded. Reported concentrations of antimony (Sb) and phthalate esters (DEHP, DBP, BBP, etc.) were collected, along with the observed value ranges (minimum-maximum) and the regulatory standards applied for their interpretation. All extracted information was compiled and organized using Microsoft Excel®.
Scope of the Article
This systematic review examines the migration of antimony (Sb) and phthalate esters (PAEs) from plastic food packaging into different food matrices. Particular emphasis is placed on polyethylene terephthalate (PET) bottles, which dominate the literature, and on conditions that influence migration such as temperature, storage duration, and food composition. The review synthesizes reported concentration levels, comparing them with international regulatory limits, and evaluates how matrix characteristics (aqueous, acidic, or lipid-rich) modulate the extent of chemical release. Special attention is given to the differential patterns of Sb migration in bottled waters versus more complex beverages, and to the markedly higher accumulation of phthalates in fatty foods and oils. By critically analyzing 45 studies published between 2010 and 2025, this review identifies consistent determinants of migration (time, temperature, matrix effects), highlights knowledge gaps such as the limited exploration of Sb beyond water, and underscores the need for harmonized testing protocols. Studies addressing combined exposures, polymer diversity beyond PET, and mechanistic insights into diffusion and solubility processes are given particular consideration to inform future risk assessment and research priorities.
Results
This review presents the distribution of studies according to the type of contaminants investigated and the temporal evolution of publications, which remain included in this section. The other main findings regarding migration levels, influencing factors, and food matrix effects have been fully examined and are discussed in detail in the Discussion section.
Distribution of studies according to the contaminants studied
Fig 2 below illustrates the distribution of the 45 studies included in this review according to the type of contaminants investigated. The majority of the works (32 articles, representing 71.11%) focus on the migration of phthalate esters from plastic packaging into foodstuffs. A smaller group of 12 publications (26.67%) specifically addresses the migration of antimony. Finally, only one study (2.22%) combines the joint evaluation of antimony and phthalate esters. This distribution highlights a much stronger scientific interest in phthalate esters during the study period, while antimony appears to remain a relatively underexplored topic.
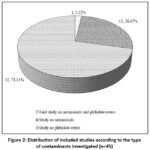 |
Figure 2: Distribution of included studies according to the type of contaminants investigated (n=45). |
Temporal evolution of publications
Fig 3 below shows the annual distribution of publications included in this review between 2010 and 2025. Studies on antimony migration appear sporadically, with a maximum of 2 articles in 2013, 2014, and 2015, followed by a generally low and irregular trend until 2025, where a slight increase is observed with 3 publications in 2024. In contrast, research on phthalate esters demonstrates a more pronounced dynamic. After a limited start between 2010 and 2013 (0 to 2 article per year), a major peak is observed in 2015 with 5 publications. Subsequently, the number fluctuates but stabilizes from 2019 onward, ranging between 1 and 4 articles per year, with peaks of 4 publications in 2020, 2022, 2024, and 2025. These findings indicate that research on phthalates has attracted increasing and consistent attention during the second half of the study period, whereas antimony remains much less investigated, with only scattered contributions.
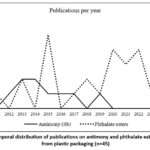 |
Figure 3: Temporal distribution of publications on antimony and phthalate ester migration from plastic packaging (n=45). |
Discussion
Antimony
Antimony (Sb) is a metalloid element with atomic number 51, belonging to the pnictogen group. It occurs in several oxidation states, mainly Sb(III) and Sb(V), which are the most relevant forms in the environment and in food matrices. Its stable crystalline structure is rhombohedral, and it is widely used industrially as a catalyst in the polymerization of polyethylene terephthalate (PET). This explains its residual presence in many plastic food packaging materials. Several studies have reported that, under certain conditions, this element can migrate from PET into beverages and food simulants.9,12,13,20,28-31 Table 2 below provides a synthetic overview of the data extracted from the 13 included articles, highlighting the food matrices or simulants tested, the experimental conditions applied, and the levels of antimony detected.
Table 2: Migration of antimony from food plastic packaging (n = 13).
| Type of food or simulant | Type of plastic studied | Type of packaging (bottles, films, trays, etc.) | Exposure temperature (ambient, refrigeration, heating, pasteurization, etc.) | Contact duration (hours, days, months) | Migrated antimony (Sb) concentration (µg/L or mg/kg) |
| Mineral water9 | PET | Bottles (510 mL, light blue) | 40 °C, 50 °C, 60 °C | 3, 7, 10, 14, 21 days | From < LOQ (1.0 µg/L) at 40 °C to 4.38 µg/L at 60 °C (21 days) |
| Mineral water12 | PET | Bottles (300-510 mL, various colors) | 40 °C (Brazil), 60 °C (EU) | 10 days | < LOQ (1.0 µg/L) at 40 °C; 1.59–4.42 µg/L at 60 °C |
| Bottled drinking water13 | PET | Bottles (0.33 L, mostly colorless, some faint blue) | 25 °C, 35 °C, 50 °C | 120 and 240 days | Initial 0.025–0.062 µg/L; increased up to 2.17 µg/L at 50 °C after 240 days |
| Bottled water, mineral water, cola, orange-flavored carbonated drink, fermented turnip drink, lemonade20 | PET | Bottles (25 commercial brands, Turkey) | 4 °C, 25 °C, 40 °C | 0, 90, 180, 365 days | Sb detected in all beverages except DW at baseline; higher migration in acidic/carbonated drinks; max ~3.72 µg/L (lemonade, 90 d at 4 °C); most <3 µg/L |
| Soy sauce28 | PET | Bottles | not defined | not defined | Inorganic Sb(III): 0.8–2.3 µg/L; Total Sb: 1.7–6.6 µg/L |
| Bottled water and fruit juices (orange, grape)29 | PET | Bottles | Room temperature (centrifugation leaching for juices) | not defined | Water: Sb(V) 0.203 µg/L; Juices: Sb(V) 0.261–0.435 µg/L, Sb(III) 0.091 µg/L, TMeSb 0.263–0.670 µg/L |
| Bottled water (12 brands, Mexico) & ultrapure water (simulant)17 | PET | Bottles (500 mL, colorless) | 25 °C and 75 °C; pH 3 and 7 | 5 and 15 days | Initial: 0.28–2.30 µg/L; Migration tests up to 5.1 µg/L at 75 °C; Range: 1.1–18.5 µg/L (worst case) |
| Mineral water15 | PET | Bottles (clear, light blue, dark blue, 3 brands) | 4 °C, 20 °C, 40 °C, 60 °C | Up to 220 days | Initial: 0.3–0.7 µg/L; At 60 °C: 2.6–4.2 µg/L; Exceeded 5 µg/L after 15–30 days (dark blue bottles) |
| Bottled drinking water (16 brands, China) with Milli-Q water18 | PET | Bottles | 4 °C, 25 °C, 70 °C | 1, 2, and 4 weeks | 4 °C: 1.88–8.32 ng/L; 25 °C: 2.10–18.4 ng/L; 70 °C: 20.3–5436 ng/L |
| Mineral water (2 brands) & fruit juices (orange, lemon, apple, mango, peach)30 | PET | Bottles | Room temperature; prolonged storage | Up to 2 months (water); not defined (juices) | Water: 27–75 ng/L; Juices: 531–966 ng/L |
| Bottled beverages (water, juice, tea, coffee, carbonated drinks) & simulants (water, acetic acid, ethanol)31 | PET | Bottles (80 brands, Japan) | 25 °C, 40 °C, 55 °C, 70 °C | Up to 440 days | Bottled drinks: 0.3–1.6 µg/L; Migration in simulants: <1 µg/L (25–40 °C), up to 14.4 µg/L (80 °C, 72 h) |
| Distilled water, 3% acetic acid, 10% ethanol, 20% ethanol, olive oil, sunflower oil, wine vinegar, apple vinegar (EU food simulants)19 | PET | Bottles | 40 °C (10 days); reuse test with 3% acetic acid also at 40 °C; additional test at 60 °C (10 days) | 10 days (reuse cycles for acetic acid up to 3 leachings) | 0.5–1.2 µg/L (aqueous simulants); <LOQ in oils; vinegar: 0.45–0.50 µg/L; reuse test with acetic acid reached 6.4 µg/L |
| Bottled water (non-carbonated, carbonated, non-carbonated enriched) 16 | PET, HDPE, PS, PC | Bottles (0.25–18.9 L, USA brands) | 23 °C (room temperature, 12h/12h light-dark cycle) | 1, 7, 30, 60 days | NCR: <LOQ – 500 ng/L (avg. 90 ng/L); CR: 53–383 ng/L (avg. 180 ng/L); NCRE: 77–1070 ng/L (avg. 420 ng/L); Max ~1200 ng/L (PET bottles, 60 days) |
Food matrices and plastic types investigated in antimony migration studies
Fig 4 (Distribution of food matrices investigated in antimony migration studies) illustrates the distribution of food types and simulants examined across the 13 included articles. The majority of studies focused on bottled water, representing 84.68% of the cases. Other beverages, including juices, cola, coffee and soft drinks, accounted for 30.76% and stimulants accounted for 15.38%. Distilled water was reported in 7.69% of studies, while soy sauce was also addressed in a single investigation (7.69%). This highlights that water, particularly mineral and drinking water, has been the primary focus of Sb migration research, whereas other beverages and specific food matrices remain less explored.
The predominance of bottled water in Sb migration studies reflects both its global consumption and its susceptibility to contamination from PET bottles. Several authors have emphasized this focus, with investigations conducted under different storage conditions and geographical contexts.9,12,13,15-18 Beyond water, some studies extended their analyses to juices and soft drinks, reporting higher Sb levels in acidic or carbonated beverages.20,29-31 In addition, specific food matrices such as soy sauce28 and vinegar-based simulants Sánchez-Martínez et al.,19 demonstrated measurable Sb migration, underscoring that the composition and acidity of the matrix play a critical role in Sb release. Collectively, these results confirm that water remains the most studied medium, but more complex matrices can present enhanced migration risks.
With respect to plastic types, nearly all studies focused on polyethylene terephthalate (PET) as the dominant material of concern. Only one study expanded its scope to include additional polymers such as PVC, PE, PS, and PC alongside PET.16 This indicates that Sb migration has been predominantly evaluated in relation to PET packaging, reflecting its widespread use for bottled water and beverages, while other plastics remain comparatively underexplored.
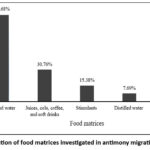 |
Figure 4: Distribution of food matrices investigated in antimony migration studies(n=13). |
Impact of ambient, refrigerated and heated conditions on Sb migration
Across the 13 included studies, exposure temperatures varied from refrigerated conditions to high-temperature stress tests. Ambient storage at room temperature (20-25 °C) was the most common experimental condition, reported in multiple investigations as a baseline scenario reflecting typical market storage.13,16 Refrigerated conditions (4-5 °C) were also examined in certain studies to reproduce cold-chain storage.15,18 On the other hand, elevated temperatures of 40 °C, 50 °C, 60 °C, and even 70-75 °C were frequently applied to simulate accelerated storage, transport in hot climates, or worst-case consumer practices such as leaving bottles in cars or under direct sunlight.9,12,17,31 A few studies additionally tested extreme scenarios, such as pasteurization or boiling conditions, reaching short exposures at 75 °C.18,19
The systematic use of ambient and refrigerated conditions demonstrates the effort to reproduce realistic consumer practices. Authors such as Kiyataka et al.,9 and Mehdar,13 stressed the importance of room temperature as the reference scenario, where migration is expected to remain minimal. Refrigeration, as examined by Carneado et al.,15 and Fan et al.,18 provides insight into the lowest exposure risk contexts, relevant for bottled water and beverages stored in controlled supply chains.
In contrast, the recurrent inclusion of high-temperature conditions across several studies highlights the scientific concern with accelerated diffusion phenomena. Elevated temperatures substantially increase the mobility of Sb within the polymer matrix and enhance its release into food or simulants, as observed by Chapa-Martínez et al.,17 and Rungchang et al.31 These stress conditions are not representative of normal storage, but rather serve as worst-case scenarios to test regulatory safety margins. Fan et al.,18 and Sánchez-Martínez et al.,19 further illustrated that extreme temperatures approaching or exceeding 70 °C can lead to measurable increases in Sb release within short timeframes.
Overall, the inclusion of a wide range of temperatures across the 13 studies shows the balance between realistic consumer conditions (ambient and refrigerated) and accelerated or extreme conditions (40-80 °C). This dual approach allows researchers both to characterize typical exposure and to explore the boundaries of material safety under stress.
Effect of storage time on Sb release
The included studies applied highly variable contact durations, ranging from a few days to several months, in order to cover both realistic consumption scenarios and prolonged storage conditions. Short-term experiments, from 3 to 21 days, were conducted to evaluate the initial migration of Sb under accelerated or simulated conditions.9,12,17 Other authors extended the storage period to several weeks, particularly 15 to 30 days, in order to observe intermediate-stage changes.18 Finally, several studies prolonged the experiments to several months, with follow-ups reaching 120 to 240 days;13 or even more than one year;20,31 reflecting extreme storage conditions or a kinetic modeling approach. Specific investigations also explored repeated contact durations in the context of reuse or successive leaching;19 as well as prolonged experimental conditions applied to different matrices such as juices, soy sauce, or fermented beverages.16,28-30
The heterogeneity of contact durations reported across the 13 studies reflects a dual methodological approach. On the one hand, short-term exposures (a few days to a few weeks) aimed to reproduce the usual consumption conditions of bottled water and beverages, where consumer exposure is generally limited. Thus, Kiyataka et al.,9 and Kiyataka et al.,12 selected durations of 3 to 21 days to evaluate the initial release kinetics, directly linked to the average storage period before consumption. Similarly, Chapa-Martínez et al.,17 showed that significant variations could already occur within the first 5 days, especially under elevated temperatures.
On the other hand, long-term exposures, ranging from several months to more than one year, follow a logic of worst-case evaluation and mechanistic understanding. Mehdar,13 by extending measurements up to 240 days, highlighted that antimony migration follows a cumulative dynamic, with a progressive increase as storage time lengthens. Isci & Dagdemir,20 and Rungchang et al.,31 confirmed this trend by demonstrating that, even at levels generally below regulatory limits, very prolonged storage durations could significantly amplify Sb concentrations.
Studies on complex matrices reinforce this observation. Liu et al.,28 working on soy sauce, and Lin et al.,29 on juices, demonstrated that prolonged contact times promote migration in acidic or organic-rich media. Similarly, Shakerian et al.,30 reported that fruit juices showed higher concentrations after several weeks of storage compared to mineral water. Finally, Sánchez-Martínez et al.,19 emphasized, through successive leaching cycles with acetic acid, that both the duration and the repetition of exposure increased Sb release, particularly in reuse scenarios.
Taken together, these results demonstrate that contact duration is a critical factor in antimony release. It directly influences internal diffusion within the polymer matrix and reveals the stability limits of plastic packaging. By adopting variable durations, the authors highlighted both realistic consumption scenarios and extreme situations, providing a comprehensive view of the potential risk associated with chronic Sb exposure.
Variability of Sb migration concentrations across the 13 studies
The concentrations of antimony (Sb) migrated into food matrices and simulants varied widely among the 13 included studies. In bottled mineral or drinking water, most reported values remained below the international limit of 5 µg/L, with concentrations typically ranging between 0.02 and 4.4 µg/L under ambient conditions.9,12,13,16 However, under elevated temperatures or prolonged storage, some studies documented higher releases. For instance, Carneado et al.,15 and Fan et al.,18 observed exceedances of the 5 µg/L threshold in water stored at 60-70 °C for several weeks. Chapa-Martínez et al.,17 reported concentrations up to 18.5 µg/L under severe storage conditions in Mexico, while Sánchez-Martínez et al.,19 noted values reaching 6.4 µg/L during repeated leaching cycles with acetic acid.
Beyond water, other beverages and complex food matrices showed distinct patterns. Liu et al.,28 found total Sb levels up to 6.6 µg/L in soy sauce, with inorganic Sb(III) representing a substantial fraction. Lin et al.,29 measured Sb(V) in bottled fruit juices, with values up to 1.2 µg/L, while Shakerian et al.,30 reported concentrations between 0.53 and 0.97 µg/L in fruit juices compared to 0.027-0.075 µg/L in mineral water. Isci & Dagdemir,20 observed higher Sb migration in acidic or carbonated drinks, with lemonade showing levels up to 3.72 µg/L. Rungchang et al.,31 examining a wide range of beverages and simulants in Japan, reported migration values up to 14.4 µg/L under high-temperature conditions.
The variability in reported Sb concentrations reflects the interplay of multiple factors, notably matrix composition, storage time, and thermal conditions. In general, bottled water consistently showed the lowest Sb migration under ambient or refrigerated storage, confirming its relative stability.9,13,16 However, the exceedances documented under high temperatures;15,17,18 highlight the susceptibility of PET packaging when exposed to stress conditions that accelerate diffusion processes. Sánchez-Martínez et al.,19 further emphasized that repeated contact and re-use scenarios can amplify Sb release, raising concerns for consumer practices that diverge from single-use recommendations.
Beyond individual studies, a broader comparative interpretation reveals that variations in Sb migration across the literature are not only linked to experimental factors but also to differences in analytical detection limits and bottle color or resin formulation. Moreover, the predominance of PET in the reviewed studies limits our understanding of Sb release from alternative polymers indicating a gap in the literature that warrants further investigation.
The role of the food matrix emerges as equally important. Studies on complex liquids demonstrated that acidic or sugar-rich environments can enhance Sb release compared to plain water. Liu et al.,28 and Lin et al.,29 showed that soy sauce and fruit juices led to measurable Sb levels, while Shakerian et al.,30 highlighted the higher migration potential in fruit juices compared to mineral water. Isci & Dagdemir,20 added evidence from carbonated and acidic beverages, showing measurable increases in Sb concentrations, with lemonade yielding the highest levels in their dataset. Rungchang et al.,31 confirmed that multiple beverage categories, under stress conditions, could approach or exceed regulatory thresholds.
Taken together, these findings demonstrate that while antimony concentrations generally remain within regulatory limits under normal storage, prolonged contact, elevated temperatures, and complex matrices can substantially increase Sb release. The results across the 13 studies collectively indicate that risk assessments must integrate not only packaging material but also storage scenarios and matrix-specific interactions.
Critically, this synthesis underlines that regulatory compliance under standard laboratory tests does not always translate to real-world safety margins. Field-relevant scenarios such as repeated bottle use, exposure to sunlight in transport vehicles, or acidic beverage formulations may create localized exceedances beyond the 5 µg/L SML for Sb. Few studies have explicitly modeled these realistic exposures, underscoring the need for harmonized migration testing that incorporates dynamic temperature cycles and long-term storage simulations.
Phthalate esters
Phthalate esters represent a structurally homogeneous family, defined by a benzene aromatic ring substituted in the ortho position by two ester groups derived from phthalic acid (1,2-benzenedicarboxylic acid). This common motif, C₆H₄(COOR)₂, explains their designation as ‘diesters’, while the nature of the alkoxy side chains imparts specific properties to each molecule. Variations in chain length, degree of branching, and aromatic or aliphatic character modulate lipophilicity, volatility, and compatibility with polymers, which directly influence migration kinetics from packaging materials.8,20,25,32-37 The studies included in this review mainly focused on two broad categories of phthalates: short- and medium-chain compounds such as dimethyl phthalate (DMP), diethyl phthalate (DEP), di-n-butyl phthalate (DBP), di-isobutyl phthalate (DiBP), and benzyl butyl phthalate (BBP); and long-chain phthalates or technical mixtures such as di-(2-ethylhexyl) phthalate (DEHP), diisononyl phthalate (DINP), diisodecyl phthalate (DIDP), and di-n-octyl phthalate (DNOP), investigated under real contact conditions with water, juices, beverages, or oils, as well as in food simulants.38-45
Short- and medium-chain compounds exhibit specific characteristics. DMP and DEP, due to their small size and relative polarity, are often detected at trace levels in bottled waters, with DEP frequently reported in several European countries at measurable concentrations.8,46-49 DBP and DiBP, respectively linear and branched, are commonly co-detected with DEHP in PET-bottled water, with their presence strongly correlated with storage time and temperature.
Among the heavier phthalates, DEHP remains the most prominent. This compound, whose branched C₈ side chains confer strong lipophilicity, is often the most abundant in still mineral waters bottled in PET, as highlighted by Keresztes et al.,6 Tables 3a-3c below summarize the characteristics and results of studies on phthalate ester migration from plastic food packaging, categorized by food matrix, in highlighting the experimental conditions applied, and the levels of phthalate esters detected.
Table 3a: Migration of phthalate esters from plastic packaging into other beverages and dairy products (n=10)
| Type of food or food simulant | Type of plastic studied | Nature of packaging (bottles, films, trays, etc.) | Types of phthalate esters migrated | Exposure temperature (ambient, refrigeration, heating, pasteurization, etc.) | Contact duration (hours, days, months) | Concentration of migrated phthalate esters (DEHP, DBP, BBP, etc.) |
| Milk bottles11 | PS, PET, HDPE, PP | Milk bottles, cream/cheese containers, disposable cups | DMP, DEP, BBP | Room temperature; UV-aging | Not precisely defined | PS cream container: up to 195 ng/mL (milk); PET: up to 77.4 ng/mL |
| Bottled beverages (DW, MW, cola, OFCD, FTD, lemonade)20 | PET | Plastic bottles | DMP, DEP, DBP, BBP, DNOP, DEHP, DINP, DIDP | 4 °C, 25 °C, 40 °C | 0–365 days | DEP: up to 6.34 ng/mL; DBP: ND–5.49; DEHP: ND–8.06; DINP: up to 37.3 ng/mL |
| Soda and beverage samples33 | Not defined | Plastic bottles | DIBP, DNBP, DEHP | Not defined | Not defined | DIBP: 232 EF; DNBP: 301 EF; DEHP: 475 EF (20–400 µg/L spiking) |
| Fruit juices (orange, pomegranate, apricot)10 | PET | Plastic bottles | DEP, DBP, DIBP, DEHP | 25 °C, 4 °C, 40 °C | 1–45 days | DEP: 325 EF; DBP: 345 EF; DIBP: 355 EF; DEHP: 375 EF; Recoveries: 65–75% |
| Distilled water; vinegar, mint extract, salty leaves, pickled cucumber, lemon juice25 | PET | Plastic bottles | DEHP, DBP, BBP | 25 °C, sunlight, 4 °C, 40 °C | 10–90 days | DEHP: 1377–2042 ng/L; DBP: 4010–8432 ng/L; BBP: 4191–6480 ng/L |
| Fruit juices (cherry, peach, apricot, apple)35 | PET | Plastic bottles | DEP, DBP, DEHP, DNOP, DINP, DIDP | Refrigerated; LC-MS/MS 40 °C column | Not precisely defined | DEP: <LOD–32.62 ng/mL; DBP: 1.05–3.18 ng/mL; DEHP: 1.78–5.24 ng/mL; DINP: 20.55–31.19 ng/mL |
| Milk (China)32 | PET | Plastic bottles | DBP, DEHP, BBP | 4 °C, 20 °C, 40 °C | 20 days | DBP up to 1.56 µg/L; DEHP up to 1.72 µg/L; BBP up to 0.61 µg/L |
| Acidic juices (lemon, vinegar, verjuice, Iran)1 | PET | Bottles/containers | DMP, DEP, DnBP, BBP, DEHP, DnOP | Room temp 25 °C; sunlight exposure | Up to 57 days (pred. 365 days) | Median: DEHP 9.8; DnBP 7.9; BBP 4.0; DEP 2.1; DMP 5.2; DnOP 4.9 µg/L |
| Pasteurized bottled milk (Iran, 11 brands)41 | PET | Plastic bottles 946–1000 Ml | DMP, DEP, DBP, DEHP, DnOP | Refrigeration 4–5 °C | 1–4 days | Mean: DnOP 779.3 > DEHP 383.6 > DBP 328.4 > DEP 8.0 > DMP 3.4 ng/L |
| Whole milk (China)21 | Plastic | Bottles (plastic, glass, metal) | DMP, DEP, DIBP, DEHP | 4 °C storage; ambient prep | Not defined | DEP: 2.6–68.3 ng/g; DIBP: 4.8–26.3 ng/g; DEHP: 6.0–79.3 ng/g |
Table 3b: Migration of phthalate esters from plastic packaging into solid, semi-solid food, food simulants and plastic extracts (n=9)
| Type of food or food simulant | Type of plastic studied | Nature of packaging (bottles, films, trays, etc.) | Types of phthalate esters migrated | Exposure temperature (ambient, refrigeration, heating, pasteurization, etc.) | Contact duration (hours, days, months) | Concentration of migrated phthalate esters (DEHP, DBP, BBP, etc.) |
| Pap (maize porridge, Cameroon)36 | PP | Paint buckets | DEHP, DBP, BBP, DNOP, DINP, DIDP | 4 °C, 50–90 °C | 1–72 h; up to 180 min kinetics | >50 µg/L total PAEs at 70–90 °C, pH ≤4 or ≥10 |
| Pickled vegetables (Iran)39 | PET | Containers (bottles/jars) | DMP, DEP, DnBP, BBP, DEHP, DnOP | Ambient 25 °C; sunlight exposure; acidic pH | Up to ~57 days (pred. 1 year) | Means: DMP 0.069; DEP 0.118; DnBP 1.56; BBP 0.061; DEHP 6.35; DnOP 1.12 mg/kg |
| Convenience foods (beans, meat, cakes, potato, fish, milk)2 | PE | Plastic packaging (films) | DEHP, DBP | −4.3–25.1 °C | Up to 150 days | DEHP: <LOD–5.23 mg/kg; DBP: 0.51–2.54 mg/kg |
| Edible oils (Turkey: olive, sunflower, corn, hazelnut, canola)3 | PET | Bottles/containers | DMP, DEP, DBP, BBP, DOP | 25 °C (some 4 °C) | Not defined | Virgin olive: DBP 0.049–1.875 mg/L, BBP 0.212–2.055 mg/L; Sunflower up to 1.778 mg/L DBP |
| Virgin olive oil (Spain)49 | PET | Bottles (PET, glass) | DIBP, DBP, BBP, DEHP | 250 °C incubation; 80–115 °C HS | 8–12 months storage | PET: DIBP 120–216 µg/kg; DBP 97–175; BBP 173–211; DEHP 543–840 µg/kg; Glass: BBP 87–112; DEHP 198–237 µg/kg |
| Plastic leachates from 13 consumer products14 | PVC mainly | Household plastic items | DMP, DEP, DBP, DHP, DIBP, DINP, DIDP, MEHP, DEHP, DPP, BBP, DCHP, PA | Ambient (24 h methanol extraction) | 24 h | LOD ~1.4 pg/mL; recoveries 96–103%; quantitative up to 50 ng/Ml |
| Food simulants: heptane, ethanol, water43 | PVDC | PVDC films | DEHP | 25 °C, 60 °C, 80 °C | Up to 10 h | Migration up to several µg/g (higher in heptane) |
| Food simulants: isooctane, ethanol, acetic acid, sucrose solution45 | PE | Films | BEHP (DEHP), BBP | −18 °C, 4 °C, 20 °C, 40 °C, 60 °C | Up to 240 h | BEHP up to 1.64 mg/kg; BBP up to 0.45 mg/kg |
| Beverage simulants (distilled water, 3% acetic acid)46 | PET | Bottles, cups | 22 PAEs (incl. DIBP, DBP, DEHP, DNOP, DINP, DIDP) | 40 °C | 10 days | Traces: DIBP up to 48.5 ng/kg; DBP up to 498.8 ng/kg; DEHP up to 4 ng/kg; DNOP up to 18.1 ng/kg |
Table 3c: Migration of phthalate esters from plastic packaging into bottled and drinking water (n=14)
| Type of food or food simulant | Type of plastic studied | Nature of packaging (bottles, films, trays, etc.) | Types of phthalate esters migrated | Exposure temperature (ambient, refrigeration, heating, pasteurization, etc.) | Contact duration (hours, days, months) | Concentration of migrated phthalate esters (DEHP, DBP, BBP, etc.) |
| Bottled water (21 brands, China)34 | PET, HDPE | Plastic bottles and caps | DBP, DIBP, DMP, DEHP, DEP, BBP, DnOP, DNP | 60 °C (10 d); room temp storage | 10 days (test) | DBP up to 1165.3 ng/L; DEHP: 8.24–178.31 ng/L; DEP: 858.72 ng/L; BBP <LOQ–0.69 ng/L |
| Bottled water (12 brands, Saudi Arabia + imports)26 | PET, HDPE | Plastic bottles | DMP, DEP, DiPP, DiBP, DnBP, DEHP | 25 °C DI-SPME extraction | Not defined (direct analysis) | DMP: ND–44.3; DEP: ND–48.4; DiBP: 25.3–63.5; DnBP: 9.1–112.2; DEHP: ND–92.8 ng/mL |
| Sachet drinking water (Ghana)37 | HDPE | Film sachets (printed/unprinted) | DMP, DEP, DBP, BBP, DEHP | 8 °C, 30 °C, 40 °C | Up to 28 days | DMP: 0.27–1.83 µg/L; DEP: 0.55–1.96 µg/L; DBP: ND–2.59 µg/L; BBP: up to 1.03 µg/L; DEHP: <5 µg/L |
| Bottled water (Chile, still/sparkling, 4 brands)7 | PET, HDPE | Plastic bottles (500 mL) | DEP, DBP, DEHP, DOP, DMP, DPP, BBP, DEHA | Room temp (25 ± 4 °C, dark storage) | 54–615 days | Brand 1 still: 5.8→24.8 µg/L (DEP/DBP); Brand 1 sparkling: 8.2→16.9 µg/L (DEHP); Brand 4 sparkling: up to 20.6 µg/L (DEHP+DBP) |
| Drinking water (China)38 | Not defined | Plastic packaged foods (unspecified) | DBP, BBP, DEHP, DNOP, DIHP, DIDP, DPP | Room temp, optimized MSPE conditions | Extraction within minutes | LODs: 0.29–2.59 µg/kg; LOQs: 0.97–8.63 µg/kg; Recoveries 70–108% |
| Tap water, barreled water, bottled water (Tianjin, China)40 | PVC, PC, PET | Pipes, barrels, bottles, disposable cups | BBP, DBP, DEHP | Room temp, boiling, 40–60 °C | Immediate–40 days | Tap water Σ3PAEs: 2.4 µg/L; barrels: 1.5 µg/L; bottles: 1.96 µg/L; DEHP ↑135% after 7 days 60 °C |
| Mineral water and drinking water (Russia)42 | PET | PET vs. glass bottles | Phthalates (total quantified) | Refrigerated 2–10 °C | 23 days | PET: 190–290 ng/dm³; Glass: ~8120 ng/dm³ |
| Bottled water (Mexico)44 | PET | Bottles 400–750 mL | DMP, DEP, DBP | 40 °C | 10 days | PET: DMP 1.1–14.8 mg/kg; DBP 9.3–63.6 mg/kg; DEP 3.1 mg/kg (rare) |
| Bottled water (Egypt)8 | PET, HDPE | 1.5 L bottles | DEHP, DBP, DEP | 4 °C, 25 °C, 40 °C | 2 weeks – 6 months | Baseline: DEHP 0.104 µg/L, DBP 0.082 µg/L; After storage: DEHP up to 0.432 µg/L, DBP 0.229 µg/L, DEP 0.062 µg/L |
| Bottled water (6 brands, Iran)47 | PET | 0.5 L bottles | DBP, DEHP, BBP | −18 °C, 0 °C, 4–8 °C, 25 °C, 40 °C | 24 h, 10 d, 30 d, 45 d | DBP: 0.079–0.702 µg/L; DEHP: 0.217–1.610 µg/L; BBP: <LOD–0.130 µg/L |
| Bottled mineral water (Ireland)5 | PET | Bottles (3 brands) | DBP, DEHP | Room temp | Not defined | DBP: 0.063–0.068 µg/L; DEHP: 1.196–1.685 µg/L |
| Mineral water (Hungary)6 | PET | Bottles (0.5–2 L) | DiBP, DBP, BBP, DEHP | 22 °C, 60 °C (24–72 h) | Up to 1283 days | Non-carbonated: DiBP <0.20 µg/L; DBP <0.80 µg/L; BBP <0.10 µg/L; DEHP <1.70 µg/L |
| Drinking water (Portugal)48 | PET | Bottles (PET, glass), tap water | DIBP, DnBP, DEHP | 15–25 °C; 40 °C (EU test) | Market samples; 20 min DI-SPME | PET: DIBP 0.10–1.42 µg/L; DnBP 0.06–1.68 µg/L; DEHP 0.07–0.18 µg/L; Glass: DIBP 1.89 µg/L; DnBP 6.5 µg/L; DEHP 0.02 µg/L |
| Bottled water (Spain)4 | PET, PC, HDPE, LDPE, PS | Bottles, caps, septa | DMP, DBP, BBP, DEHP (not detected) | 40 °C (UNE-EN ISO 177, UNE-EN 13130); ultrasonic | 10 days; 5–15 min | Phthalates not detected |
Food matrices and plastic types investigated in phthalate esters migration studies
The analysis of the 33 included studies shows that the majority of migration assessments have been performed in bottled water (46.87%), followed by juices and carbonated beverages (15.62%), milk (12.50%), convenience foods (9.37%), food simulants (9.37%), edible oils (6.25%), and distilled water (3.12%), as illustrated in Fig 5 (Distribution of food matrices investigated in phthalate ester migration studies). This predominance of water reflects the central role of PET bottles in human exposure pathways and the commercial ubiquity of this matrix. Indeed, numerous investigations have demonstrated that PET-bottled waters are prone to phthalate release, with increases particularly evident under elevated temperature or extended storage. For instance, Zaki & Shoeib,8 reported a temperature-dependent increase in DEHP and DBP concentrations in Egyptian bottled waters, while Keresztes et al.,6 highlighted a clear accumulation of DEHP and DBP in non-carbonated mineral waters stored over long durations in Hungary. Similar trends were documented in Spain and Portugal, where DEP, DBP, and DEHP were consistently detected in PET-bottled waters;4,48 confirming that water is a critical medium for evaluating phthalate esters migration.
Although less represented, other food categories provide complementary insights into the factors influencing migration. Beverages such as juices, sodas, and colas are chemically more complex than water, containing acidity, carbonation, or sugars that can modulate leaching behavior. Isci,35 quantified multiple phthalates including DEHP, DINP, and DIDP in juices, while Isci & Dagdemir,20 showed that carbonated beverages stored for up to 365 days accumulated higher levels of DEHP, DINP, and DNOP, especially under warm conditions. The effect of external factors such as sunlight was also demonstrated by Massahi et al.,25 who reported that reusing PET bottles and exposing them to outdoor temperatures around 40 °C dramatically enhanced DBP, BBP, and DEHP migration into soft drinks. Milk, accounting for 12.50% of the reviewed studies, exemplifies the susceptibility of lipid-rich matrices, with Lin et al.,21 detecting DEHP, DEP, and DIBP in Chinese milk products and Dobaradaran et al.,41 measuring substantial levels of DEHP and DnOP in Iranian pasteurized milk, both highlighting the influence of fat content on phthalate solubility. Solid and semi-solid matrices were less frequently considered but provide important evidence: Yang et al.,2 documented DBP and DEHP in packaged convenience foods such as beans, meat, and cakes, with cakes showing the highest levels, while Sungur et al.,3 and Rios et al.,49 demonstrated that edible oils favor strong enrichment of DBP, BBP, and DEHP, often at concentrations surpassing those detected in aqueous matrices. Food simulants also contributed significantly to this body of evidence, since they permit controlled experimental comparison; Wang et al.,43 demonstrated that DEHP migration from PVDC films followed a polarity gradient (heptane > ethanol > water), while Yang et al.,45 confirmed that DEHP and BBP migrate preferentially into fatty simulants such as isooctane, underscoring the structural basis of phthalate esters lipophilicity. Finally, a smaller subset of studies explored distilled water as a baseline reference, with Chang et al.,46 reporting trace levels of phthalates under standardized conditions.
Regarding packaging polymers, PET remains the dominant material under scrutiny, which is expected given its global use in bottled water, soft drinks, and dairy packaging. However, several studies have also examined other plastics. For example, PE films were investigated in relation to solid and convenience foods;2,45 PVC was assessed in food contact applications,44 and PVDC was studied under laboratory conditions with simulants.43 These results confirm that while PET is the most studied due to its extensive application, other polymers are also relevant and contribute to the overall understanding of phthalate migration.
Taken together, these findings show that the occurrence and extent of phthalate esters migration are strongly dependent on the food matrix, the chemical structure of the phthalates, and the polymer type, with aqueous matrices like water being the most frequently investigated, but lipid-rich matrices such as milk and oils providing critical evidence for the higher affinity of lipophilic phthalates such as DEHP, BBP, DINP, and DIDP.
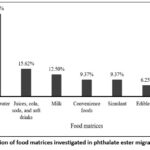 |
Figure 5: Distribution of food matrices investigated in phthalate ester migration studies(n=33). |
Impact of ambient, refrigerated and heated conditions on phthalate esters migration
Across the 33 included studies, storage conditions and temperature regimes were systematically identified as critical determinants of phthalate ester (PAE) migration. Under ambient conditions (≈20-25 °C), detectable but generally moderate concentrations of DEHP, DBP, and DEP were consistently reported in bottled water, juices, and milk, with levels increasing gradually over time. Refrigerated storage (≈4 °C) was associated with markedly lower migration rates, although trace amounts of DBP and DEHP were still measurable, particularly after extended durations exceeding several months. In contrast, heated and sunlight-exposed conditions (40-60 °C) consistently led to significant increases in PAE migration, in some cases doubling or tripling baseline concentrations, with DEHP, DBP, and BBP particularly affected. This trend was confirmed across water, milk, juices, and oils, as well as in controlled migration experiments using food simulants.
The predominance of temperature effects on migration was documented across diverse matrices and geographies. In bottled water, Keresztes et al.,6 showed that DEHP and DBP accumulated progressively over several years of storage at ≈22 °C, while Guart et al.,4 detected measurable levels of DMP, DBP, and BBP after standard migration tests at 40 °C. Santana et al.,48 similarly reported that bottled waters from Portugal contained higher DBP and DIBP when stored under warmer conditions, underlining the universality of these trends. Zaki & Shoeib,8 provided further evidence from Egypt, demonstrating that DEHP and DBP increased sharply in waters exposed to 40 °C sunlight for four months, far exceeding baseline levels recorded at room temperature.
Refrigeration emerged as a mitigating factor but not an absolute barrier. Isci & Dagdemir,20 found that even under 4 °C storage, DINP and DNOP remained detectable in carbonated beverages after 365 days, suggesting that low temperatures slow but do not prevent migration. This observation is consistent with the findings of Dobaradaran et al.,41 who recorded increases in DEHP and DnOP in bottled milk stored at 4-5 °C over four days, as well as with Alshehri et al.,26 who noted that phthalate levels in milk remained measurable under refrigerated distribution conditions.
By contrast, heated storage and accelerated testing produced the highest migration rates. Chang et al.,46 demonstrated that exposure of PET beverage bottles to 40 °C for 10 days resulted in detectable levels of multiple PAEs, including DIBP and DEHP, with concentrations exceeding those found under ambient conditions. Yang et al.,45 confirmed this effect using simulants, showing that DEHP and BBP migrated more rapidly into fatty phases such as isooctane at 40-60 °C compared to 4 °C. Similar conclusions were drawn by Wang et al.,43 whose PVDC migration experiments showed an exponential increase in DEHP leaching as the temperature rose from 25 °C to 80 °C. In practical settings, Massahi et al.,25 reported that reused PET bottles exposed to direct sunlight at ≈40 °C released significantly higher levels of DBP, BBP, and DEHP into soft drinks compared to bottles stored in the shade, underscoring the synergistic effect of heat and UV exposure.
Other matrices also support these findings. In edible oils, Sungur et al.,3 reported DBP and BBP concentrations ranging from 0.049 to 2.055 mg/L depending on storage, with higher values in PET bottles under room and warm conditions compared to glass or tinplate. Rios et al.,49 observed that olive oils stored in PET at ambient and slightly elevated temperatures accumulated DEHP up to 840 µg/kg, significantly higher than in glass bottles. In convenience foods, Yang et al.,2 demonstrated that DBP and DEHP increased in packaged cakes and meat products stored at room temperature, with higher levels in fat-rich foods after longer storage.
Taken together, these studies converge on a consistent conclusion: temperature is the primary factor controlling the migration of phthalate esters from plastic packaging into food and beverages. While ambient storage already permits measurable migration, refrigeration only slows the process, and heating or sun exposure dramatically accelerates it. This behavior reflects both the increased mobility of polymer chains and the greater solubility of lipophilic phthalates (such as DEHP, BBP, DINP, and DIDP) at elevated temperatures, as repeatedly demonstrated in bottled water,6,8,48 milk,22,32,41 juices and sodas,20,25,33,35 oils,3,49 and simulants.43,45,46
Effect of storage time on phthalate esters release
The reviewed studies consistently indicate that storage duration is a key determinant of phthalate ester (PAE) migration from plastic packaging into food and beverages. Short-term experiments (days to weeks) revealed initial release phases where DBP, DEHP, and BBP were detectable at low concentrations. Intermediate-term storage (1-6 months) was associated with a progressive increase in phthalate concentrations, particularly in bottled waters, juices, and milk. Long-term storage extending beyond six months and up to one year or more resulted in substantial accumulation of heavier phthalates such as DEHP, DINP, DIDP, and DNOP, with levels sometimes approaching or exceeding regulatory thresholds. Overall, the evidence shows a clear time-dependent trend: the longer the storage duration, the higher the release of PAEs across most matrices.
The impact of storage time on PAE release has been documented across multiple food matrices and polymer types. In bottled waters, Keresztes et al.,6 demonstrated that DEHP and DBP concentrations steadily increased over storage periods extending to 1283 days, with non-carbonated waters showing the most pronounced trends, while carbonated waters contained negligible levels. Similarly, Santana et al.,48 reported that Portuguese bottled waters stored for extended durations displayed measurable DIBP, DBP, and DEHP, supporting the cumulative effect of time. Zaki & Shoeib,8 observed progressive increases in DEHP and DBP concentrations in Egyptian bottled waters between 2 weeks and 6 months of storage, with outdoor conditions amplifying the effect.
In beverages other than water, prolonged storage also favored higher migration. Isci & Dagdemir,20 found that carbonated drinks stored in PET bottles for up to 365 days contained significantly higher concentrations of DINP, DIDP, and DNOP compared to early time points, suggesting that heavier phthalates accumulate predominantly during long storage. Massahi et al.,25 also showed that phthalate levels in reused PET bottles increased with duration, particularly for DBP, BBP, and DEHP under sunlight exposure, demonstrating that both time and environmental factors synergistically affect migration.
Milk and dairy products further illustrate this effect. Lin et al.,21 measured DEHP, DEP, and DIBP in commercial milk, showing that bound and free fractions of phthalates increased with longer storage. Dobaradaran et al.,41 recorded significant increases in DEHP and DnOP concentrations after just 4 days of refrigerated storage, confirming that even relatively short durations are sufficient to promote measurable release. Alshehri et al.,26 supported these findings by reporting detectable phthalates in milk under distribution conditions, which intensified after extended storage.
Solid and lipid-rich matrices are also sensitive to time. Yang et al.,2 reported higher DBP and DEHP levels in packaged cakes and meats with increasing storage periods, while Sungur et al.,3 showed that edible oils stored in PET bottles accumulated DBP and BBP over time, with concentrations surpassing those observed in oils stored in glass or tinplate. In olive oil, Rios et al.,49 demonstrated a progressive rise in DEHP and DBP in PET containers over 8-12 months, confirming the strong influence of duration in lipid-rich environments.
Evidence from simulant-based studies corroborates these observations. Chang et al.,46 showed detectable increases in multiple PAEs, including DIBP and DEHP, after 10 days of storage at 40 °C, while Yang et al.,45 found that equilibrium concentrations of DEHP and BBP in simulants were reached after several cycles of exposure, reflecting the cumulative impact of repeated contact time. Wang et al.,43 also confirmed time-dependence in PVDC migration experiments, where DEHP leaching increased steadily up to 10 hours.
Taken together, these findings clearly establish that storage time is a critical factor driving PAE release, regardless of matrix or polymer type. Short-term storage may result in low but detectable migration, while medium- and long-term storage substantially increase phthalate concentrations, especially for lipophilic compounds such as DEHP, DINP, DIDP, and DNOP. This cumulative effect has been consistently demonstrated in bottled water,6,8,48 beverages,20,25,33 milk,21,26,32,41 oils,3,49 and simulants,43,45-46 demonstrating a robust and universal time-dependent migration pattern.
The reviewed data also reveal inconsistencies in analytical protocols, particularly in sample pretreatment and quantification methods (GC-MS vs LC-MS/MS), which could partly explain inter-study variability. Some reports quantified only total PAEs, whereas others distinguished between free and bound fractions, resulting in discrepancies of up to several orders of magnitude. This methodological heterogeneity limits direct comparisons but also highlights the urgent need for standardized analytical workflows for PAE monitoring. Harmonization would not only improve data comparability but also enhance the robustness of cumulative exposure assessment.
Variability of phthalate esters migration concentrations across the 33 studies
Across the 33 included studies, reported concentrations of phthalate esters (PAEs) span several orders of magnitude depending on matrix, polymer, storage regime, and analytical sensitivity. In bottled waters, typical values lie in the ng/L-µg/L range: examples include DBP and DEHP rising from sub-µg/L baselines to 0.2-0.4 µg/L after warm/outdoor storage,8 increases of DiBP/DBP/DEHP over months to years under ambient storage,6 low-µg/L totals in Irish and Egyptian brands,5,26 and brand-/time-dependent spreads up to 25 µg/L total PAEs in Chile after >1 year.7 Notably, non-detects also occur under standardized conditions4 underscoring method and scenario effects. In juices/soft drinks, concentrations are typically ng/mL (i.e., µg/L), with multi-analyte detections DEP/DBP/DEHP/DINP/DIDP/DNOP) and clear time-temperature responses up to 365 days.20,35 Milk shows ng/L-ng/g levels linked to lipid content and storage, from detectable DEHP/DBP/DnOP after only a few days41 to free/bound fractions of DEP/DIBP/DEHP in commercial products,21 and low-µg/L sums in some surveys.26,40 Edible oils present higher, mg/L-scale concentrations of DBP/BBP/DEHP in PET vs glass/tinplate3 and progressive enrichment in olive oil stored in PET over 8-12 months.49 Convenience foods range to mg/kg, with DEHP up to 5 mg/kg in cakes and measurable DBP across items,2 and acidic/fermented vegetables showing µg/L-mg/kg-equivalents with DEHP/DBP variability over time, sunlight and pH.1,39 Simulant studies confirm matrix effects, from trace ng/kg detections under EU-like tests46 to mg/kg-level equilibria in fatty simulants,45 and clear polarity/temperature ordering (heptane, ethanol, water) for DEHP.43 Additional variability sources include package/cap materials,26,34 printing/inked films,37 re-use/sunlight,25 carbonation,6 and methodological LOD/LOQ differences.14,38,46
Overall, the discussion of phthalate migration patterns shows that food composition plays an equally significant role as temperature and time. Lipid-rich matrices such as oils, milk, and processed foods consistently exhibited higher DEHP and BBP accumulation, reinforcing the lipophilic nature of these plasticizers. By contrast, aqueous matrices such as bottled water remain more stable, though still vulnerable to gradual contamination over prolonged storage. These matrix-specific migration patterns are consistent with diffusion–partitioning models described in polymer science and should be better integrated into predictive exposure models for risk assessment purposes.
Taken together, the wide dispersion of reported PAE concentrations is systematic rather than random, emerging from the joint action of (i) matrix lipophilicity/polarity, (ii) polymer formulation and contact surface (bottle, cap, film, sachet), (iii) time-temperature history (ambient vs refrigerated vs heated/sun-exposed), and (iv) analytical sensitivity and contamination control. Aqueous matrices (waters, distilled water) naturally cluster in the ng/L-low-µg/L domain, but show large between-study spreads driven by storage and climate: accumulations over months/years at 22 °C,6 steep summer/outdoor slopes at 40 °C,8 brand- and cap-dependent profiles,5,34 and totals expanding with long storage.7 By contrast, lipid-rich or fatty matrices (oils, high-fat foods, milk) upshift the concentration scale by orders of magnitude: mg/L in edible oils packaged in PET,3 time-dependent DEHP enrichment in olive oil,49 and measurable free/bound fractions in milk,21 consistent with the structural hydrophobicity of DEHP, DINP, DIDP and BBP and their preferential partitioning into non-polar phases patterns replicated in simulants where isooctane/heptane, ethanol, water.43,45 Within beverages, acidity, carbonation and sugar modulate outcomes: long-term PET storage elevates DINP/DIDP/DNOP and DEHP in juices/colas,20,35 while re-use and UV/heat further amplify DBP/BBP/DEHP.25 Solid and fermented foods add pH and processing as drivers, with notable ranges in pickled vegetables under sunlight/acid pH.1,39 Superimposed on these matrix/condition effects are packaging-specific contributors: higher migration from printed vs unprinted sachets;37 contributions from closures/caps;26,34 and polymer diversity beyond PET, including PE, PP, PVC, PVDC in films or multilayers,43-45 which helps explain outliers and cross-study heterogeneity. Finally, a share of the variability is analytically driven: stringent blanks and low LOD/LOQ yield more non-detects,4 whereas broader multi-residue methods capture trace-to-low-ng/kg signals.14,38,46 In sum, variability across the 33 studies follows predictable structure-matrix-process logics: hydrophobic PAEs rise with lipid content and temperature/time; aqueous systems remain lower but highly condition-sensitive; and method/packaging specifics (caps, printing, polymer mix) account for much of the remaining dispersion observed across the literature.7-8,14,20,25,34,35,37,45
Methodological considerations and limitations
This systematic review was conducted according to the PRISMA 2020 guidelines, which ensured transparency, reproducibility, and a rigorous screening of relevant studies. The multi-database search strategy (ScienceDirect, PubMed, and Scopus) and the clear inclusion/exclusion criteria helped minimize selection bias and provided a broad coverage of the literature published between 2010 and 2025. These methodological elements represent a key strength, as they allowed a structured comparison of reported migration levels for both antimony and phthalate esters across diverse food matrices and packaging materials.
However, some methodological limitations should be acknowledged. Considerable heterogeneity was observed among the included studies in terms of analytical techniques, experimental designs, food matrices, temperature and time conditions, and units of measurement. This variability limited the possibility of performing a quantitative meta-analysis or establishing unified migration trends across datasets. In addition, certain studies lacked detailed information about polymer composition or storage parameters, which may introduce uncertainty in cross-study comparisons.
To address these constraints, the discussion of influencing factors was intentionally qualitative, focusing on identifying consistent patterns and determining the main parameters driving migration. Future reviews could build on this work by applying harmonized data extraction templates, standardized test protocols, and quantitative meta-analytical tools to enable more robust statistical synthesis. Despite these limitations, the methodological framework adopted here provides a comprehensive and reliable overview of migration behaviors, offering a solid foundation for future experimental and regulatory studies on food contact materials.
Conclusion
This systematic review demonstrates that antimony (Sb) and phthalate esters (PAEs) are recurrent contaminants migrating from plastic food packaging into various food matrices. Across 45 included studies, Sb migration was primarily documented in PET-bottled waters, with most values remaining below the regulatory threshold of 5 µg/L under ambient storage, but reaching as high as 18.5 µg/L under elevated temperatures or acidic conditions. Phthalate esters were more widely investigated, with 32 studies showing their ubiquitous presence in bottled waters, juices, milk, edible oils, and convenience foods. Concentrations ranged from trace levels in aqueous matrices to mg/L or mg/kg levels in lipid-rich foods such as oils and cakes, with DEHP, DBP, and BBP consistently reported as the most abundant compounds.
The synthesis highlights three key determinants of migration: (i) storage temperature, with significant increases observed above 40-60 °C; (ii) storage duration, with progressive accumulation documented up to more than one year; and (iii) food matrix composition, with acidic and fatty products showing enhanced leaching. Although most results fall within current specific migration limits (SMLs), multiple exceedances were observed under stress scenarios, raising concerns for real-life practices such as prolonged storage, re-use of PET bottles, or exposure to sunlight.
Overall, these findings underscore the need for stricter monitoring of both Sb and PAEs, particularly in non-aqueous foods, as well as harmonized protocols for migration testing. Further research is required to address combined exposures, investigate underexplored polymers beyond PET, and integrate toxicological bioassays to refine consumer risk assessment.
Acknowledgement
The authors express their sincere gratitude to the leadership of “Laboratory of Food Science and Bioresource Technology and Human Nutrition, National University of Agriculture” for their valuable support and guidance.
Funding Sources
The author(s) received no financial support for the research, authorship, and/or publication of this article.
Conflict of Interest
The authors do not have any conflict of interest.
Data Availability Statement
Data will be made available on request.
Ethics Statement
This research did not involve human participants, animal subjects, or any material that requires ethical approval.
Informed Consent Statement
This study did not involve human participants, and therefore, informed consent was not required.
Clinical Trial Registration
This research does not involve any clinical trials.
Permission to Reproduce Material from Other Sources
Not Applicable
Author Contributions
- Alabi Séfou-Dine Badarou: Writing-review & editing, Writing-original draft, Visualization, Formal analysis, Conceptualization, Data curation.
- Camel Lagnika: Project administration, Methodology, Validation.
- Harold Mênouwesso Hounhouigan: Conceptualization, Writing-original draft.
- Achille Todègnon Gantongbé: Conceptualization, Writing-original draft.
- Abdou Madjid Amoussa: Conceptualization, Writing-original draft.
- Jiangfeng Song: Review & Editing,
- Latifou Lagnika: Supervision, Writing-original draft.
References
- Arfaeinia L, Dobaradaran S, Nasrzadeh F, et al. Phthalate acid esters (PAEs) in highly acidic juice packaged in polyethylene terephthalate (PET) container: occurrence, migration and estrogenic activity-associated risk assessment. Microchem J. 2020;155:104719. doi:10.1016/j.microc.2020.104719
CrossRef - Yang J, Song W, Wang X, et al. Migration of phthalates from plastic packages to convenience foods and its cumulative health risk assessments. Food Addit Contam Part B Surveill. 2019;12(3):151-158. doi:10.1080/19393210.2019.1574909
CrossRef - Sungur S, Okur R, Turgut FH, et al. Migrated phthalate levels into edible oils. Food Addit Contam Part B Surveill. 2015;8(3):190-194. doi:10.1080/19393210.2015.1041065
CrossRef - Guart A., Bono-Blay F., Borrell A., et al. Migration of plasticizers phthalates, bisphenol A and alkylphenols from plastic containers and evaluation of risk. Food Addit Contam Part A Chem Anal Control Expo Risk Assess. 2011; 28(5), 676-685. doi:10.1080/19440049.2011.555845
CrossRef - Otero P, Saha SK, Moane S, et al. Improved method for rapid detection of phthalates in bottled water by gas chromatography–mass spectrometry. J Chromatogr B Analyt Technol Biomed Life Sci. 2015;997:229-235. doi:10.1016/j.jchromb.2015.05.036
CrossRef - Keresztes S, Tatár E, Czégény Z, et al. Study on the leaching of phthalates from polyethylene terephthalate bottles into mineral water. Sci Total Environ. 2013;458-460:451-458. doi:10.1016/j.scitotenv.2013.04.056
CrossRef - Becerra-Herrera M, Arismendi D, Molina-Balmaceda A, et al. Initial phthalates fingerprint and hydrochemical signature as key factors controlling phthalates concentration trends in PET-bottled waters during long storage times. Food Chem. 2022;372:131248. doi:10.1016/j.foodchem.2021.131248
CrossRef - Zaki G, Shoeib T. Concentrations of several phthalates contaminants in Egyptian bottled water: effects of storage conditions and estimate of human exposure. Sci Total Environ. 2018;618:142-150. doi:10.1016/j.scitotenv.2017.10.337
CrossRef - Kiyataka PHM, Dantas TBH, Brito ACA, et al. Evaluation of different transport and distribution conditions on antimony migration from PET bottles to mineral water. Food Packag Shelf Life. 2025;48:101450. doi:10.1016/j.fpsl.2025.101450
CrossRef - Hosseini M, Ghanbarzadeh B, Pezeshki A, et al. Dispersive solid phase extraction of four phthalate esters as plastic packaging plasticizers from fruit juice samples using ternary metallic-organic framework composite before their determination with gas chromatography. J Food Compos Anal. 2025;140:107227. doi:10.1016/j.jfca.2025.107227
CrossRef - Moradi N, Tavoussi-Shirazi DS, Moshfegh AM, et al. Determination of phthalate esters released from prepared food packaging microplastics by nanoscale grafted silica based fabric phase sorptive extraction. J Food Compos Anal. 2025;145:107764. doi:10.1016/j.jfca.2025.107764
CrossRef - Kiyataka PHM, Marangoni Júnior L, Brito ACA, et al. Migration of antimony from polyethylene terephthalate bottles to mineral water: comparison between test conditions proposed by Brazil and the European Union. J Food Compos Anal. 2024;126:105859. doi:10.1016/j.jfca.2023.105859
CrossRef - Mehdar YTH. Investigating the impact of temperature and storage time on antimony release from polyethylene terephthalate (PET) plastic used for bottled drinking water. Desalination Water Treat. 2024;319:100474. doi:10.1016/j.dwt.2024.100474
CrossRef - Lim HJ, Song H, Son A. Multi-target aptamer assay for endocrine-disrupting phthalic acid ester panel screening in plastic leachates. Chemosphere. 2024;359:142366. doi:10.1016/j.chemosphere.2024.142366
CrossRef - Carneado S, Hernandez-Nataren E, Lopez-Sanchez JF, et al. Migration of antimony from polyethylene terephthalate used in mineral water bottles. Food Chem. 2015;166:544-550. doi:10.1016/j.foodchem.2014.06.041
CrossRef - Andra SS, Makris KC, Shine JP, et al. Co-leaching of brominated compounds and antimony from bottled water. Environ Int. 2012;38(1):45-53. doi:10.1016/j.envint.2011.08.007
CrossRef - Chapa-Martínez CA, Hinojosa-Reyes L, Hernández-Ramírez A, et al. An evaluation of the migration of antimony from polyethylene terephthalate (PET) plastic used for bottled drinking water. Sci Total Environ. 2016;565:511-518. doi:10.1016/j.scitotenv.2016.04.184
CrossRef - Fan YY, Zheng JL, Ren JH, et al. Effects of storage temperature and duration on release of antimony and bisphenol A from polyethylene terephthalate drinking water bottles of China. Environ Pollut. 2014;192:113-120. doi:10.1016/j.envpol.2014.05.012
CrossRef - Sánchez-Martínez M, Pérez-Corona T, Cámara C, et al. Migration of antimony from PET containers into regulated EU food simulants. Food Chem. 2013;141(2):816-822. doi:10.1016/j.foodchem.2013.03.067
CrossRef - Isci G, Dagdemir E. Human health risk assessment of phthalate esters and antimony levels in beverages packaged in polyethylene terephthalate under different storage conditions. J Food Compos Anal. 2024;126:105922. doi:10.1016/j.jfca.2023.105922
CrossRef - Lin J, Chen W, Zhu H, et al. Determination of free and total phthalates in commercial whole milk products in different packaging materials by gas chromatography-mass spectrometry. J Dairy Sci. 2015;98(12):8278-8284. doi:10.3168/jds.2015-10066
CrossRef - Silano V, Barat Baviera JM, Bolognesi C, et al. Update of the risk assessment of di-butylphthalate (DBP), butyl-benzyl-phthalate (BBP), bis(2-ethylhexyl)phthalate (DEHP), di-isononylphthalate (DINP) and di-isodecylphthalate (DIDP) for use in food contact materials. EFSA J. 2019;17(12):e05838. doi:10.2903/j.efsa.2019.5838
CrossRef - World Health Organization (WHO). Guidelines for Drinking-water Quality. 4th ed. Geneva: World Health Organization; 2011.
- Hauser R, Calafat AM. Phthalates and human health. Occup Environ Med. 2005;62(11):806-818. doi:10.1136/oem.2004.017590
CrossRef - Massahi T, Omer AK, Kiani A, Soleimani H, et al. Assessing the effect of sunlight exposure and reuse of polyethylene terephthalate bottles on phthalate migration. Sci Total Environ. 2025;962:178480. doi:10.1016/j.scitotenv.2025.178480
CrossRef - Alshehri MM, Ouladsmane MA, Aouak TA, et al. Determination of phthalates in bottled waters using solid-phase microextraction and gas chromatography tandem mass spectrometry. Chemosphere. 2022;304:135214. doi:10.1016/j.chemosphere.2022.135214
CrossRef - Page MJ, McKenzie JE, Bossuyt PM, et al. The PRISMA 2020 statement: an updated guideline for reporting systematic reviews. Int J Surg. 2021;88:105906. doi:10.1016/j.ijsu.2021.105906
CrossRef - Liu D, Zhu F, Ji W, et al. Determination of trace inorganic antimony in PET-bottled soy sauce by ion chromatography-inductively coupled plasma mass spectrometry. Microchem J. 2019;151:104257. doi:10.1016/j.microc.2019.104257
CrossRef - Lin YA, Jiang SJ, Sahayam AC. Determination of antimony compounds in waters and juices using ion chromatography-inductively coupled plasma mass spectrometry. Food Chem. 2017;230:76-81. doi:10.1016/j.foodchem.2017.03.014
CrossRef - Shakerian F, Dadfarnia S, Haji Shabani AM, et al. Synthesis and characterisation of nano-pore antimony imprinted polymer and its use in the extraction and determination of antimony in water and fruit juice samples. Food Chem. 2014;145:571-577. doi:10.1016/j.foodchem.2013.08.110
CrossRef - Rungchang S, Numthuam S, Qiu X, et al. Diffusion coefficient of antimony leaching from polyethylene terephthalate bottles into beverages. J Food Eng. 2013;115(3):322-329. doi:10.1016/j.jfoodeng.2012.10.025
CrossRef - Wang X, Xu M, Yang A, et al. Health risks of population exposure to phthalic acid esters through the use of plastic containers for takeaway food in China. Sci Total Environ. 2021;785:147347. doi:10.1016/j.scitotenv.2021.147347
CrossRef - Farajzadeh MA, Ebrahimi S, Pezhhanfar S, et al. Dispersive micro solid phase extraction of three phthalate esters and bis-(2-ethylhexyl) adipate from the plastic packaged soda and beverage samples using MIL-96(Al). Microchem J. 2025;211:113030. doi:10.1016/j.microc.2025.113030
CrossRef - Guo R, Liang X, Su M, et al. Occurrence, migration and health risks of fluorescent whitening agents and phthalates in bottled water. J Hazard Mater. 2024;476:134631. doi:10.1016/j.jhazmat.2024.134631
CrossRef - Isci G. Assessment of phthalate esters in packaged fruit juices sold in the Turkish market and their implications on human health risk. Food Chem. 2024;435:137658. doi:10.1016/j.foodchem.2023.137658
CrossRef - Songue Same O, Nobosse P, Ngolong Ngea GL, et al. Migration study of phthalates from non-food plastic containers used in food preservation. Heliyon. 2023;9(9):e20002. doi:10.1016/j.heliyon.2023.e20002
CrossRef - Angnunavuri PN, Attiogbe F, Mensah B. Effect of storage on the levels of phthalates in high-density polyethylene (HDPE) film-packaged drinking water. Sci Total Environ. 2022;845:157347. doi:10.1016/j.scitotenv.2022.157347
CrossRef - Wei D, Zhang C, Pan A, et al. Facile synthesis and evaluation of three magnetic 1,3,5-triformylphloroglucinol based covalent organic polymers as adsorbents for high efficient extraction of phthalate esters from plastic packaged foods. Food Chem X. 2022;14:100346. doi:10.1016/j.fochx.2022.100346
CrossRef - Cheshmazar E, Arfaeinia L, Vasseghian Y, et al. Phthalate acid esters in pickled vegetables packaged in polyethylene terephthalate container: occurrence, migration, and estrogenic activity-associated risk assessment. J Food Compos Anal. 2021;99:103880. doi:10.1016/j.jfca.2021.103880
CrossRef - Wang C, Huang P, Qiu C, et al. Occurrence, migration and health risk of phthalates in tap water, barreled water and bottled water in Tianjin, China. J Hazard Mater. 2021;408:124891. doi:10.1016/j.jhazmat.2020.124891
CrossRef - Dobaradaran S, Akhbarizadeh R, Mohammadi MJ, et al. Determination of phthalates in bottled milk by a modified nano adsorbent: presence, effects of fat and storage time, and implications for human health. Microchem J. 2020;159:105516. doi:10.1016/j.microc.2020.105516
CrossRef - Khaustov A, Redina M, Goryainov S. Migration of PAHs and phthalates from package materials during water storage: glass or plastic? Polycycl Aromat Compd. 2020;42(2):358-370. doi:10.1080/10406638.2020.1734033
CrossRef - Wang X, Song M, Liu S, et al. Analysis of phthalate plasticizer migration from PVDC packaging materials to food simulants using molecular dynamics simulations and artificial neural network. Food Chem. 2020;317:126465. doi:10.1016/j.foodchem.2020.126465
CrossRef - Salazar-Beltrán D, Hinojosa-Reyes L, Palomino-Cabello C, et al. Determination of phthalate acid esters plasticizers in polyethylene terephthalate bottles and its correlation with some physicochemical properties. Polym Test. 2018;68:87-94. doi:10.1016/j.polymertesting.2018.04.002
CrossRef - Yang J, Li Y, Wu X, et al. Gas chromatography-triple quadrupole tandem mass spectrometry for successive single-surface migration study of phthalate esters from polythene film. Food Control. 2017;73:1134-1143. doi:10.1016/j.foodcont.2016.10.029
CrossRef - Chang L, Bi P, Li X, et al. Study of solvent sublation for concentration of trace phthalate esters in plastic beverage packaging and analysis by gas chromatography–mass spectrometry. Food Chem. 2015;177:127-133. doi:10.1016/j.foodchem.2015.01.013
CrossRef - Jeddi MZ, Rastkari N, Ahmadkhaniha R, et al. Concentrations of phthalates in bottled water under common storage conditions: do they pose a health risk to children? Food Res Int. 2015;69:256-265. doi:10.1016/j.foodres.2014.11.057
CrossRef - Santana J, Giraudi C, Marengo E, et al. Preliminary toxicological assessment of phthalate esters from drinking water consumed in Portugal. Environ Sci Pollut Res Int. 2014;21(2):1380-1390. doi:10.1007/s11356-013-2020-3
CrossRef - Rios JJ, Morales A, Márquez-Ruiz G. Headspace solid-phase microextraction of oil matrices heated at high temperature and phthalate esters determination by gas chromatography multistage mass spectrometry. Talanta. 2010;80(5):2076-2082. doi:10.1016/j.talanta.2009.11.008
CrossRef
Accepted on: 06 Nov 2025
Second Review by: Rishi Richa
Final Approval by: Dr. Vikas Chopra


Web of Science Coverage
Emerging Sources Citation Index (ESCI)
2024 Journal Impact Factor: 1.1
Scopus Journal Metrics
CiteScore 2024: 1.9
CiteScore Details
Sustainable Nutrition: Food Systems, Nutrient Retention, and Public Health Impact
![]()
This journal is a member of, and subscribes to the principles of, the Committee on Publication Ethics (COPE)


