Enzymatic Hydrolysis of Protein Hydrolysate from Pangasius sp. by-Product using Bromelain
 , Muhamad Firdaus1, Asep Awaludin Prihanto1, Abdul Aziz Jaziri1, , , , Elfriede Rositta Debataraja1 and Nurul Huda2
 1Department of Fisheries and Marine Resources Management, Faculty of Fisheries and Marine Science, Universitas Brawijaya, Malang, Indonesia.
2Faculty of Sustainable Agriculture, Universiti Malaysia Sabah, Sandakan, Sabah, Malaysia.
Corresponding Author E-mail: rahmi_nurdiani@ub.ac.id
DOI : http://dx.doi.org/10.12944/CRNFSJ.12.1.10
Download this article as:
![]()
Fish protein hydrolysate (FPH) is a product resulting from the degradation of fish protein into simple peptides and amino acids through hydrolysis. This study aims to optimise the enzymatic hydrolysis conditions of Pangasius sp. by-products to produce high-quality fish protein hydrolysate. Bromelain enzyme was used as the catalyst for hydrolysis. The degree of hydrolysis (DH), pH and antioxidant activity of FPH were used as response parameters. The optimisation was done using response surface methodology (RSM) by applying two factors (enzyme concentration and incubation time) with a 3-level Central Composite Design (CCD) model. The result showed that the bromelain concentration and incubation time of catfish protein hydrolysate gave significantly different effects on the response parameters of Pangasius protein hydrolysate. Hydrolysis of Pangasius protein with 0.04% bromelain enzyme and incubation time of 2.8 hours resulted in DH, pH and DPPH antioxidant activity of 35.88%, 7.07 and 29.86%, respectively. The response value of Pangasius protein hydrolysate was within the range of the predicted value of hydrolysate. Therefore, the optimum conditions suggested by RSM can be used in the future production of Pangasius FPH. In addition, amino acid profiles of Pangasius protein hydrolysate showed high concentrations of Glycine, L-glutamic acid and L-aspartic Acid.
KEYWORDS:Bromelain; Fish Protein Hydrolysate; Optimisation; Pangasius By-Product
Introduction
Pangasius sp. is one of the popular fish commodities in Indonesia that has experienced an increase in production in recent years, which was 11.53% in 2015 1. The global production of Pangasius from 2015 to 2021 shows that catfish production is growing consistently and is expected to experience an increase in trade value by 2023 2. Pangasius is mainly required in whole or fillet form 3. Meanwhile, the amount of waste from Pangasius processing ranges from 20-60% of the raw material 4. The rest of the processing in the form of trimming from Pangasius meat is still not well utilised, so it is necessary to use Pangasius by-products 5. Fish protein can be converted into protein hydrolysates and bioactive peptides to increase its economic value, potentially as a high protein source and reduce possible negative environmental impacts.
Fish protein hydrolysate (FPH) results from breaking fish protein into simple peptides and amino acids through hydrolysis processes by enzymes, acids, or bases 6. Fish protein hydrolysate contain bioactive peptides or short fragments of proteins with residues of 2-20 amino acids that have specific functions, including anti-inflammatory, anti-hypertensive, and anti-microbial 7. Fish protein hydrolysate can be used as an antioxidant source that captures free radicals and binds metal ions 8. Meanwhile, the benefits of protein hydrolysates in the food industry include fortifying ingredients into non-allergenic food formulations for infants and food supplements for diets, food emulsifiers, and ingredients that enhance the characteristics of various products 9. Several studies on fish protein hydrolysates have reported that they can be produced from various kinds of fish, such as milkfish 10, tilapia 11, salmon 12, and catfish 5. The process of making fish protein hydrolysate enzymatically is influenced by the incubation time factor and certain conditions, such as temperature, pH, enzyme concentration and others 13. Incubation in the process of protein hydrolysate production utilises the ability of enzymes to help produce simple peptides in a controlled environment. The optimum conditions for producing protein hydrolysates can be identified by applying Response Surface Methodology (RSM) to attain the highest degree of hydrolysis. RSM is a useful method employing mathematical and statistical modelling techniques to enhance the optimisation of food production 14. Pangasius protein hydrolysate was optimised using the Design Expert v. 11 application in a Central Composite Design (CCD) design to determine the approximate optimal direction of the enzyme concentration and incubation duration treatment factors.
The production of FPH requires enzymes to help accelerate the reaction of the hydrolysis process. One of the enzymes used to obtain protein hydrolysates was proteases such as bromelain 15. Bromelain works to catalyse the reaction of breaking peptide bonds in protein molecules by hydrolysis. Applying papain and different enzyme concentrations was conducted to develop fish protein hydrolysate from Pangasius 5. The use of bromelain in fish protein hydrolysate products has been investigated in independent studies with different bromelain concentrations (1.5% and 0.05 – 0.1%) 16,17. Thus, this study aims to optimise the concentration of bromelain and incubation time during the enzymatic hydrolysis of protein from trimming by-products to produce high-quality fish protein hydrolysate. Degree of hydrolysis (DH), pH and antioxidant activity were used as the responses in the response surface methodology (RSM).
Materials and Methods
Materials
The trimming of Pangasius sp. was obtained from a local processing factory in Sidoarjo, East Java. Samples were separated from fat and skin that was still attached. Then, the sample was ground using a chopper until homogenised. Bromelain enzyme (Nanning Pangbo Biological Engineering Co., Ltd, China), 2,2-diphenyl-1-picrylhydrazyl (DPPH), NaOH 0.2 N, HCl, and other chemicals of analytical grade were also procured from Merck and HiMedia, Germany.
Preparation of Fish Protein Hydrolysate (FPH)
The Pangasius protein hydrolysate was produced following the method outlined by He et al.18. The Pangasius trimmings (150 g) were homogenised with distilled water (1:2 w/v). Subsequently, pH adjustment was performed by adding 0.2 N NaOH to reach pH 7. The mixture was preheated at 55°C for 5 minutes. The hydrolysis of the sample was conducted under controlled temperature in a shaker incubator at 55 °C with various bromelain concentrations and incubation times. Subsequently, the mixture was heated to ~95 °C for 20 minutes to inactivate the enzyme and terminate reaction, followed by cooling to room temperature at ~28 °C . The samples were centrifuged at 4500 rpm for 30 minutes, and the resulting liquid and supernatant were collected.
Experimental Design
Response surface methodology (RSM) was employed to predict the optimum fish protein hydrolysate (FPH) production using bromelain enzyme. Incubation duration (X1, 0.6–3.4 hours) and enzyme concentration (X2, 0.01–0.07%) were selected as independent variables. In our preliminary study,the control treatment (without the addition of bromelain) showed that hydrolysis did not occur even after 4 hours of incubation, as evidenced by the degree of hydrolysis remaining at 0%. The dependent (response) variables were DH, antioxidant activity, and pH. The range and midpoint values of the two independent variables were obtained based on the preliminary study. A Central Composite Design (CCD) was employed for twenty randomised experiments, with each variable coded at five levels (-1.41, -1, 0, +1, and +1.41) as outlined in Table 1. The randomisation of experiments aimed to mitigate the impact of unexpected variability in observed responses. The estimation of responses for both independent and dependent variables and the generation of response surface graphs was conducted using Design-Expert Version 11 software from Stat-Ease Inc. (Minneapolis, MN, USA). Three-dimensional surface plots illustrate the relationship between the response and independent variables for each variable examined in this study.
Table 1: Parameter code settings for the Pangasius protein hydrolysate process using Central Composite Design.
|
Independent Variable |
Symbol |
Code |
||||
|
-1,41 |
-1 |
0 |
+1 |
+1.41 |
||
|
Incubation time (hours) |
X1 |
0.6 |
1 |
2 |
3 |
3.4 |
|
Bromelain concentration (%) |
X2 |
0.01 |
0.02 |
0.04 |
0.06 |
0.07 |
Degree of Hydrolysis
The degree of hydrolysis of the hydrolysed soluble protein extract was determined according to Hoyle and Merritt 19. Specifically, 2 mL of sample was mixed with 20% (v/v) trichloroacetic acid, followed by centrifugation at 10,000 rpm for 20 minutes using the Eppendorf Centrifuge 5415C (Crown Scientific Pty Ltd, Moorebank, NSW, Australia). The supernatant was collected and analysed for nitrogen content following the Kjeldahl method 20. The calculation of degree of hydrolysis was performed using the following formula:
pH Test
The pH test was conducted with a pH meter 20. The cathode end of the pH meter indicator was washed with distilled water before use and cleaned with tissue. Furthermore, the pH meter was calibrated by dipping the cathode tip into the buffer solution. Then the cathode tip was dipped into 10 mL of Pangasius protein hydrolysate sample. The measurement results were read on the pH meter monitor.
Antioxidant Activity
Antioxidant activity measurement was conducted based on the method outlined by Nurdiani et al. 21. Briefly, 100 µL of protein hydrolysate sample solution was mixed with 3,900 µL of 0.075 mM DPPH solution in 95% methanol, followed by a 30-minutes incubation. The absorbance values of samples and blanks were determined using a UV-Vis spectrophotometer at a wavelength of 517 nm.Antioxidant activity was calculated using the following formula:

Amino Acid composition
The amino acid profile was determined through ultra-performance liquid chromatography (UPLC) following the method outlined by SIG (2013) at Saraswanty Indo Genetech Laboratory, Bogor 22. In this process, 0.1 g of the sample was mixed with 5 mL of 6 N HCl thoroughly blended using an ionised vortex. Subsequently, the mixture underwent hydrolysis at 110 °C for 22 hours, then was cooled and transferred to a 50-mL volumetric flask. After the addition of double-distilledwater, the mixture was filtered through a 0.45-μm filter. Further, 500 μL of the filtrate, 40 μm of alpha aminobutyric acid (AABA), and 460 μL of double-distilled water were combined. After adding 10 μL of the solution to 70 μL of AccQ-Fluor borate buffer, the mixture was vortexed and allowed to stand for 1 minute. Fluor A reagent (20 μL) was introduced, and the mixture was vortexed and left to stand for an additional 1 minute. Subsequently, the solution was incubated at 55 °C for 10 minutes, and 1 μL of the resulting solution was injected into the ultra-performance liquid chromatograph equipped with an ACCQ-Tag Ultra C18 column (Waters Co., Milford, MA, USA). Chromatographic separation was achieved at 49 °C, with the mobile phase consisting of two eluents: AccQ·Tagultra eluent A concentrate (5%, v/v) and water (95%, v/v) and AccQ·Tagultra eluent B, each flowing at a rate of 0.7 μL/min. The PDA detector (Water, Massachusetts, USA) was set at a wavelength of 260 nm.
Data Analysis
Experimental data from the different treatments were analysed using multiple regression analysis using Design Expert version 11 (Trial Version, Stat-Ease Inc., Minneapolis, MN, USA). Statistical analysis of the models was performed using Minitab 18 Statistical software (Minitab Pty Ltd., Sydney, NSW, Australia) to evaluate the analysis of variance (ANOVA).
Results and and Discussion
FPH Analysis using Response Surface Methodology (RSM)
Response surface methodology (RSM) was used to optimise conditions for enzymatic protein hydrolysis of Pangasius based on DH, DPPH antioxidant activity and pH parameters. The effect of incubation duration and enzyme concentration on DH, DPPH antioxidant activity and pH are shown in Table 2. The effect of two independent variables, X1 and X2, on the response values are presented in Figure 1.
Table 2: Treatment design
|
Run |
Independent Variable (Factor) |
Dependent Variable (Response) |
|||
|
Incubation Time (hours) (X1) |
Bromelain Concentration (%) (X2) |
Degree of Hydrolysis (%) (Y1) |
pH (Y2) |
Antioxidant Activity (%Inhibition) (Y3) |
|
|
1 |
1 |
0.02 |
14.71 |
7.16 |
11.67 |
|
2 |
3 |
0.02 |
26.68 |
6.88 |
23.83 |
|
3 |
1 |
0.06 |
16.67 |
7.15 |
17.5 |
|
4 |
3 |
0.06 |
32.59 |
6.98 |
21.25 |
|
5 |
0.6 |
0.04 |
14.46 |
7.06 |
14.52 |
|
6 |
3.4 |
0.04 |
40.56 |
6.74 |
29.54 |
|
7 |
2 |
0.01 |
19.54 |
6.97 |
17.03 |
|
8 |
2 |
0.07 |
27.56 |
6.98 |
20.61 |
|
9 |
2 |
0.04 |
33.59 |
7.14 |
31.86 |
|
10 |
2 |
0.04 |
33.05 |
7.14 |
27.59 |
|
11 |
2 |
0.04 |
30.64 |
7.22 |
29.75 |
Experimental data from the different treatments were analysed.A 3-dimensional (3D) response was developed to determine the effects between the two independent factors of incubation duration and enzyme concentration at 0.04% and 2 hours, respectively, and the dependent factors of DH, pH and antioxidant activity, as suggested by design. The results of response surface plots related to the effect of enzyme concentration and incubation time of Pangasius FPH on DH, antioxidant activity, and pH can be seen in Figure 1.
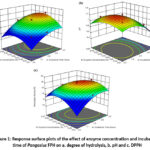 |
Figure 1: Response surface plots of the effect of enzyme concentration and incubation time of Pangasius FPH on a. degree of hydrolysis, b. pH and c. DPPH |
Effect of Bromelain Concentration and Incubation Duration on Hydrolysis Degree (DH) of Pangasius FPH
The analysed DH response values ranged from 14.71% to 40.56% at design points 1 and 11 (Table 2). The analysis of variance (ANOVA) of the Linear Response Surface model for FPH DH is shown in Table 3. Based on the results obtained, the model for DH of Pangasius FPH had a significant R2 value (p<0.05) at 0.9573. ANOVA results showed that enzyme concentration had a significant effect (p<0.05) on DH (0.0019). The same model has been reported in previous studies on enzymatic hydrolysis of different concentrations in different fish species such as herring 23, salmon 24, beluga 25, and carp 26.
In the quadratic coefficient, A2 and B2 significantly (p<0.05) affected the DH of Pangasius FPH. The lack of fit test was used to determine the fit of the model. The results obtained showed that the p-value (0.2153) for the lack of fit test was not significant (p>0.05). Therefore, the model fits the experimental data and is selected to predict the conditions for enzymatic hydrolysis of Pangasius protein.
Table 3: Analysis of variance (ANOVA) hydrolysis degree of FPH
|
Source |
Sum of Squares |
df |
Mean Square |
F-value |
Prob>F |
|
|
Model |
742.02 |
5 |
148.40 |
22.45 |
0.0019 |
significant |
|
A |
524.90 |
1 |
524.90 |
79.39 |
0.0003 |
|
|
B |
46.14 |
1 |
46.14 |
6.98 |
0.0459 |
|
|
AB |
3.90 |
1 |
3.90 |
0.5900 |
0.4771 |
|
|
A² |
56.93 |
1 |
56.93 |
8.61 |
0.0325 |
|
|
B² |
150.08 |
1 |
150.08 |
22.70 |
0.0050 |
|
|
Residual |
33.06 |
5 |
6.61 |
|||
|
Lack of Fit |
28.12 |
3 |
9.37 |
3.80 |
0.2153 |
not significant |
|
Pure Error |
4.93 |
2 |
2.47 |
|||
|
Cor Total |
775.08 |
10 |
||||
|
R2=0.9573, A= Incubation Time (hours), B= Enzyme Concentration (%) |
||||||
A 2D contour plot showing the interaction between incubation duration and bromelain concentration on the degree of hydrolysis response can be seen in Figure 1. Figure 1a shows the increase in the degree of hydrolysis at an incubation duration of about 2.8-3.4 hours and a bromelain concentration of about 0.04% – 0.05%, with the highest result of 40.56%as shown in Table 2). Bromelain concentration of 1.5% and incubation time of 0.5h – 3h can increase the hydrolysis degree of Pangasius FPH, ranging from 10.38% to 29.36% 16.
The length of incubation influences the degree of FPH hydrolysis. Witono et al. 6 stated that the longer the incubation time; the more thorough proteolysis activity is, the more it can increase protein degradation and produce a higher degree of hydrolysis. The degree of hydrolysis is also influenced by enzyme concentration. The longer hydrolysis duration with the addition of enzymes causes the breaking of peptide bonds with maximum speed so that it can produce a higher degree of hydrolysis 27. However, the activity of cutting peptide bonds with bromelain can decrease due to the decreasing substrate available, which can cause inhibition of the active side of the enzyme. Thus, the higher enzyme concentration results in protein damage, and the degree of hydrolysis decreases. This is in accordance with the statement of Wijayanti et al.10 that the addition of enzymes in the hydrolysis process has certain limitations where the addition of excess enzymes will result in a constant degree of hydrolysis because the addition of enzymes does not function on the available substrate.
The fat content can also influence the effect of bromelain performance on the degree of hydrolysis in Pangasius 28. Fats are inhibitors in the protein breakdown process, thereby inhibiting the conversion of protein into peptides and simple amino acids. High fat content in catfish can limit substrate availability, reducing hydrolysis under particular conditions. Bromelain is one of the proteases capable of breaking lipoprotein bonds, thus allowing optimal bond breaking with the help of bromelain 29.
Effect of Bromelain Concentration and Incubation Duration on the pH of Pangasius FPH
The pH response values analysed ranged from 6.74 to 7.22 at design points 1 and 11 (Table 2). The analysis of variance (ANOVA) of the Response Surface Linea model for the pH of Pangasius FPH is presented in Table 4. Based on the results obtained, the model for DH of Pangasius FPH had a significant R2 value (p<0.05) at 0.8694. In the quadratic coefficient, A2 and B2 significantly (p<0.05) affected the antioxidant activity of Pangasius FPH. The lack of fit test was used to determine the fit of the model. The results obtained showed that the p-value (0.2271) for the lack of fit test was not significant (p>0.05).
Table 4: Analysis of variance (ANOVA) for pH of Pangasius FPH
|
Source |
Sum of Squares |
df |
Mean Square |
F-value |
Prob>F |
|
|
Model |
0.1799 |
5 |
0.0360 |
6.65 |
0.0289 |
significant |
|
A |
0.1018 |
1 |
0.1018 |
18.83 |
0.0074 |
|
|
B |
0.0014 |
1 |
0.0014 |
0.2507 |
0.6378 |
|
|
AB |
0.0030 |
1 |
0.0030 |
0.5594 |
0.4882 |
|
|
A² |
0.0648 |
1 |
0.0648 |
11.98 |
0.0180 |
|
|
B² |
0.0273 |
1 |
0.0273 |
5.06 |
0.0744 |
|
|
Residual |
0.0270 |
5 |
0.0054 |
|||
|
Lack of Fit |
0.0228 |
3 |
0.0076 |
3.56 |
0.2271 |
not significant |
|
Pure Error |
0.0043 |
2 |
0.0021 |
|||
|
Cor Total |
0.2070 |
10 |
||||
|
R2=0.8694, A= Incubation Time (hours), B= Enzyme Concentration (%) |
||||||
Figure 1b shows the 3D response surface plot of the effect of bromelain enzyme concentration and incubation time on the pH of Pangasius FPH. The lowest pH value is 6.74, and the highest pH value is pH 7.22. The lowest results in this study are not different from the research of 29, with pH ranging from 6.58-6.81 resulting from hydrolysis with bromelain concentrations of 8% – 16% and incubation times of 2-6 hours. Meanwhile, the pH value of fish protein hydrolysate ranged from 7 to 9 31.
The length of incubation for 6 hours showed the lowest pH results 31. This was due to the longer incubation duration, causing the enzyme to have a more extended hydrolysis process and releasing more carboxylic groups. A protein solution that undergoes hydrolysis results in a decrease in pH as proteases cleave peptide bonds, leading to the release of carboxylate groups and the liberation of hydrogen ions. Additionally, the addition of alkaline compounds (NaOH) in the protein hydrolysis process plays a role in achieving the optimum pH value and maintaining its constancy during hydrolysis, facilitating the continued breaking of peptide bonds by enzymes 10.
In this study, the neutral pH showed the best results for producing Pangasius protein hydrolysate. However, there is no standardised pH for fish protein hydrolysate. The pH optimise enzyme performance, ensuring maximum protein digestibility by measuring the degree of hydrolysis of fish protein hydrolysate. Easily digestible protein indicates that the protein can release hydrogen ions quickly, which is indicated by a faster decrease in pH within a certain period 31.
Effect of Bromelain Concentration and Incubation Duration on Antioxidant Activity of Pangasius FPH
The antioxidant activity response values analysed ranged from 11.67% to 31.86% at design points 1 and 11 (Table 2). The analysis of variance (ANOVA) of the Response Surface Linear model for FPH antioxidant activity is presented in Table 5. Based on the results obtained, the model for DH FPH of Pangasius had a significant R2 value (p<0.05) of 0.9563. In the quadratic coefficients, A2 and B2 significantly (p<0.05) affected the antioxidant activity of Pangasius FPH. The lack of fit test was used to determine the fit of the model. The results obtained showed that the p-value (0.5981) for the lack of fit test was not significant (p>0.05).
Table 5: Analysis of variance (ANOVA) for antioxidant activity of Pangasius FPH
|
Source |
Sum of Squares |
df |
Mean Square |
F-value |
Prob>F |
|
|
Model |
437.91 |
5 |
87.58 |
21.88 |
0.0021 |
significant |
|
A |
172.53 |
1 |
172.53 |
43.09 |
0.0012 |
|
|
B |
8.64 |
1 |
8.64 |
2.16 |
0.2018 |
|
|
AB |
17.68 |
1 |
17.68 |
4.42 |
0.0896 |
|
|
A² |
105.26 |
1 |
105.26 |
26.29 |
0.0037 |
|
|
B² |
198.06 |
1 |
198.06 |
49.47 |
0.0009 |
|
|
Residual |
20.02 |
5 |
4.00 |
|||
|
Lack of Fit |
10.90 |
3 |
3.63 |
0.7972 |
0.5981 |
not significant |
|
Pure Error |
9.12 |
2 |
4.56 |
|||
|
Cor Total |
457.93 |
10 |
||||
|
R2=0.9563, A= Incubation Time (hours), B= Enzyme Concentration (%) |
||||||
The increase in antioxidant activity was attributed to the length of incubation and the optimal enzyme concentration. A longer incubation time, correlating with the increased antioxidant activity of fish protein hydrolysate leads to a varied amino acid composition primarily composed of hydrophobic amino acids 21.Hydrophobic amino acids have been shown to have strong radical scavenging activity due to the presence of imidazole rings as proton donors 8. The antioxidant activity is highly dependent on the hydrophobic amino acid content rather than the peptide size.
During hydrolysis, enzymes influence in helping break peptide bonds produces amino acids with bioactive properties as antioxidants 32. If the enzyme concentration is too high, it will affect the protein’s free radicals inhibition activity 33. The peptides produced from fish protein hydrolysates (which act as antioxidants) do not donate enough hydrogen, so the inhibition tends to decrease. In this study, too high enzyme concentration resulted in a lower inhibition value in the treatment with 0.04% bromelain concentration.
Optimum Value Prediction
Prediction of the optimum value is conducted by setting criteria according to the Central Composite Design method analysis results. At the same time, the confirmation results are obtained by retesting the factor and response variables. The confirmation results predict the maximum value of the verified response parameters by checking reliability and repeatability. The optimum point solution and model verification results can be seen in Table 6.
Table 6: Optimum point solution and verification
|
Factor |
Response |
Desirability |
||||
|
Incubation Time (hours) |
Bromelain Concentration (%) |
Degree of Hydrolysis (%) |
pH |
Inhibition (%) |
||
|
Prediction |
2.8 |
0.04 |
37.24 |
7.00 |
30.48 |
0.933 |
|
Confirmation/ Verification |
2.8 |
0.04 |
35.88 |
7.07 |
29.86 |
|
|
P-value |
0.082 |
0.109 |
0.753 |
|||
|
P-value > 0.5 = not significantly different |
||||||
The verification results in the design expert program with the Central Composite Design method showed that the verification value of the factor was not significantly different (p<0.05) from the predicted response value. The optimum Pangasius protein hydrolysate solution, according to the criteria, is an incubation time of 2.8 hours, bromelain concentration of 0.04% with a predicted response value of the degree of hydrolysis of 37.24%, pH response value of 7, antioxidant activity response value of 30.48%. The confirmation test results obtained are still within the range of predicted values. The FPH optimisation process solution that is considered closest to the optimum is the solution that has a desirability value close to 1 on a scale of 0-1, with 0 indicating low desirability and 1 describing the highest desirability. The desirability value for the projected solution is 0.933. This value serves as a functional indicator for optimisation, indicating how well the program aligns with the set criteria for the final product 34. The optimal formula is identified as the one with the highest desirability value.
Amino Acid Profiles of Pangasius Fish Protein Hydrolysates
The amino acid composition of fish protein hydrolysate obtained under optimal conditions was analysed using the UPLC method. The profile of 18 amino acids present in the fish protein hydrolysate is shown in Table 7.
Table 7: Amino Acid Profiles of Pangasius FPH
|
No |
Amino acid |
Unit |
Result |
|
1 |
L-Alanine |
mg / kg |
35765.4 |
|
2 |
L-Arginine |
mg / kg |
31294.6 |
|
3 |
L-Aspartic Acid |
mg / kg |
37680.2 |
|
4 |
Glysine |
mg / kg |
58876.2 |
|
5 |
L-Glutamic Acid |
mg / kg |
67879.3 |
|
6 |
L-Histidine |
mg / kg |
7389.29 |
|
7 |
L-Isoleucine |
mg / kg |
16492.2 |
|
8 |
L-Cysteine |
mg / kg |
19098.4 |
|
9 |
L-Leucie |
mg / kg |
37882.3 |
|
10 |
L-Lysine |
mg / kg |
42737.2 |
|
11 |
L-Methionine |
mg / kg |
4476.25 |
|
12 |
L-Tryptophan |
mg / kg |
831.5 |
|
13 |
L-Valin |
mg / kg |
19690.2 |
|
14 |
L-Phenylalanine |
mg / kg |
22977.8 |
|
15 |
L-Proline |
mg / kg |
23110.2 |
|
16 |
L-Serine |
mg / kg |
19633.1 |
|
17 |
L-Threonine |
mg / kg |
18715.1 |
|
18 |
L-Tyrosine |
mg / kg |
6389.59 |
In this present study,variability in amino acid composition was observed in fish protein hydrolysates. The results showed a significant (p<0.05)amino acid profile of Pangasius protein hydrolysate, in which Glycine, L-Glutamic Acid and L-Aspartic Acid showed the highest concentrations, about 58876.2 mg/kg, 67879.3 mg/kg, 37680.2 mg/kg, respectively. Meanwhile, L-tryptophan, L-Methionine, and L-histidine showed lower concentrations, about 831.5 mg/kg, 4476.25 mg/kg, and 7389.29 mg/kg, respectively. In most reported fish protein hydrolysates, aspartic acid and glutamic acid were identified as having higher concentrations than other amino acids 35. The high glycine is due to collagen content derived from fish skin that is still attached to the epidermal fish skin whileHumpback Grouper skin and scales have a more elevated glycine amino acid content 36.
Fish protein hydrolysates have been identified as containing essential amino acids necessary for maintaining good health. Fish protein hydrolysate is the breakdown product of the enzymatic conversion of fish protein into smaller peptides, which typically contain 2-20 amino acids 37. When employed as a nutraceutical supplement, the amino acid composition of protein hydrolysate is essential as a crucial determinant of its nutritional profile, functional characteristics, and antioxidative efficacy. Variations in the amino acid composition of fish protein hydrolysates mainly depend on various factors, including the origin of enzymes, the raw materials used to prepare the hydrolysates, and the specific hydrolysis conditions applied 38. Processing conditions can influence the amino acid composition of hydrolysates 39. This substantial amino acid diversity in Pangasius protein hydrolysate emphasises comprehensive analysis and consideration of nutritional implications 40.
Conclusion
The optimisation of Pangasius protein hydrolysate with the factors of incubation time and bromelain concentration presented a significantly different effect on the characteristics of Pangasius protein hydrolysate. Hydrolysis of Pangasius protein with 0.04% bromelain enzyme and incubation time of 2.8 hours resulted in DH, pH and antioxidant activity of 35.88, 7.07 and 29.86%, respectively, under optimised conditions. The response values were within the range of predicted hydrolysate values, so the optimum conditions suggested by RSM can be used in the production of Pangasius FPH.
Acknowledgement
This research was funded by the Ministry of Education, Culture, Research and Technology Indonesia with grand number 438.1/UN10/C10/TU/2021 and Hibah Dosen Asing 2023 Universitas Brawijaya.
Conflict of Interest
The author(s) declares no conflict of interest.
Funding Sources
The authors would like to thank the Ministry of Education, Culture, Research and Technology through the 2021 Basic Research Grant (Number: 438.1/UN10/C10/TU/2021) for funding the research and Hibah Dosen Asing 2023 Universitas Brawijaya for financing the publication.
Authors’ Contribution
Rahmi Nurdiani designed the experiments, performed the experiments, authored or reviewed drafts of the paper, and approved the final draft. Muhamad Firdaus and Asep Awaludin Prihanto analysed the data, authored or reviewed drafts of the paper, and approved the final draft. Muhammad Rayhansyah Jati and Taufiq Rizki Abdurrahman designed the experiments, analysed the data, performed the experiments. Syaravina Ifilah and Elfriede Rositta Debataraja performed the experiments, analysed the data, prepared figures and/or tables. Abdul Aziz Jaziri and Nurul Huda authored, reviewed drafts of the paper and approved the final draft.
Data Availability Statement
The manuscript incorporates all datasets produced or examined throughout this research study.
Ethics Statement
The document accurately and thoroughly presents the authors’ original research and analysis.
Informed Consent Statement
This research did not involve human participants, animal, subjects, or any material that requires ethical approval
Permission to reproduce material from other sources.
Not applicable
References
- Pandiangan, M. Determination of Fatty Acid Composition in Catfish Oil. J Food Technol Agric Prod Res. 2021;1(2):76-82.
- FAO (Food Agriculture Organization). 2023. GLOBEFISH Highlights – Int. Markets for Fisheries and Aquaculture Products – Second Issue 2023, with Jan–Dec 2022 Statistics. GLOBEFISH Highlights, No. 2–2023. Rome.
- Djauhari R., Monalisa S. S. Growth Performance of Pangasius Catfish Given Symbiotic in Stagnant Ground Ponds, Bukit Tunggal, Palangka Raya. J Trop Anim Sci. 2019;8(1):1-8.
- Sitepu G. S., Andayani A. N., Setiabudi G. I., Maharani M. D., Panjaitan F. C. Healthy Cookies: Nutritious Food Innovation Through Fortification by-Products of Tuna (Thunnus sp.) Fish Bone Flour. Adv Trop Biodivers Environ Sci. 2023;7(2):40-86.
CrossRef - Nurilmala M., Nurhayati T., Roskananda R. Industrial Waste of Patin Fish Fillet for Protein Hydrolysate. J Indonesian Fish Prod Process. 2018;21(2):287-294.
CrossRef - Witono Y., Maryanto M., Taruna I., Masahid A. D., Cahyaningati K., Antioxidant Activity of Rasbora Fish (Rasbora jacobsoni) Protein Hydrolysate by Calotropin and Papain Enzyme. Agrotechnol J. 2020;14(1):44-57.
CrossRef - Hou Y., Wu Z., Dai Z., Wang G., Wu G. Protein Hydrolysates in Animal Nutrition: Industrial Production, Bioactive Peptides, and Functional Significance. J Anim Sci Biotechnol. 2017;8(24):1-13.
CrossRef - Samaranayaka A. G. P., Li-Chan E. C. Food-Derived Peptidic Antioxidants: A Review of Their Production, Assessment, and Potential Applications. J Funct Foods. 2011;3(4):229–254.
CrossRef - Santoso S., Nusraningrum D., Hadibrata B., Widyanty W., Isa S. M. Policy Recommendation for Food Security in Indonesia: Fish and Sea Cucumber Protein Hydrolysates Innovation Based. Eur J Bus Manag. 2021;13(7):71-79.
- Wijayanti I., Romadhon R., Rianingsih L. Effect of Papain Enzyme Concentration on Proximate Content and Yield Value of Milkfish (Chanos chanos Forsskal) Protein Hydrolysate. Pena Aquatica. 2015;12(1):13-23.
- Nguyen H. T., Bao H. N., Dang H. T., Tómasson T., Arason S., Gudjónsdóttir M. Protein Characteristics and Bioactivity of Fish Protein Hydrolysates from Tra Catfish (Pangasius hypophthalmus) Side Stream Isolates. Foods. 2022;11(24):312-319.
CrossRef - Siddik M. A., Howieson J., Fotedar R., Partridge G. J. Enzymatic Fish Protein Hydrolysates in Finfish Aquaculture: A Review. Rev Aquacult. 2021;13(1):406-30.
CrossRef - Abbasi S., Moslehishad M., Salami M. Antioxidant and Alpha-Glucosidase Enzyme Inhibitory Properties of Hydrolyzed Protein and Bioactive Peptides of Quinoa. Int J Biol Macromol. 2022;213(1):602-609.
CrossRef - Dinakarkumar Y., Krishnamoorthy S., Margavelu G., Ramakrishnan G., Chandran M. Production and Characterization of Fish Protein Hydrolysate: Effective Utilisation of Trawl By-Catch. Food Chem Adv. 2022;1(1):100138.
CrossRef - Suhandana M., Ginanjar P., Jumsurizal, Putri R. M. S., Septyaningtyas. Chemical Composition of Fish Offal Protein Hydrolysate with Autolysis Concept Using Internal Enzymes in Fish. Fishtech J. 2018; 124-130.
CrossRef - Ha N. C., Hien D. M., Thuy N. T., Nguyen L. T., Devkota L. Enzymatic Hydrolysis of Catfish (Pangasius hypophthalmus) By-Product: Kinetic Analysis of Key Process Parameters and Characteristics of the Hydrolysates Obtained. J Aquat Food Prod Technol. 2017;26(9):1070-1082.
CrossRef - Slizyte R., Rommi K., Mozuraityte R., Eck P., Five K., Rustad T. Bioactivities of Fish Protein Hydrolysates from Defatted Salmon Backbones. Biotechnol Rep. 2016;11(1):99-109.
CrossRef - He S., Franco C., Zhang W. Functions, Applications, and Production of Protein Hydrolysates from Fish Processing Co-Products (FPCP). Food Res Int. 2013;50(1):289-297.
CrossRef - Hoyle N. T., Merritt J. H. Quality of Fish-Protein Hydrolysates from Herring (Clupea harengus). J Food Sci. 1994;59(1):76–79.
CrossRef - AOAC (Association of Official Analytical Chemists), Official Methods of Analysis, Washington D.C.: Association of Official Analytical Chemists, 2005.
- Nurdiani R., Ramadhan M., Prihanto A. A., Firdaus M. Characteristics of Fish Protein Hydrolysate from Mackerel (Scomber japonicus) By-Products. J Hunan Univ Nat Sci. 2022;49(1):75-83.
CrossRef - [SIG] Saraswanti Indo Genetech. 2013. Working instructions for amino acid testing using UPLC method. Instruction number 18-5-17/MU/SMM-SIG. Issued on August 19, 2013.
- Prabha J., Narikimelli A., Sajini M. I., Vincent S. Optimization for Autolysis Assisted Production of Fish Protein Hydrolysate from Underutilized Fish Pellona ditchela. Int J Sci Eng Res. 2013;4(12):1863-1869.
- See S. F., Hoo L. L., Babji A. S. Optimization of Enzymatic Hydrolysis of Salmon (Salmo salar) Skin by Alcalase. Int Food Res J. 2011;18(4):1359–1365.
- Molla A. E., Hovannisyan H. G. Optimization of Enzymatic Hydrolysis of Visceral Waste Proteins of Beluga Huso Huso Using Protamex. Int Aquat Res. 2011;3(2):93–99.
- Wasswa J., Tang J., Gu X., Yuan X. Influence of the Extent of Enzymatic Hydrolysis on the Functional Properties of Protein Hydrolysate from Grass Carp (Ctenopharyngodon idella) Skin. Food Chem. 2007;104(4):1698–1704.
CrossRef - Sahraini F., Razak A. R., Bahri S. Black Sea Cucumber (Holothuria edulis) Protein Hydrolysis Using Crude Bromelain from Pineapple Stem (Ananas comosus l). KOVALEN: J Chem Res. 2021;7(3):214-219.
CrossRef - Hassan M. A., Deepitha R. P., Xavier K. M., Gupta S., Nayak B. B., Balange A. K. Evaluation of the Properties of Spray-Dried Visceral Protein Hydrolysate from Pangasianodon hypophthalmus Extracted by Enzymatic and Chemical Methods. Waste Biomass Valorisation. 2019;10(1):2547-58.
CrossRef - Listyaningrum N. P., Lailatussifa R., Andayani T. R. Characterizations of Milkfish Sauce on Amino Acid Content with Variations in Addition of Salt and Pineapple Extract Concentration. IOP Conf Ser Earth Environ Sci. 2022;1036:1-9.
CrossRef - Anggraini A., Yunianta Y. Effect of Temperature and Duration of Papain Enzyme Hydrolysis on Chemical, Physical, and Organoleptic Properties of Edamame Juice. J Food Agroind. 2015;3(3):1015-1025.
- Jamil N. H., Halim N. R. A., Sarbon N. M. Optimization of Enzymatic Hydrolysis Condition and Functional Properties of Eel (Monopterus sp.) Protein Using Response Surface Methodology (RSM). Int Food Res J. 2016;23(1):1–9.
- Taniyo W., Salimi Y. K., Iyabu H. Characteristics and Antioxidant Activity of Nike Fish (Awaous melanocephalus) Protein Hydrolysate. Dalton: J Chem Educ Chem. 2021;4(2):52-63.
CrossRef - Baehaki A., Lestari S. D., Romadhoni A. R. Protein Hydrolysis from Catfish Prepared by Papain Enzyme and Antioxidant Activity of Hydrolysate. J Indonesian Fish Prod Process. 2015;18(3):230-239.
CrossRef - Ramadhani R. A., Riyadi D. H. S., Triwibowo B., Kusumaningtyas R. D. Utilization of Design Expert for Optimization of Composition of Mixed Vegetable Oils as Raw Materials for Biodiesel Synthesis. J Chem Environ Eng. 2017;1(1):11-16.
CrossRef - Tadesse S. A., Emire S. A., Barea P., Illera A. E., Melgosa R., Beltrán S., Sanz M. T. Valorization of Low-Valued Ray-Finned Fish (Labeobarbus nedgia) by Enzymatic Hydrolysis to Obtain Fish-Discarded Protein Hydrolysates as Functional Foods. Food Bioprod Process. 2023;141(1):167-184.
CrossRef - Malita J. B. N., Suprayitno E. Effect of Demineralization with Sulfuric Acid on Yield, Gel Strength, Viscosity, and Amino Acid of Gelatin Extracted from Lencam Fish Bones (Lethrinus lentjam). Int J Sci Res Pub. 2019;9(6):174-177.
CrossRef - Yaji E. L. A., Wahab N. S. A., Abd-Talib N., Sabri M. Z., Len K. Y. T., Razali N., Pa’ee K. F. Red Tilapia By-Product (Oreochromis sp.) Hydrolysates: Bioactivities, Bioprocessing, and Potential Applications. Advancements in Materials Sci Technol Led by Women. Cham: Springer Nature Switzerland. 2023;105-132.
CrossRef - Nirmal N. P., Santivarangkna C., Rajput M. S., Benjakul S., Maqsood S. Valorization of Fish By-products: Sources to End-Product Applications of Bioactive Protein Hydrolysate. Compr Rev Food Sci Food Saf. 2022;21(2):1803-1842.
CrossRef - Hunsakul K., Laokuldilok T., Prinyawiwatkul W., Utama‐ang N. Effects of Thermal Processing on Antioxidant Activities, Amino Acid Composition, and Protein Molecular Weight Distributions of Jasmine Rice Bran Protein Hydrolysate. Int J Food Sci Technol. 2021;56(7):3289-3298.
CrossRef - Nikoo M., Benjakul S., Ahmadi G. H. Protein Hydrolysates Derived from Aquaculture and Marine By-products Through Autolytic Hydrolysis. Compr Rev Food Sci Food Saf. 2022;21(6):4872-4899.
CrossRef
Accepted on: 07 Feb 2024
Second Review by: Abril Ramírez Higuera
Final Approval by: Gabriel O. Adegoke


Web of Science Coverage
Emerging Sources Citation Index (ESCI)
2024 Journal Impact Factor: 1.1
Scopus Journal Metrics
CiteScore 2025: 2.6
CiteScore Details
Sustainable Nutrition: Food Systems, Nutrient Retention, and Public Health Impact
![]()
This journal is a member of, and subscribes to the principles of, the Committee on Publication Ethics (COPE)


