
Antibacterial Mechanism of Coprinus comatus C18-60% Methanol Fraction Against Staphylococcus aureus
 , Xu Sun1, Mengyuan Wang1, Xinhan Zhu1, Min Sun1and Yuehua Cui1, 2
1College of Bioscience and Biotechnology, Yangzhou University, Yangzhou, China
2National Demonstration Center for Experimental Bioscience and Biotechnology Education, Yangzhou University, Jiangsu China
3Shanghai Institute of Materia Medica, Chinese Academy of Sciences, Shanghai, China
Corresponding Author Email: yhcui@yzu.edu.cn
Download this article as:
ABSTRACT:The C18 fraction eluted with 60% methanol from Coprinus comatus fermentation broth (CF2C60) was examined for its effects on Staphylococcus aureus growth and cellular integrity. Growth monitoring was combined with conductivity measurements, extracellular absorbance at 260 and 280 nm, propidium iodide staining, scanning electron microscopy, and a genomic DNA retardation assay. The reported minimum inhibitory and bactericidal concentrations were 7.5 mg/mL and 15 mg/L, respectively. At the MBC, conductivity reached 24.00 mS/cm after 120 min, 53.8% above the control value. After 8 h, the reported increases in OD260 and OD280 were 30.1% and 23.4%, respectively. Greater PI staining and collapsed or disrupted cells accompanied these changes. The DNA assay provided no detectable evidence of binding under the conditions tested. Taken together, the observations support an antibacterial action associated with loss of membrane integrity and release of intracellular material. Identification of the active constituents and further validation are needed before practical applications can be assessed.
KEYWORDS:Antibacterial Mechanism; Cell Membrane Damage; Coprinus comatus; Methanol Elution Fraction; Staphylococcus aureus
Introduction
Coprinus comatus has been studied as both a food mushroom and a source of biologically active material. Its reported composition includes protein (25.9 g/100 g dry weight), polysaccharides, minerals, vitamins, and essential amino acids, the latter accounting for 34.83% of total amino acids.1,2 Studies of C. comatus preparations have examined antioxidant responses, glucose regulation, lipid metabolism, and immune activity.1,3-5 Work on mushroom extracts has also identified anti-glioma activity, while the C. comatus protein Y3 has been investigated for glycan binding, selective cytotoxicity, and inhibition of tobacco mosaic virus.6-8 These findings illustrate the range of materials obtained from this species, but do not establish how its antibacterial fractions act. Reports of activity against S. aureus, Escherichia coli, and molds provide a more direct basis for investigating the antimicrobial properties of C. comatus preparations.9-11
The relevance of S. aureus to food safety arises in part from its enterotoxins; its virulence factors also contribute to disease in the host.12,13 The clinical consequences of infection vary widely, including skin disease and severe systemic illness.14-16 These concerns, together with antibiotic resistance, motivate the investigation of additional antibacterial materials. Our earlier screening identified activity against S. aureus in C. comatus fermentation products. The present study focuses on CF2C60, the fraction recovered with 60% methanol from a C18 column, and asks whether growth inhibition is accompanied by changes in membrane permeability, cellular morphology, or detectable binding to genomic DNA.
Materials and Methods
Materials and Instruments
The test strain, S. aureus RN4220, was obtained from the Jiangsu Key Laboratory of Zoonosis (Yangzhou, China). A 1% inoculum was used for activation in Mueller-Hinton broth (MH; Qingdao Hi-Tech Industrial Park Hope Bio-Technology Co., Ltd., China). Agar was supplied by Sinopharm Chemical Reagent Co., Ltd. (China). Propidium iodide (PI; Solarbio Science and Technology, Beijing, China) was prepared in ethanol, and phosphate-buffered saline was supplied by BioSharp (Hefei, China). Amberlite FPA55 resin was obtained from Rohm & Haas; genomic DNA was extracted with a spin-column kit from TianGen Biochemical Technology (Beijing) Co., Ltd. Other chemicals and solvents were of analytical grade. Growth measurements used a Spark microplate reader (TECAN, Switzerland). Conductivity was recorded with a CDC401 electrode (HACH, USA), and absorbance at 260 and 280 nm with a UV-759 spectrophotometer (Shanghai Xipu Instrument Co., Ltd., China). Imaging used an IX73 inverted fluorescence microscope (Olympus, Japan) and a GeminiSEM 300 scanning electron microscope (Carl Zeiss Microscopy GmbH, Germany). The electrophoresis apparatus was a JY04S-3E system (Beijing Junyi-Dongfang Electrophoresis Equipment Co., Ltd.).
Sample Preparation
Fractionation began by applying the C. comatus fermentation broth to an FP55 ion-exchange resin. Material eluted with 0.2 M NaCl was desalted before loading onto a C18 silica column. Four methanol concentrations were then applied in sequence: 20%, 40%, 60%, and 100% (v/v in water), with two column volumes used at each step. The eluates were collected separately. Methanol was removed under reduced pressure, and the remaining aqueous material was freeze-dried. The resulting fractions were designated CF2C20, CF2C40, CF2C60, and CF2C100 according to the methanol concentration used for recovery.
The antibacterial activity
For activity testing, S. aureus was grown in MH broth at 37 °C and 180 r/min until OD625 reached 0.9-1.3. The culture was first adjusted to OD625 0.09-0.13 and then diluted to 10⁵ CFU/mL.17 Serial dilutions of each fraction in MH broth were tested in 96-well plates at final concentrations of 15, 7.5, 3.75, and 1.875 mg/mL. Wells received 100 µL of bacterial suspension (10⁵ CFU/mL). Inoculated broth without the fraction and uninoculated broth provided the positive and negative controls, respectively. After 24 h at 37 °C, OD600 was read with the Spark instrument. Survival was calculated using the equation below. The study defined MIC as the lowest tested concentration yielding less than 10% survival.17 For the bactericidal endpoint, 100 µL from wells meeting this survival criterion was plated on MH agar. Plates were held at 37 °C for another 24 h, and the lowest concentration producing fewer than five colonies per plate was designated MBC.

Bacterial Growth Inhibition Curve
A separate 96-well assay followed growth throughout a 24-h exposure. Each treatment well contained equal volumes (100 µL each) of log-phase S. aureus suspension, diluted to 10⁵ CFU/mL, and fraction solution. Final CF2C60 concentrations ranged from 15 to 1.875 mg/mL. Positive-control wells contained 100 µL of bacterial suspension plus 100 µL of MH broth. Sample blanks contained the fraction and medium at the same volumes, without bacteria. Incubation was at 37 °C and 180 r/min; OD600 was recorded hourly with the Spark reader.
Conductivity Measurement of S. aureus
The conductivity protocol was adapted from Rahman et al.18 A 10-mL log-phase S. aureus culture was centrifuged for 5 min at 8000 r/min. The recovered cells were rinsed three times in 0.01 M phosphate buffer, pH 7.4, and resuspended in that buffer at 10⁸ CFU/mL. CF2C60 solutions corresponding to 1/2 MIC, MIC, and MBC were prepared with the same buffer. For each treatment, 1 mL of cell suspension was combined with 9 mL of fraction solution. Mixtures were maintained at 37 °C and 180 r/min, with conductivity readings taken every 30 min. Buffer replaced CF2C60 in the control.
UV Absorption at 260 nm and 280nm
Extracellular UV absorbance was used to follow the release of intracellular material.18 Cells from 10 mL of log-phase culture were recovered at 8000 r/min for 10 min, rinsed three times with 0.1 mol/L phosphate buffer (pH 7.4), and adjusted to 10⁸ CFU/mL. Treatments contained CF2C60 at final concentrations of 1/2 MIC, MIC, or MBC; the control contained cells and buffer alone. Each group was prepared in triplicate and incubated at 37 °C with agitation at 170 r/min. At 2-h intervals, 2 mL was withdrawn and centrifuged for 10 min at 8000 r/min. Supernatant absorbance at 260 and 280 nm was measured using the UV-759 instrument as an indicator of nucleic acid and protein release, respectively.
Propidium Iodide (PI) Fluorescence Assay
PI uptake was examined using the fluorescence assay described previously.19 A 1-mL aliquot of log-phase culture was centrifuged at 4000 r/min for 15 min at 4 °C. After three rinses in 0.1 M phosphate buffer (pH 7.4), cells were adjusted to 10⁸ CFU/mL. CF2C60 exposure was performed at 1/2 MIC, MIC, and MBC for 1 or 3 h at 37 °C, with buffer-treated cells as the control. Cells were then recovered, washed, and resuspended at 10⁸ CFU/mL before PI addition to 3 × 10⁻⁵ mol/L. Staining proceeded for 30 min on ice, protected from light. The IX73 microscope was used for observation, with excitation at 530 nm and emission at 620 nm.
DNA Retardation Analysis
A gel retardation experiment tested for detectable association of CF2C60 with genomic DNA, following Wang et al.20 DNA from S. aureus was prepared with the bacterial genomic DNA extraction kit according to the supplier’s protocol. Aliquots were combined with CF2C60 at final concentrations of 1/2 MIC, MIC, or MBC and left for 30 min at room temperature in the dark. The mixtures were then examined by agarose gel electrophoresis.
Scanning Electron Microscopy (SEM)
SEM sample preparation was based on the procedure of Fu et al., with modifications.17 Log-phase cells at 10⁸ CFU/mL were incubated with CF2C60 at MIC or MBC for 3 h at 37 °C and 170 r/min; a parallel culture received no fraction. Cells were recovered at 6000 r/min for 10 min and rinsed three times with 0.1 M phosphate buffer (pH 7.4). Fixation in 2.5% glutaraldehyde lasted 3 h and was followed by overnight storage at 4 °C. After three further buffer washes, samples passed through an ethanol dehydration series from 30% to 100%, spending 10-15 min at each step. Critical-point drying and gold sputtering preceded examination with the GeminiSEM 300.
Statistical Analysis
Three replicates were performed for each experiment. Results are expressed as mean ± standard deviation (SD). OriginPro 2021 was used for data processing, statistical analysis, and figure preparation.
Results
the Assessment of antibacterial activity
Figure 1 compares S. aureus survival after exposure to the four fractions. The MIC values listed in the current results record are 1.875 mg/mL for CF2C100, 3.75 mg/mL for CF2C60, 7.5 mg/mL for CF2C40, and 15 mg/mL for CF2C20, using survival below 10% as the endpoint. The same source paragraph also gives MIC values of 7.5 and 15 mg/mL for CF2C100 and CF2C60, respectively; this conflicting numerical statement is retained here pending verification of the experimental record. In the subsequent plating assay, 100 µL from the selected wells was cultured for 24 h. All tested concentrations of the 20% and 40% fractions produced more than five colonies. Fewer than five colonies were reported for CF2C60 at 7.5 mg/mL and CF2C100 at 3.75 mg/mL, which were recorded as their respective MBC values. CF2C60 was selected for the mechanistic experiments because its aqueous solubility was better than that of CF2C100.
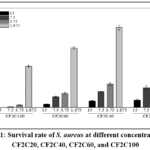 |
Figure 1: Survival rate of S. aureus at different concentrations of CF2C20, CF2C40, CF2C60, and CF2C100. |
Effect on S. aureus Growth Curve
Growth was monitored for 24 h at OD600 across CF2C60 treatments of 0, 1/4 MIC, 1/2 MIC, MIC, and MBC (Figure 2). The results record specifies 100 µL of S. aureus culture at 10⁶ CFU/mL for this assay. Untreated bacteria showed an initial lag of approximately 8 h followed by an increase in OD600 over the remainder of the observation period. In the 1/4 MIC and 1/2 MIC groups, the lag extended to about 13 h. The 1/2 MIC curve approached a plateau at 21 h, whereas the 1/4 MIC curve did so at about 24 h. No logarithmic growth phase was apparent at MIC or MBC during the 24-h experiment. After 21 h, the reported order of the growth signal was control > 1/4 MIC > 1/2 MIC > MIC > MBC. These observations indicate concentration-dependent suppression of growth; they do not identify a specific metabolic or enzyme-synthesis target.
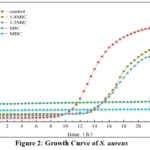 |
Figure 2: Growth Curve of S. aureus |
Effect on Conductivity
Table 1 shows that conductivity was already higher in CF2C60-containing suspensions at the start of exposure, with larger values at higher fraction concentrations. A contribution from the fraction itself is therefore possible. During incubation, the untreated control remained comparatively stable, while treated suspensions showed increasing conductivity. The MBC group reached 24.00 mS/cm at 120 min, 53.8% above the control value at that time. This pattern is consistent with the release of ionic material, although the contribution of CF2C60 to the initial conductivity should be considered when interpreting membrane permeability.
Table 1: Effect of CF2C60 on Conductivity of S. aureus
| Time(min) | Electric conductivity(mS/cm) | |||
| 0 | 1/2MIC | MIC | MBC | |
| 0 | 15.18±0.22 | 17.11±0.01 | 19.43±0.03 | 22.90±0.21 |
| 30 | 15.39±0.11 | 17.28±0.11 | 19.80± 0.05 | 23.60±0.10 |
| 60 | 15.54±0.20 | 17.40±0.03 | 19.88±0.04 | 23.70±0.01 |
| 90 | 15.45±0.10 | 17.79±0.12 | 20.22±0.10 | 23.80±0.05 |
| 120 | 15.60±0.02 | 18.03±0.15 | 20.40±0.12 | 24.00±0.16 |
Effect on Intracellular Macromolecule Leakage
Absorbance at 260 nm provided an indicator of extracellular nucleic-acid-associated material, complementing the conductivity measurements.21 The control signal changed little during incubation (Figure 3). CF2C60-treated samples showed progressively larger signals with increasing exposure time and concentration, ordered MBC > MIC > 1/2 MIC. The reported OD260 increase in the MBC group was 30.1% at 8 h. Together with the other membrane assays, the increase supports release of intracellular material during treatment.
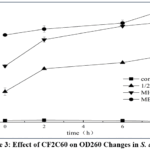 |
Figure 3: Effect of CF2C60 on OD260 Changes in S. aureus |
The OD280 results showed a corresponding treatment-related increase in extracellular UV-absorbing material (Figure 4). The control remained relatively stable, while treated groups followed the order MBC > MIC > 1/2 MIC; the reported increase at MBC was 23.4% after 8 h. This response is consistent with protein release accompanying the OD260 changes. Leakage measurements have also been used in related antibacterial studies.20 The present measurements support altered permeability but do not, by themselves, establish a sequence in which small and large molecules leave the cells.
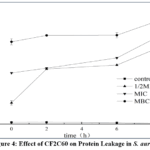 |
Figure 4: Effect of CF2C60 on Protein Leakage in S. aureus |
Effect on Cell Membrane Integrity
PI uptake provided a further readout of membrane integrity because access of the dye to intracellular nucleic acids depends on membrane permeability.21 In Figure 5, staining was more evident after CF2C60 exposure than in the blank control, with the observed order blank < 1/2 MIC < MIC < MBC. The concentration-related increase agrees with the conductivity and supernatant absorbance results. These complementary observations support compromised membrane integrity, although qualitative fluorescence images alone do not quantify the extent of cell killing.
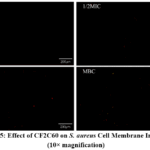 |
Figure 5: Effect of CF2C60 on S. aureus Cell Membrane Integrity (10× magnification). |
Effect on DNA
The genomic DNA retardation experiment did not reveal an appreciable change in band intensity across the CF2C60 concentrations tested (Figure 6). Thus, this assay provided no detectable evidence of DNA binding under the experimental conditions. The result does not exclude interactions outside those conditions or indirect effects on intracellular DNA. Band brightness alone also cannot establish that DNA molecular weight is unchanged.
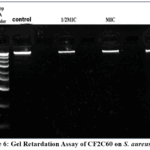 |
Figure 6: Gel Retardation Assay of CF2C60 on S. aureus DNA |
Effect on Cell Morphology
Untreated S. aureus cells retained a rounded appearance with clearly defined contours in the SEM images (Figure 7). Cells exposed at MIC displayed collapse, whereas the MBC field contained more disrupted structures, fragments, and material consistent with released cellular contents. Intact cells were less evident at MBC than in the control or MIC images. These morphological observations complement the permeability assays and support damage to the cell envelope. Other antibacterial treatments have been examined using related approaches.17,22,23 However, the images do not identify whether CF2C60 directly affects peptidoglycan cross-linking or degrades a particular wall component.
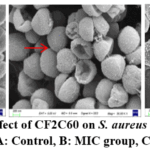 |
Figure 7: Effect of CF2C60 on S. aureus Morphology |
Discussion
The main mechanistic finding is the agreement among several cellular readouts. CF2C60 exposure coincided with rising conductivity, increased extracellular absorbance at 260 and 280 nm, greater PI uptake, and visible envelope damage. Conductivity and absorbance address material released from cells, while PI staining and SEM provide complementary observations of permeability and morphology. Their agreement supports membrane injury as an important feature of the antibacterial response. The growth curves establish inhibition over the observation period, but neither those curves nor the imaging results establish the initiating molecular target. This work also sits within the broader investigation of fungal antibacterial materials. Antibiotic resistance in S. aureus remains an important motivation for such research,24 and surveys of macrofungal diversity describe a substantial resource for further investigation.25 Reviews and experimental studies describe multiple antimicrobial actions of mushroom preparations rather than a single mechanism shared by all extracts.26-28 Reports on Grifola frondosa extracts against MRSA biofilms and on Trichoderma viride fermentation products provide related examples.29,30 Computational work on Ganoderma compounds has considered candidate S. aureus protein targets,31 whereas work on Pleurotus platypus has examined ROS generation and membrane disruption.32 These studies provide context; their reported targets, antibiofilm effects, and activity against resistant strains cannot be assumed for CF2C60. Wang et al.33 examined bacitracin-Ag nanoclusters against Shigella flexneri using extracellular absorbance at 260 nm, membrane-permeability measurements, and electron microscopy. Their findings provide a comparison for interpreting leakage together with morphology. Differences in the antibacterial material and test organism preclude assuming the same molecular target or antibiofilm activity for CF2C60.
The DNA assay narrows the interpretation only within its detection conditions: no binding evidence was detected, but DNA-related effects cannot be ruled out in general. Likewise, SEM cannot establish a specific cell-wall biochemical target. Initial conductivity differences between groups may partly reflect the fraction, and this contribution should be distinguished from the changes associated with cells. Background absorbance from CF2C60 should also be checked when interpreting UV measurements. These considerations limit how specifically the present observations can define the mechanism. The earlier fermentation broth was reported to have an MIC of 31.3 mg/mL, compared with 7.5 mg/mL for CF2C60 in the abstract and discussion, suggesting an approximately fourfold difference if the values and assay conditions are confirmed as comparable. The MIC/MBC entries elsewhere in the current manuscript conflict with these values and require reconciliation before that comparison is finalized. Further fractionation and chemical characterization, for example by HPLC-MS, are needed to identify the active constituents. The present study does not establish an advantage over ampicillin, reduced adverse effects, antibiofilm efficacy, or performance against antibiotic-resistant isolates. Application-oriented work would also require safety evaluation and testing in relevant biological or food systems. Ju et al.34 reported developmental arrest in Caenorhabditis elegans exposed to antibiotic-resistant Leucobacter sp. HNU-1 without a detectable reduction in lifespan. Although that study did not test CF2C60, it illustrates why future host-level assessment should consider development as well as survival, rather than relying on a single endpoint.
Conclusion
CF2C60 from C. comatus fermentation broth inhibited S. aureus growth and produced a pattern consistent with loss of membrane integrity. At the treatment designated MBC (15 mg/mL in this section of the source manuscript), growth was suppressed and conductivity was 53.8% above the control after 120 min. The reported OD260 and OD280 increases at 8 h were 30.1% and 23.4%, respectively. Increased PI staining and disrupted cellular morphology supported the same interpretation. No detectable DNA-binding evidence was obtained in the retardation assay under the conditions tested. The findings justify further investigation of CF2C60 and its active constituents, but do not yet establish a specific molecular target, safety, or practical efficacy. The conflicting MIC/MBC records must be reconciled before the quantitative conclusions are finalized.
Acknowledgment
We thank the colleagues who assisted with experiments and sample collection, and the reviewers and editors for their comments on the manuscript.
Funding Sources
This research was funded by Yangzhou Innovation Capability Enhancement Fund/ Program (YZ2023245)
Conflicts of Interest
The authors declare no conflicts of interest.
Data Availability Statement
The data presented in this study are available on request from the corresponding author.
Ethics Statement
This research did not involve human participants, animal subjects, or any material that requires ethical approval.
Informed Consent Statement
This study did not involve human participants, and therefore, informed consent was not required.
Clinical Trial Registration
This research does not involve any clinical trials.
Permission to Reproduce Material from Other Sources
Not Applicable.
Author Contributions
- Xiexin Hu: Investigation, Data Curation, Formal Analysis, Visualization, Writing – Original Draft.
- Xu Sun: Investigation, Methodology, Data Collection.
- Mengyuan Wang: Investigation, Data Collection, Formal Analysis.
- Xinhan Zhu: Investigation, Data Curation, Visualization.
- Min Sun: Methodology, Resources, Writing – Review & Editing.
- Yuehua Cui: Conceptualization, Supervision, Project Administration, Writing – Review & Editing, Funding Acquisition.
References
- Stilinović N, Čapo I, Vukmirović S, et al. Chemical composition, nutritional profile and in vivo antioxidant properties of the cultivated mushroom Coprinus comatus. R Soc Open Sci. 2020;7(9):200900. doi:10.1098/rsos.200900
CrossRef - Stojković D, Reis FS, Barros L, et al. Nutrients and non-nutrients composition and bioactivity of wild and cultivated Coprinus comatus (O.F.Müll.) Pers. Food Chem Toxicol. 2013;59:289-296. doi:10.1016/j.fct.2013.06.017
CrossRef - Ratnaningtyas NI, Hernayanti, Ekowati N, Sukmawati D, Widianti H. Chicken drumstick mushroom (Coprinus comatus) ethanol extract exerts a hypoglycaemic effect in the Rattus norvegicus model of diabetes. Biocatal Agric Biotechnol. 2019;19:101050. doi:10.1016/j.bcab.2019.101050
CrossRef - Yuan X, Nagamine R, Tanaka Y, et al. The effects of dietary linoleic acid on reducing serum cholesterol and atherosclerosis development are nullified by a high-cholesterol diet in male and female apoE-deficient mice. Br J Nutr. 2023;129(5):737-744. doi:10.1017/S0007114522001325
CrossRef - Yang BK, Jeong YT, Jung YS, et al. Immuno-modulating activities of water soluble exo-poly-saccharides obtained from submerged culture of Coprinus comatus. Proceedings of the Korean Society of Food Science and Nutrition [in Korean]. 2007:258-258.
- Nowakowski P, Markiewicz-Żukowska R, Gromkowska-Kępka K, et al. Mushrooms as potential therapeutic agents in the treatment of cancer: evaluation of anti-glioma effects of Coprinus comatus, Cantharellus cibarius, Lycoperdon perlatum and Lactarius deliciosus Biomed Pharmacother. 2021;133:111090. doi:10.1016/j.biopha.2020.111090
CrossRef - Zhang, K. Li, G. Yang, C. Xia, J.E. Polston, G. Li, S. Li, Z. Lin, L. Yang, S.D. Bruner, & Y. Ding, Cytotoxic protein from the mushroom Coprinus comatus possesses a unique mode for glycan binding and specificity, Proc. Natl. Acad. Sci. U.S.A. 114 (34) 8980-8985, https://doi.org/10.1073/pnas.1706894114 (2017).
CrossRef - Xiao H, Bian Y, Huang H, Zhang Z, Wu L, Wu L. Inhibitory effect of protein Y3 from Coprinus comatus on tobacco mosaic virus. Pestic Biochem Physiol. 2020;168:104474. doi:10.1016/j.pestbp.2019.09.012
CrossRef - Cabutaje EM, Seki K, Kodama M, et al. Coprinolide, a novel antifungal tricyclic polyketide with a rare furanone-fused chromene skeleton isolated from the mushroom Coprinus comatus. J Pestic Sci. 2024;49(4):243-254. doi:10.1584/jpestics.D24-040
CrossRef - Johansson M, Sterner O, Labischinski H, Anke T. Coprinol, a new antibiotic cuparane from a Coprinus species. Z Naturforsch C J Biosci. 2001;56(1-2):31-34. doi:10.1515/znc-2001-1-205
CrossRef - Zenkova AV, Efremenkova VO, Ershova YE, et al. Antimicrobial activity of medicinal mushrooms from the genus coprinus (fr.) s. f. gray (agaricomycetideae). Int J Med Mushrooms. 2003;5(1):6.
CrossRef - Shalaby M, Reboud J, Forde T, Zadoks RN, Busin V. Distribution and prevalence of enterotoxigenic Staphylococcus aureus and staphylococcal enterotoxins in raw ruminants’ milk: a systematic review. Food Microbiol. 2024;118:104405. doi:10.1016/j.fm.2023.104405
CrossRef - Touaitia R, Ibrahim NA, Abdullah Almuqri E, Basher NS, Idres T, Touati A. Toxic shock syndrome toxin-1 (TSST-1) in Staphylococcus aureus: prevalence, molecular mechanisms, and public health implications. Toxins (Basel). 2025;17(7):323. doi:10.3390/toxins17070323
CrossRef - Rahimi-Jamnani F, Moradi HR, Fateh A, et al. The therapeutic efficacy of MS473, a fully human single-chain variable fragment targeting Staphylococcus aureus toxic shock syndrome toxin-1, in a D-galactosamine-sensitized mouse model of lethal shock. BMC Microbiol. 2025;25:95. doi:10.1186/s12866-025-03825-8
CrossRef - Valobdás NB, Alves MR, da Silva EASR, et al. Severe Staphylococcus aureus infection: associated factors and outcomes. Braz J Infect Dis. 2025;29(5):104573. doi:10.1016/j.bjid.2025.104573
CrossRef - Woods B, Kilgore SH, Nikiciuk M, et al. Skin levels of toxic shock syndrome toxin-1 predict the severity of atopic dermatitis. J Allergy Clin Immunol. 2025;156(2):480-482. doi:10.1016/j.jaci.2025.05.018
CrossRef - Fu S, Yang S, Fu S, et al. Synergistic antimicrobial effects of polyphenolic Chinese medicine active compounds-loaded photothermal nanoparticles against multidrug-resistant Staphylococcus aureus Phytomedicine. 2025;148:157498. doi:10.1016/j.phymed.2025.157498
CrossRef - Rahman MRT, Henley F, Fliss I, Biron E. Breaking Staphylococcus aureus biofilms with the antimicrobial lipopeptide humimycin and its synthetic analogs. The Microbe. 2025;8:100509. doi:10.1016/j.microb.2025.100509
CrossRef - Likhar V, Palamae S, Buatong J, Ahmed AS, Zhang B, Benjakul S. Antimicrobial activity of Duea ching (Ficus botryocarpa) fruit extract toward Listeria monocytogenes and Staphylococcus aureus and the synergism with UV-C and modified atmosphere packaging in refrigerated Asian seabass slices. Food Biosci. 2025;68:106663. doi:10.1016/j.fbio.2025.106663
CrossRef - Wang YL, He YL, Qian Y, et al. Integrating transcriptomics and molecular docking to reveal the antibacterial mechanism of cedrol against methicillin-resistant Staphylococcus aureus. Food Biosci. 2025;73:107624.
CrossRef - Liu F, Liu Y, Sun Z, et al. Preparation and antibacterial properties of ε-polylysine-containing gelatin/chitosan nanofiber films. Int J Biol Macromol. 2020;164:3376-3387. doi:10.1016/j.ijbiomac.2020.08.152
CrossRef - Yang X, Lan W, Xie J. Antimicrobial and anti-biofilm activities of chlorogenic acid grafted chitosan against Staphylococcus aureus. Microb Pathog. 2022;173(Pt A):105748. doi:10.1016/j.micpath.2022.105748
CrossRef - Zhang J, Hu Z, Chen D, et al. Inactivation effect of Staphylococcus aureus and application on fresh-cut pineapples by plasma-activated tartaric acid. Food Biosci. 2023;54:102789. doi:10.1016/j.fbio.2023.102789
CrossRef - Lade H, Kim JS. Molecular determinants of β-lactam resistance in methicillin-resistant Staphylococcus aureus (MRSA): an updated review. Antibiotics (Basel). 2023;12(9):1362. doi:10.3390/antibiotics12091362
CrossRef - Li YM, Tuo YL, Li YS, Zhang B, Li Yu.An overview of research on macrofungal diversity in china.Journal of Fungal Research. 2026; 24(1): 1-25. DOI: 10.13341/j.jfr.2025.1853
- Akamu E, Merrills L, Williams Z, et al. In vitro antimicrobial efficacy assessment of ethanolic, aqueous, and dual solvent extracts of mushroom Ganoderma lucidum: genomic and morphological analysis. Antibiotics (Basel). 2024;13(12):1109.
CrossRef - Karunarathna SC, Patabendige NM, Hapuarachchi KK, et al. Exploring the health benefits of Ganoderma: antimicrobial properties and mechanisms of action. Front Cell Infect Microbiol. 2025;15:1535246.
CrossRef - Moussa AY, Fayez S, Xiao H, Xu B. New insights into antimicrobial and antibiofilm effects of edible mushrooms. Food Res Int. 2022;162(Pt A):111982. doi:10.1016/j.foodres.2022.111982
CrossRef - Fasciana T, Gargano ML, Serra N, et al. Potential activity of albino Grifola frondosa mushroom extract against biofilm of meticillin-resistant Staphylococcus aureus. J Fungi (Basel). 2021;7(7):551.
CrossRef - Yang PB.study on inhibition and mechanism of Trichoderma viride fermentation broth against Staphylococcus aureus.Zhong kai unversity of agriculture and engineering(in chinese).2013,guangzhou china master dissertation
- Nguyen TTT, Nguyen TTT, Nguyen HD, et al. Anti-Staphylococcus aureus potential of compounds from Ganoderma sp.: a comprehensive molecular docking and simulation approaches. Heliyon. 2024;10(7):e28118. doi:10.1016/j.heliyon.2024.e28118
CrossRef - Bandyopadhyay S, Naskar A, Acharya K, Mandal S. Antibiofilm and antivirulence efficacy of Pleurotus platypus methanolic extract against Staphylococcus aureus through ROS generation and cell membrane disruption. Microb Pathog. 2024;196:106992. doi:10.1016/j.micpath.2024.106992
CrossRef - Wang L, Liu L, Zhou X. Bacitracin-Ag nanoclusters as a novel antibacterial agent combats Shigella flexneri by disrupting cell membrane and inhibiting biofilm formation. Nanomaterials (Basel). 2021;11(11):2928. doi:10.3390/nano11112928
CrossRef - Ju J, Lu X, Gao Z, Yin H, Xu S, Li H. Genome sequencing of the antibiotic-resistant Leucobacter HNU-1 and its developmental toxicity in Caenorhabditis elegans. Int J Mol Sci. 2025;26(8):3673. doi:10.3390/ijms26083673
CrossRef
Abbreviations
MIC – Minimum inhibitory concentration
MBC – Minimum bactericidal concentration
PI – Propidium iodide
SEM – Scanning electron microscopy
DNA – Deoxyribonucleic acid
TMV – Tobacco mosaic virus
MHB – Mueller-Hinton broth
PBS – Phosphate-buffered saline
MeOH – Methanol
SD – Standard deviation
OD – Optical density (used as OD625, OD600, OD260, and OD280 to measure absorbance)
CFU – Colony-forming unit
MRS – Multidrug resistance
ROS – Reactive oxygen species
HPLC-MS – High-performanceliquid chromatography-mass spectrometry

Accepted on: 26 Jun 2026
Second Review by: Rahul Kumar
Final Approval by: Dr. Shih-Min Hsia





Web of Science Coverage
Emerging Sources Citation Index (ESCI)
2024 Journal Impact Factor: 1.1
Scopus Journal Metrics
CiteScore 2025: 2.6
CiteScore Details
Sustainable Nutrition: Food Systems, Nutrient Retention, and Public Health Impact

This journal is a member of, and subscribes to the principles of, the Committee on Publication Ethics (COPE)