Determination and Risk Evaluation of Heavy Metals in Fish Samples Using AAS After Microwave-Assisted Digestion
 *, Qais Jarrar2, Rami Ayoub2, Zead Abudayeh2, Louai Alsaloumi2, Tariq Hantash3, Ahmad Mostafa3, Rania Ghanem3, Loay Hassouneh4, Lukman Bola Abdulra’uf5
 1Department of Pharmacy, Amman Arab University, Amman, Jordan
2Department of Applied Pharmaceutical Sciences, Isra University, Amman, Jordan
3Jordan Food and Drug Administration, Amman, Jordan
4Biology Program Education, Faculty of Education and Arts, Sohar University, Sultanate of Oman.
5Department of Chemistry and Industrial Chemistry, Kwara State University, Malete, Nigeria
Corresponding Author Email: a.sirhan@aau.edu.jo
DOI : http://dx.doi.org/10.12944/CRNFSJ.14.1.10
Download this article as:
![]()
The safety level and impacts of bioaccumulation of Cd, Hg and Pb various fish samples were determined in the present study. The accurate determination of the concentration of metals in fish samples is necessary due to the health risks associated with the bioaccumulation of heavy metals in the human system through the ingestion of contaminated fish samples. AAS analysis was employed after microwave-assisted wet acid digestion. The results showed that frozen tuna has the highest concentration of mercury (157.09 ± 23.04 µg/kg), that is in line with the pattern of heavy metal accumulation of in fishes. Non-predatory fish samples, including bata (0.87 ± 0.01 µg/kg) and chapil (0.06 ± 0.01 µg/kg), had lower mercury levels. In all samples, the amount of Pb was lower than the level of Hg. Merluccius pacifia had the highest concentration of Pb (27.08 ± 0.00 µg/kg), whereas salmon (1.33 ± 0.15 µg/kg) and and basa fillets (1.51 ± 0.72 µg/kg) had the lowest concentrations of Pg. Cadmium was found to absent in all the fish samples examined. The results of the present study showed that environmental exposure and proximity to industrial effluents have impacts on the bioaccumulation of heavy metals. It was also observed that removing organs that have the potential to bioaccumulate heavy metals is one way to prevent heavy metal contamination, through appropriate handling and preparation techniques. The concentration of Pb and Hg were found below the EU limit. Mercluccius pacifica had the highest THQ for Pb (1.4), whereas tuna had the highest THQ for Hg (84.82). THQ greater than 1 for Hg was surpassed by more than 10 species, suggesting a health risk.
KEYWORDS:AAS; Fish; Heavy Metals; Microwave; Digestion
Introduction
Given the health hazards connected to the aquatic ecosystem, it is crucial to identify the presence of heavy metals in food samples, especially fish.1 Heavy metals have entered and remained in aquatic environments as a result of human activity.2 These heavy metals can accumulate in the food chain as a result of fish and other aquatic organisms absorbing them from their surroundings.3 These organisms are rich in proteins, vitamins, essential amino acids, and other nutrients. With their many health benefits, these ingredients are important in supporting a balanced and healthful diet.4 The consumption of fish has been associated with a reduction in mortality rates linked to cardiovascular diseases, including coronary heart disease, myocardial infarction, and stroke risk, as well as a decreased risk of gastrointestinal and esophageal cancers Public health authorities recommend that individuals consume between 150 to 300 grams of fish daily,5 to help mitigate chronic diseases associated with dietary habits.6
The geographic and environmental conditions in Jordan lead to limited fisheries resources. Consequently, due to the growing dependence on both imported and domestic fish as a source of affordable protein,7 it is essential to evaluate the heavy metal contamination of fish available in the Jordanian market. When heavy metals are built up in fish species that provide essential vitamins for human diets, the poisoning threatens public health and disrupts marine biodiversity.8
Mercury is of serious concern, due to the fact that, it can easily be converted into methyl mercury, a hazardous organic compound, which accumulates the tissue of fish.9 Consumption of mercury contaminated fish can expose humans to methylmercury, which can cause serious pulmonary, neurological and developmental problems, particularly in young children.10 Chronic mercury exposure has been linked to symptoms like nausea, vomiting, abdominal pain, renal necrosis, emotional disturbance, and cognitive impairments.11
Three sources have been identified as contributors to the release of mercury into the environment;12 these include mining operations and the mixing of soil with mercury, which create mercury amalgam, which produces an impure gold upon burning,13 emissions from volcanoes, rocks, soils, and forest fires due to the evaporation, and the burning of fossil fuels, as well as municipal and medical waste.14 Although gaseous mercury is released into the atmosphere, the remaining mercury which is in gas state contaminates the surface of water and soil.15 Consequently, anaerobic bacteria present in the soil and water transform mercury into methylmercury.16
Cadmium is a hazardous metal, and has no function in the body.17 The industrial applications of cadmium, such as a corrosive agent and colour pigment are the main source for its release into the environment.18 Volcanic activities, rock erosion and fossil fuel combustion are the additional sources of cadmium pollution into the environment.19 Human accumulation of cadmium can result in bone demineralization, kidney dysfunction and elevated risk of cancer after prolonged exposure.20 As a result, the International Agency for Research on Cancer has designated it as carcinogenic.21
Lead exposure is known to have detrimental effects on the nervous system, especially in children, and it causes cognitive deficits and developmental delays.22 Lead is retained in the teeth and bones, and is then transferred to other organs in the body at a concentration greater than 1.4 µg/dL in children and 10 µg/dL in adults.23 An irreversible alterations to the function of the nervous system can be caused by exposure to lead, especially during neurodevelopment.24 Lead is found naturally in the environment, but human activities such as burning of fossil fuels, mining, burning of oil and incineration of garbage have increased exposure to lead.25
Researchers have utilized various digestion techniques, including acid digestion and digestion using microwave, for the assessment of heavy metals in samples, the digested sample have been analyzed with instruments such as by atomic absorption spectroscopy, inductively coupled plasma-mass spectrometry (ICP-MS) and inductively coupled plasma optical emission spectrometry (ICP‐OES),26,27 including voltametric techniques,28 which may be integrated with solid phase extraction.29
This research examines the levels of mercury, cadmium, and lead in samples of fishes available in randomly selected markets in Jordan, and to evaluate the potential health risks associated with the consumption of heavy metal contaminated fish.
Experimental Method
Collection of Fish Samples
Samples of fish were collected randomly from the markets in Amman, using the pattern of fish in Jordan.30 A representative of 48 different species were obtained, with a total of 768 samples of fish. The fish samples were rinsed with deionized water and subsequently placed into different containers, containing ice. These fish samples were then stored at -20°C and transported to the laboratory. However, potential sources of biased were not explicitly addressed.
Preparation of Standards
HNO3 and HCl were among the analytical-grade reagents used in the analysis (Sigma Aldrich, Germany). A Millipore Milli-Q academic deionizer system (Millipore, Bedford, MA, USA) was used to create ultrapure deionized water with a resistance of 18.2 MΩ cm. A 100 mg/L stock standard solution was purchased from Sigma Aldrich in Germany that contained only one element of each of the elements Hg, Cd, and Pb. The stock standard solutions had to be suitably diluted in order to prepare standard solutions of concentration ranging from 0.01 to 5 mg/L, every day.
Digestion of Fish Samples
Deionized water was used to thoroughly clean the collected fish samples. This study used a modified version of the microwave-assisted wet acid digestion method in compliance with AOAC guidelines.31 After washing, the samples were dried in an oven set to 85 °C for an hour,32,33 or until they were completely desiccated. The samples were then homogenized and grinded into a fine powder. A microwave vessel (Anton Paar) containing known amount of the powdered sample was filled with HNO3 and HCl (4:1). To aid in the digestion reactions, the vessel was left to sit for twenty-four hours.33 The vessel was securely sealed using a torque wrench and then exposed to the microwave program described in Table 1.
Analysis of Sample
The solution of the digested sample was allowed to cool to room temperature and subsequently filtered through Whatman filter paper. It was then quantitatively transferred into a 50 mL standard volumetric flask, where ultrapure deionized water was added to bring the solution up to the mark. All the samples were subjected to triplicate analysis. The heavy metal analysis was performed using an atomic absorption spectrometer (Analytic-Jena). The amount of the target element in the digested solution was determined using Equation 1.34

Table 1: The programme for the microwave digestion system
|
Parameter |
Value |
|
HNO3 |
4 cm3 |
| HCl |
2 cm3 |
|
Water |
2 cm3 |
| Pressure |
60 bar |
|
Sample weight |
0.4 g (1 cm3) |
| Final volume |
10 mL |
|
Power ramp |
900 W for 20 min, Fan 1 |
| Power hold |
900 W for 15 min, Fan 3 |
|
Microwave power |
1500 W |
| IR Temperature limit |
230 ℃ |
|
Internal temperature limit |
200 ℃ |
| Cooling |
55 ℃ Fan 3 |
Method Validation
A certified food reference materials (CFRM) of known concentration of the target metals was digested and analyzed to access the analytical method performance of the AAS. The assessment of the AAS methodologies was conducted with respect to accuracy (in term of average recovery, 70 – 120 %), precisions (determined as relative standard deviation (RSD), <20 %), limits of detection and quantitation, linear range, and coefficient of correlation. The average recoveries for the metal were computed utilizing Equation 2.
![]()
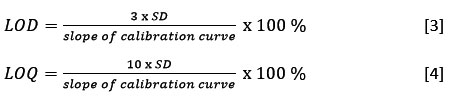
Three certified reference material (CRM) of the target element were analyzed every day and for three days (intra and inter -day RSD, respectively) inter-day RSD) in order to estimate the relative standard deviation (RSD%).35 By examining ten blank solutions of the metal, the LOD and LOQ were estimated using Equations 3 and 4.
Health Risk Assessment
Estimated daily intake (EDI)
The mean concentration of each metal found in the fish samples, along with the daily fish consumption measured in grams, were utilized to calculate the Estimated Daily Intake (EDI). The EDI was derived using Equation 5.36,37
![]()
Where C represents the concentration of heavy metals (mg/kg), FIR denotes the food ingestion rate (0.001 mg/kg), and BWa indicates the average body weight (70 kg).
Target hazard quotient (THQ)
The target hazard quoteient was calculated using Equation 6. The reference dosage signifies the maximum concnetration at which this is anticipated, it was estimated using Equation 6.38
![]()
where
C = average amount concentration (mg/kg),
EFR = is the frequency of exposure
ED = duration of exposure
FIR = ingestion rate of fish (0.0252 mg/kg/day)
RfD = oral reference dose, with RfD values for Pb, Hg, and Cd being 0.004, 0.004, and 0.001 mg/kg/day, respectively
BW = the reference body weight (70 kg), and
ATn = average exposure time (days/year x 60).38
The total hazard quotent score of less than 1, indicates that, the population may not to suffer any significant adverse effects; however, if the THQ exceeds 1, there is a potential risk of negative health impacts.39 These assessment methods have been demonstrated to provide insights into commodities that may pose health risks.40 For Hg, Cd, and Pb, the THQ values are 3.0 × 10⁻⁴ mg/kg/day, 1.0 × 10⁻³ mg/kg/day for Cd, and 4.0 × 10⁻³ mg/kg/day, respectively.
Statistical Analysis
SPSS software version 20 was used to analyze the data by calculating the standard deviation.
Results
Performance of analytical method
Table 2 presents the performance metrics of the microwave-assisted wet acid digestion process. The obtained average recovery was 96.78% Hg, 97.84% Cd, and 105.19% Pb with relative standard deviations of 3.41%, 2.86% and 2.99 for Hg, Cd, and Pb, respectively. The limits of detection were 0.46 µg/kg Hg, 0.24 µg/kg Cd, and 0.18 µg/kg Pb; and calculated LODs were 1.54 µg/kg, 0.80µg/kg, and 0.61 µg/kg, respectively. The linearity ranged from 0 .01 to 0.5 µg/kg for the three metals analyzed with R2 of 0.9999, 0.9972, and 0.9993 for Hg, Cd and Pb, respectively (Table 2).
Table 2: Method Performance
|
Metal |
LOD
(µg/kg) |
LOQ
(µg/kg) |
Ave. Rec. (%) | RSD (%) | R2 | Calibration Equatiom |
| Hg | 0.46 | 1.54 | 96.78 | 3.41 | 0..9999 |
y = 0.014x + 0.0977 |
|
Cd |
0.24 | 0.80 | 97.84 | 2.86 | 0.9972 | y = 0.0353x + 0.1804 |
| Pb | 0.18 | 0.61 | 105.19 | 2.99 | 0.9993 |
y = 0.0052x + 0.0173 |
N.B.: Ave. Rec. = average recovery
Analysis of Real Samples
Table 3 illustrates the variation in concentrations of Pb and Hg among the analyzed fish samples, emphasizing several factors that may influence the levels of heavy metals present in these samples. These factors encompass habitat, bioaccumulation that is specific to species, position in the trophic, water column position, and processing methods.3
The highest mean concentration of mercury was recorded in frozen tuna (Thunnus spp.) at 157.07 µg/kg, followed by barramundi (Lates calcarifer) at 62.5 µg/kg, and Ayer gutted fish at 46.25 µg/kg. Other predatory species showed elevated mercury levels, including kingfish at 39.04 µg/kg and barracuda at 27.92 µg/kg.
In contrast, lower mean mercury concentrations were observed in small non-predatory species. Chapil whole frozen exhibited the lowest mean mercury concentration of 0.06 µg/kg, followed by bata and sharp Vti with mean concentrations of 0.88 µg/kg, and 1.86 µg/kg, respectively. Processed fish products showed intermediate values, with frozen smoked mackerel containing 10.38 µg/kg and salmon containing 3.31 µg/kg of mercury. Nevertheless, the levels of Hg detected in the fish samples exceeded the EU permissible limit of 0.500 µg/kg,41 except in Chapil Whole Frozen, which has a mean concentration of 0.06 µg/kg.
The highest mean lead concentration was found in Merluccius pacifica (Pacific hake) at 27.08 µg/kg, followed by frozen tuna at 15.56 µg/kg, boal at 11.25 µg/kg, and frozen smoked mackerel at 10.04 µg/kg. Moderate levels of lead were detected in hilsa (6.13 µg/kg), emperor (4.38 µg/kg), and Ayer gutted (3.75 µg/kg). The lowest mean concentrations of lead were observed in basa fillets (1.51 µg/kg) and salmon (1.32 µg/kg). The overall mean lead concentration across all samples was 5.10 µg/kg, with relatively low variation among species.
Despite some observable differences, the levels of Pb detected in the fish samples were predominantly lower than those of Hg. Merluccius pacifica exhibited the highest mean concentration of Pb at 27.08 µg/kg. This suggests that the Pb levels in other fish samples, such as hilsa and emperor, which had Pb mean concentrations of 6.13 µg/kg and 4.38 µg/kg, respectively, differ markedly.
Table 3: Average concentration of heavy metals (µg/kg ±SD) and health risk assessment in the fish samples
|
Fish |
Amount (µg/kg ±SD) | Hg | Pb | ||||
| N | Hg | Pb | EDI | THQ | EDI |
THQ |
|
|
Ayer Gutted, Frozen |
2 | 46.25±0.00 | 16.25±0.00 | 0.0167 | 24.975 | 0.0059 | 0.8775 |
| Bata, Whole, Frozen | 2 | 0.87±0.01 | n.d | 0.0003 | 0.4752 | 0 |
0 |
|
Batashi, Whole, Frozen |
2 | 23.38±0.00 | n.d | 0.0084 | 12.6252 | 0 | 0 |
| Boal Gutted, Frozen | 2 | 12.5±0.00 | 22.5±0.00 | 0.0045 | 6.75 | 0.0081 |
1.215 |
|
Brushtooth lizardfish, Whole, Frozen |
2 | 5.00±0.00 | 1.13±0.00 | 0.0018 | 2.7 | 0.0004 | 0.061 |
| Chapil, Whole, Frozen | 2 | 0.06±0.01 | n,.d | 0 | 0.027 | 0 |
0 |
|
Deshi Moila, Whole, Frozen |
2 | 12.38±0.00 | n,d | 0.0045 | 6.6852 | 0 | 0 |
| Farsh, Whole, Frozen | 2 | 7.50±0.00 | n.d | 0.0027 | 4.05 | 0 |
0 |
|
Grouper E1, Frozen |
2 | 15.00±0.00 | n.d | 0.0054 | 8.1 | 0 | 0 |
| Katla Gutted, Frozen | 2 | 2.50±0.00 | 11.25±0.00 | 0.0009 | 1.35 | 0.0041 |
0.6075 |
|
Lates calcarifer (Barramundi), Whole, Frozen |
2 | 62.5±0.00 | n.d | 0.0225 | 33.75 | 0 | 0 |
| Macarona, Whole, Frozen | 2 | 12.50±0.00 | n.d | 0.0045 | 6.75 | 0 |
0 |
|
Mackerel fillet, Frozen smoked |
2 | 10.38±0.00 | n.d | 0.0037 | 5.6052 | 0 | 0 |
| Parot fish, Whole, Frozen | 2 | 3.49±0.00 | 0.68±0.16 | 0.0013 | 1.8846 | 0.0002 |
0.0367 |
|
Scomberoides commersonnianus (queen fish) |
2 | 6.43±2.31 | 2.38±0.00 | 0.0023 | 3.4722 | 0.0009 | 0.1285 |
| Sharp Vti Gutted, Frozen | 2 | 0.08±0.00 | 18.75±0.00 | 0 | 0.0432 | 0.0068 |
1.0125 |
|
Sheri Fish, Whole, Frozen |
2 | 7.5±0.00 | 12.50±0.00 | 0.0027 | 4.05 | 0.0045 | 0.675 |
| Shorputi fish, Whole, Frozen | 2 | 10.00±0.00 | 12.50±0.00 | 0.0036 | 5.4 | 0.0045 |
0.675 |
|
Barracuda, Headless, Frozen |
4 | 27.92±15.93 | nd | 0.0101 | 15.0768 | 0 | 0 |
| Feseekh fish, Fresh | 4 | 8.13±1.03 | 4.38±0.88 | 0.0029 | 4.3902 | 0.0016 |
0.2365 |
|
Keski (Corica sobrona), Whole, Frozen |
4 | 8.81±1.68 | n.d | 0.0032 | 4.7574 | 0 | 0 |
| Lake perch fish (Lates niloticus), Frozen | 4 | 18.13±7.95 | n.d | 0.0065 | 9.7902 | 0 |
0 |
|
Mackerel (Scomber scomrus) whole, Frozen |
4 | n.d | n.d | 0 | 0 | 0 | 0 |
| Red Snaper A, Frozen | 4 | 6.04±0.19 | n.d | 0.0022 | 3.2616 | 0 |
0 |
|
Tengra (Mystus vittatus), Whole, Frozen |
4 | 8.19±2.04 | n.d | 0.0029 | 4.4226 | 0 | 0 |
| Trevally, Whole, Frozen | 4 | 7.75±0.13 | 5.00±0.00 | 0.0028 | 4.185 | 0.0018 |
0.27 |
Table 3: Average concentration of heavy metals (µg/kg ±SD) and health risk assessment in the fish samples (cont’d)
|
Fish |
Amount (µg/kg ±SD) | Hg | Pb | ||||
| N | Hg | Pb | EDI | THQ | EDI |
THQ |
|
|
Mackerel fillet, Frozen smoked |
2 | 10.38±0.00 | n.d | 0.0037 | 5.6052 | 0 | 0 |
| Emperor, Whole, Frozen | 5 | 8.62±4.45 | 4.38±0.00 | 0.0031 | 4.6548 | 0.0016 |
0.2365 |
|
King Fish, Frozen |
5 | 39.04±13.50 | n,d | 0.0141 | 21.0816 | 0 | 0 |
| Merluccius capensis, Whole, Frozen | 6 | 5.58±1.88 | 5.75±0.63 | 0.002 | 3.0132 | 0.0021 |
0.3105 |
|
Hilsa fish, Whole, Frozen |
8 | 2.38±1.24 | 6.13±0.31 | 0.0009 | 1.2852 | 0.0022 | 0.331 |
| Merluccius pacifica Fish, headless, frozen | 10 | 14.91±4.10 | 27.08 | 0.0054 | 8.0514 | 0.00975 |
1.46232 |
|
Mullet Fish, Whole, Frozen |
10 | 4.48±2.18 | 4.38 | 0.0016 | 2.4192 | 0.0016 | 0.2365 |
| Scomber scombrus, Whole, Frozen | 11 | 7.10±2.46 | n,d | 0.0026 | 3.834 | 0 |
0 |
|
Catfish (Arius maculatus) fillet, Frozen |
13 | 1.11±0.95 | n,d | 0.0004 | 0.5994 | 0 | 0 |
| Sardine Whole, Frozen | 13 | 6.44±1.95 | 1.42±0.53 | 0.0023 | 3.4776 | 0.0005 |
0.0767 |
|
Hamour Fillet, Frozen |
16 | 4.54±2.86 | 9.82±0.89 | 0.0016 | 2.4516 | 0.0035 | 0.5303 |
| Ciupea harengula Herring, Whole, Frozen | 18 | 4.49±2.03 | 16.46±2.25 | 0.0016 | 2.4246 | 0.0059 |
0.8888 |
|
Tilapia, Whole, Frozen |
18 | 5.44±1.35 | 13.95±2.27 | 0.002 | 2.9376 | 0.005 | 0.7533 |
| Rohu Gutted, Frozen | 22 | 3.15±1.02 | 1.67±0.83 | 0.0011 | 1.701 | 0.0006 |
0.0902 |
|
Sea Bass, skin, Frozen |
23 | 7.73±4.24 | 1.46±0.38 | 0.0028 | 4.1742 | 0.0005 | 0.0788 |
| Tuna, Canned | 25 | 27.78±15.02 | n.d | 0.01 | 15.0012 | 0 |
0 |
|
Tuna, Frozen |
25 | 157.09±22.03 | 15.56±4.95 | 0.0565 | 84.8178 | 0.0056 | 0.8402 |
| Golden pompan, Whole, Frozen | 30 | 4.83±3.54 | 0.12±0.01 | 0.0017 | 2.6082 | 0.0004 |
0.0064 |
|
Salmon fillet, Frozen smoked |
39 | 3.31±1.48 | 1.33±0.15 | 0.0012 | 1.7874 | 0.00048 | 0.0713 |
| Hake Fish, Headless, Frozen | 65 | 6.52±3.86 | 12.16±2.59 | 0.0023 | 3.5208 | 0.0045 |
0.6566 |
|
Basa (pangasius) fish fillets- steak, Frozen |
84 | 4.69±5.32 | 1.52±0.27 | 0.0017 | 2.5326 | 0.0005 | 0.0815 |
| Merluccius hubbsi Fish, head and tail cut off, frozen | 94 | 12.13±9.54 | 12.40±4.38 | 0.0044 | 6.5502 | 0.0045 |
0.6696 |
N.B.: EDI, estimated daily intake; THQ, total hazard quotient,
The Health Risk Assessment
The use of estimated daily intake (EDI), which examines the daily intake of heavy metals from fish consumption and highlighted the considerable impact of species with elevated Hg abd Pb concentration, can be used to explain the detrimental impacts of consuming the fish.42 As shown in Table 3, Tuna frozen had the highest EDI and THQ with values of 0.0565 and 84.8178 respectively, suggesting a considerable risk. In decreasing other of THQ, other fish having noticeable high THQ levels for Hg include: Lates calcarifer (Barramundi): 33.7500, Ayer Gutted: 24.9750, King Fish: 21.0816, Barracuda: 15.0768. Fish samples with THQ less than 0.05, such as Mackerel (Scomber scomrus), Chapil, and Sharp Vti, has low or negligible levels of Hg. Merluccius pacifica, had the highest THQ for Pb (THQ = 1.46232), followed by Boal (1.2150) and Sharp Vti (1.0125). These values suggest possible health hazards because they are higher than the safety threshold of 1
Discussion
Performance of analytical method
The recovery rates achieved in this research show that the microwave-assisted wet acid digestion technique is reliable and accurate in the determination of heavy metals in fish tissues. The mean of 105.19 % recovery of lead, which is a little higher than 100 %, lies within the acceptable range of the trace metal analysis (usually 80-120 %) and suggests that there was no significant interference by the matrix or loss of the analyte during the sample preparation.
The lead and cadmium recovery rates are consistent with previously published values. The lead recovery of 105.19% corresponds closely with the 103% recovery reported by Ashoka et al.,43 while the cadmium recovery of 97.84% aligns with the 104% reported in the same study. Similarly, Rao et al.44 reported recoveries of 91% for Pb, 93% for Hg, and 97% for Cd, which compare favorably with findings of this study, particularly for cadmium (97.84% vs. 97%) and mercury (96.78% vs. 93%). The slightly higher lead recovery in this study may reflect differences in the digestion matrix or the specific fish species analyzed.
More recent work by Ahmad Al-Subeihi,45,46 reported a 102% recovery rate for mercury in fish samples and for lead in scalp hair of battery workers, further supporting the validity of our recovery data. The RSD values below 4% for all three metals, exceeds the performance criteria reported by Saber and associates,47 who documented average recoveries of 75-89% with RSDs below 15%. The higher accuracy of our study may be referred to the benefits of microwave-assisted digestion that offers a more consistent heating effect and more control of the digestion environment in contrast to the traditional approach of using a hot plate.
The detection limits obtained (0.18-0.46 µg/kg) are considerably less than the maximum allowable limits set by international regulatory authorities, which proves the method to be suitable in routine monitoring and in compliance testing. The linearity (R² > 0.997) over the calibration range is excellent and guarantee that all the concentration ranges experienced in real samples are accurately quantified.
Heavy metal accumulation in fish
The high range of heavy metal levels among the species of fish considered indicates the dynamic nature of the interactions between ecological, biological and anthropogenic aspects of bioaccumulation of metals in aquatic organisms.3
The high levels of mercury recorded in the predatory fishes, especially tuna (157.07 µg/kg), barramundi (62.5 µg/kg), and kingfish (39.04 µg/kg) are good evidence of the mercury biomagnification in aquatic food webs. This observation is consistent with the long-established fact that mercury, particularly methylated form has an unusual high trophic transfer efficiency that can be attributed to both high assimilation efficiency and low elimination rates in fish tissues.48
According to Brodziak-Dopierala and Fischer,49 270 µg/kg more or less of mercury in tuna and yellow fin tuna is quite high compared to the 157.07 µg/kg of mercury that is observed in this case. This difference could be because of geographic differentiation in the background mercury content, variability in fish size and age or alternatively a change in the mercury input in the environment over time. However, the two studies confirm that tuna as apex predators always accumulate mercury at levels that are far much higher than those of lower trophic level predators.
The low levels of mercury in chapil (0.06 µg/kg) and bata (0.88 µg/kg) are also in line with their ecological status of small, non-predatory fish whose entire diet is composed of planktons and detritus, leading to less biomagnification.49,50 The difference in concentration of mercury between tuna and chapil is almost 2,600 times which is a very dramatic demonstration of the extent to which mercury is biomagnified in aquatic systems.
The maximum lead level at Merluccius pacifica (27.08 µg/kg) aligns with other studies by Akinhanmi et al.51 that have documented high lead levels in Merluccius in coastal waters affected by the anthropogenic levels of lead. The correlation between high levels of lead in fish and closeness to industrial outflow, as reported by reference,52 is that the Merluccius pacifica in this research could be harvested in these zones receiving industrial effluents or in regions having high levels of sedimentary lead.
The lead levels in frozen tuna (15.56 µg/kg) are relatively high which could be attributed to the migratory nature of the tuna species that could lead to the transfer of contaminants gained in the polluted feeding grounds to other destinations. On the other hand, the low lead levels in basa fillets (1.51 µg/kg) and salmon (1.32 µg/kg) are in line with the controlled aquaculture conditions, where fishes are farmed in an environment that has a minimal level of industrial pollutions and fed on formulated diets with quality checks.53
The fact that no cadmium could be found in all samples is a reason to consider it. This observation agrees with Hasan et al.,54 who documented low levels of cadmium in fish in the Turag River in Bangladesh. This observation may be attributed to several factors. These factors can be: the local geochemical environment can be defined by low natural cadmium content, the major industrial processes in the source areas might not release cadmium, and cadmium bioavailability in aquatic systems, especially in the presence of organic matter or at particular pH conditions, can inhibit cadmium accumulation in fish tissues.55,56
Frozen smoked mackerel and salmon processes had lower levels of heavy metals than their fresh counterparts. Frozen smoked mackerel had 10.38 µg/kg mercury and 10.04 µg/kg lead, whereas the higher levels were found in fresh predatory species. This finding is consistent with the research indicating that freezing and smoking can decrease heavy metal levels in a variety of ways,57,58 such as leaching of metals during thawing and drip loss, volatilization of organometallic compounds in smoking, and dilution effects due to added ingredients or weight change during processing. Nevertheless, it cannot be ruled out that processed fish may have other sources or a different regime of aquaculture with less contamination at the baseline.
Mean concentrations of mercury and lead in the present study are also significantly lower than those reported by Ababneh and Al-Momani59 in canned tuna of Jordans supermarkets (mercury and lead mean concentrations of 21 µg/kg and 90 µg/kg respectively). This variation can be attributed to variations in tuna species, fisheries, canning or the level of contamination in the region. The much larger lead content of the Jordanian study (about six-times larger than ours) is especially interesting and could suggest a larger industrial lead contribution to the eastern Mediterranean area or other tuna processing behaviors.60
Health risk assessment
Tuna (Frozen), Boal, Sharp Vti, and Merluccius pacifica, all have elevated THQ values for both Hg and Pb, raising concerns about their combined health effects. Conversely, Pb typically exhibits lower THQ values, with many species remaining below the threshold of concern. This is in line with reports that the THQ of lead in tea was less than 1.47,61 However, species like Merluccius pacifica and Boal gutted fish may still pose a minor health risk because of their high Pb levels. Those who eat predatory fish such as frozen tuna, Ayer gutted fish, and Merluccius pacifica are particularly vulnerable due to elevated levels of mercury and lead.
The THQ observed in this study demonstrated both carcinogenic and non-carcinogenic health risks form consumption of fishes contaminated with heavy metals.62 The health risks associated with fish species like sea bass, hake, and amour are moderate, but the risks associated with bata and basa fillets are much lower due to their smaller size. Particularly for individuals who regularly eat these fish, these results highlight the significance of continuous monitory of fish for heavy metal content and the encouragement of dietary choices that reduce exposure.
Conclusion
The levels of heavy metals (Pb and Hg) in fish samples have been determined in this study. Predatory fish species had the highest mercury levels, which may indicate a bioaccumulation trend related to their place in the food chain. Additionally, it was found that non-predatory species had relatively lower heavy metal concentrations, which is consistent with their ecological roles. These results emphasize the need for continuous monitoring in regions with high levels of industrial activity. Fish that were processed showed lower levels of heavy metals, suggesting that the processing methods used, which occasionally involved removing organs that could bioaccumulate, heavy metals, have an impact on the levels of heavy metals in the fish samples. It can be concluded that techniques like smoking and freezing have an impact on the amounts of heavy metals in the fish samples, offering important information about the effects of handling and processing food. The levels of lead and mercury in the fish samples were determined to be within the EU’s allowable limits, notwithstanding the observed fluctuations. As a result, it is critical to evaluate the effects of consuming fish that regularly have low concentrations of heavy metals over an extended period of time.
It is recommended that the consumption of fish in the high-trophic level should be limited and consumers should prioritize the consumption of smaller, non-predatory fish. The pollution control efforts should also be strengthened by monitoring industrial effluent discharge and enforce stricter control on the treatment of industrial effluent. Longitudinal monitoring should be considered in future research to estimate seasonal and temporal fluctuations in the accumulation of heavy metals in fish samples
Acknowledgement
The authors are thankful to the Department of Pharmacy, College of Pharmacy, Amman Arab University, Amman, Jordan for providing the facilities and support to conduct this research
Funding Sources
The author(s) received no financial support for the research, authorship, and/or publication of this article.
Conflict of Interest
The authors do not have any conflict of interest.
Data Availability Statement
This statement does not apply to this article
Ethics Statement
This research did not involve human participants, animal subjects, or any material that requires ethical approval.
Informed Consent Statement
This study did not involve human participants, and therefore, informed consent was not required.
Clinical Trial Registration
This research does not involve any clinical trials.
Permission to Reproduce Material from Other Sources
Not Applicable
Author Contributions
- Ala Sirhan – Methodology, Investigation, Writing – Original Draft;
- Qais Jarrar – Conceptualization, Writing – Review and Editing;
- Rami Ayoub – Data Curation, Writing – Review and Editing;
- Zead Abudayeh – Writing – Review and Editing;
- Louai Alsaloumi – Writing – Review and Editing;
- Tariq Hantash – Formal Analysis;
- Ahmad Mostafa – Validation, Formal Analysis;
- Rania Ghanem – Formal Analysis;
- Loay Hassouneh – Writing – Review and Editing;
- Lukman Bola Abdulra’uf – Writing – Original and Final Draft.
References
- Jaishankar M, Tseten T, Anbalagan N, Mathew BB, Beeregowda KN. Toxicity, mechanism and health effects of some heavy metals. Interdiscip Toxicol. 2014;7(2):60-72. doi:10.2478/intox-2014-0009
CrossRef - Bashir I, Lone FA, Bhat RA, Mir SA, Dar ZA, Dar SA. Concerns and threats of contamination on aquatic ecosystems. In: Hakeem KR, Bhat RA, Qadri H, eds. Bioremediation and Biotechnology: Sustainable Approaches to Pollution Degradation. Springer; 2020:1-26.
CrossRef - Ray S, Vashishth R. From water to plate: reviewing the bioaccumulation of heavy metals in fish and unraveling human health risks in the food chain. Emerg Contam. 2024;10(4):100358. doi:10.1016/j.emcon.2024.100358
CrossRef - Noreen S, Hashmi B, Aja PM, Atoki AV. Health benefits of fish and fish by-products: a nutritional and functional perspective. Front Nutr. 2025;12:1564315. doi:10.3389/fnut.2025.1564315
CrossRef - Utri-Khodadady Z, Skolmowska D, Głąbska D. Determinants of fish intake and complying with fish consumption recommendations—a nationwide cross-sectional study among secondary school students in Poland. Nutrients. 2024;16(6):853.
CrossRef - Djedjibegovic J, Marjanovic A, Tahirovic D, et al. Heavy metals in commercial fish and seafood products and risk assessment in adult population in Bosnia and Herzegovina. Sci Rep. 2020;10(1):13238. doi:10.1038/s41598-020-70205-9
CrossRef - Food and Agriculture Organization. Fishery and aquaculture country profiles: Jordan, 2019. In: Fisheries and Aquaculture. Published 2025.
- Mustafa SA, Al-Rudainy AJ, Salman NM. Effect of environmental pollutants on fish health: an overview. Egypt J Aquat Res. 2024;50(2):225-233.
CrossRef - Al-Sulaiti MM, Soubra L, Al-Ghouti MA. The causes and effects of mercury and methylmercury contamination in the marine environment: a review. Curr Pollut Rep. 2022;8(3):249-272. doi:10.1007/s40726-022-00226-7
CrossRef - Petrova MV, Ourgaud M, Boavida JRH, et al. Human mercury exposure levels and fish consumption at the French Riviera. Chemosphere. 2020;258:127232. doi:10.1016/j.chemosphere.2020.127232
CrossRef - Wu YS, Osman AI, Hosny M, et al. The toxicity of mercury and its chemical compounds: molecular mechanisms and environmental and human health implications: a comprehensive review. ACS Omega. 2024;9(5):5100-5126. doi:10.1021/acsomega.3c07047
CrossRef - Alzahraa F. Mercury Pollution: Dangers and Treatment. Published 2023.
- Esdaile LJ, Chalker JM. The mercury problem in artisanal and small-scale gold mining. Chem Eur J. 2018;24(27):6905-6916. doi:10.1002/chem.201704840
CrossRef - Tao Z, Dai S, Chai X. Mercury emission to the atmosphere from municipal solid waste landfills: a brief review. Atmos Environ. 2017;170:303-311. doi:10.1016/j.atmosenv.2017.09.046
CrossRef - Steckling N, Tobollik M, Plass D, et al. Global burden of disease of mercury used in artisanal small-scale gold mining. Ann Glob Health. 2017;83(2):234-247. doi:10.1016/j.aogh.2016.12.005
CrossRef - Feng P, Xiang Y, Cao D, et al. Occurrence of methylmercury in aerobic environments: evidence of mercury bacterial methylation based on simulation experiments. J Hazard Mater. 2022;438:129560. doi:10.1016/j.jhazmat.2022.129560
CrossRef - Genchi G, Sinicropi MS, Lauria G, Carocci A, Catalano A. The effects of cadmium toxicity. Int J Environ Res Public Health. 2020;17(11):3782. doi:10.3390/ijerph17113782
CrossRef - Genchi G, Carocci A, Lauria G, Sinicropi MS, Catalano A. Nickel: human health and environmental toxicology. Int J Environ Res Public Health. 2020;17(3):679.
CrossRef - Casado M, Anawar HM, Garcia-Sanchez A, Santa Regina I. Cadmium and zinc in polluted mining soils and uptake by plants (El Losar mine, Spain). Int J Environ Pollut. 2008;33(2-3):146-159. doi:10.1504/IJEP.2008.019389
CrossRef - Charkiewicz AE, Omeljaniuk WJ, Nowak K, Garley M, Nikliński J. Cadmium toxicity and health effects—a brief summary. Molecules. 2023;28(18):6620.
CrossRef - Joseph P. Mechanisms of cadmium carcinogenesis. Toxicol Appl Pharmacol. 2009;238(3):272-279. doi:10.1016/j.taap.2009.01.011
CrossRef - Collin MS, Venkatraman SK, Vijayakumar N, et al. Bioaccumulation of lead (Pb) and its effects on human: a review. J Hazard Mater Adv. 2022;7:100094. doi:10.1016/j.hazadv.2022.100094
CrossRef - Generalova A, Davidova S, Satchanska G. The mechanisms of lead toxicity in living organisms. J Xenobiot. 2025;15(5). doi:10.3390/jox15050146
CrossRef - Ramírez Ortega D, González Esquivel DF, Blanco Ayala T, et al. Cognitive impairment induced by lead exposure during lifespan: mechanisms of lead neurotoxicity. Toxics. 2021;9(2):23. doi:10.3390/toxics9020023
CrossRef - Huang H, Guan H, Tian ZQ, et al. Exposure sources, intake pathways and accumulation of lead in human blood. Soil Secur. 2024;15:100150. doi:10.1016/j.soisec.2024.100150
CrossRef - Alam M, Rohani MF, Hossain MS. Heavy metals accumulation in some important fish species cultured in commercial fish farm of Natore, Bangladesh and possible health risk evaluation. Emerg Contam. 2023;9(4):100254. doi:10.1016/j.emcon.2023.100254
CrossRef - Billah MM, Khan A, Sikdar B, Alam MS, Acharjee UK, Hasan MF. Detection of heavy metals from Harpadon nehereus, Channa punctata and Pampus chinensis dried fishes and toxicity study of Channa punctata on embryonic zebrafish. J King Saud Univ Sci. 2023;35(10):102963. doi:10.1016/j.jksus.2023.102963
CrossRef - Han H, Pan D. Voltammetric methods for speciation analysis of trace metals in natural waters. TrAC Trends Environ Anal Chem. 2021;29:e00119. doi:10.1016/j.teac.2021.e00119
CrossRef - Inaudi P, Mondino E, Abollino O, et al. On-site determination of methylmercury by coupling solid-phase extraction and voltammetry. Molecules. 2022;27(10):3178. doi:10.3390/molecules27103178
CrossRef - Al Afaishat TM, Anlnaser AS, Albloush A, Al Shaer BY. Exploring factors affecting intention to consume fish in Jordan. Int J Membr Sci Technol. 2023;10(3):2881-2888.
CrossRef - Kwon SY, Kim YI, Kim YK, Lee YB, Mok JH. Microwave-assisted sample preparation for screening of heavy metal elements in food additives by ICP-MS. LWT. 2024;208:116708. doi:10.1016/j.lwt.2024.116708
CrossRef - Subhavana KL, Keerthana RT, Qureshi A. Mercury in marine, freshwater and aquaculture species from South India and human exposure risk assessment. Expo Health. 2020;12(4):897-903. doi:10.1007/s12403-020-00352-x
CrossRef - Mohammed E, Mohammed T, Mohammed A. Optimization of an acid digestion procedure for the determination of Hg, As, Sb, Pb and Cd in fish muscle tissue. MethodsX. 2017;4:513-523. doi:10.1016/j.mex.2017.11.006
CrossRef - Mehar S, Anam I, Masood Z, et al. Bioaccumulation of heavy metals in the different tissues of Decapterus macarellus collected from Karachi and Gwadar coasts of Pakistan. Saudi J Biol Sci. 2023;30(2):103540. doi:10.1016/j.sjbs.2022.103540
CrossRef - Ncube N, Tancu Y, Mketo N. A greener, rapid and accurate microwave-assisted hydrogen peroxide digestion method for ICP-OES determination of heavy metals in pet food samples. J Food Compos Anal. 2024;131:106201. doi:10.1016/j.jfca.2024.106201
CrossRef - Ayanniyi OA, Ayeni OH, Ibitoye OS, et al. Evaluating estimated daily intake versus acceptable daily intake of heavy metals in Farfantepenaeus notialis from Bodija Market, Ibadan: a comprehensive risk assessment. J Res For Wildl Environ. 2024;16(4).
- Saah SA, Boadi NO, Sakyi PO, Smith EQ. Human health risks of lead, cadmium, and other heavy metals in lipsticks. Heliyon. 2024;10(23):e40576. doi:10.1016/j.heliyon.2024.e40576
CrossRef - Ain SNU, Abbasi AM, Ajab H, Faridullah, Khan S, Yaqub A. Assessment of arsenic in Mangifera indica contaminated by artificial ripening agent: target hazard quotient, health risk index and estimated daily intake. Food Chem Adv. 2023;3:100468. doi:10.1016/j.focha.2023.100468
CrossRef - Shaheen N, Irfan NM, Khan IN, Islam S, Islam MS, Ahmed MK. Presence of heavy metals in fruits and vegetables: health risk implications in Bangladesh. Chemosphere. 2016;152:431-438.
CrossRef - European Food Safety Authority. Guidance of the scientific committee on a request from EFSA related to uncertainties in dietary exposure assessment. EFSA J. 2006;4(5):438.
CrossRef - European Commission. Commission regulation (EU) 2023/915. Off J Eur Union. 2023;119:103.
- Nyarko E, Boateng CM, Asamoah O, Edusei MO, Mahu E. Potential human health risks associated with ingestion of heavy metals through fish consumption in the Gulf of Guinea. Toxicol Rep. 2023;10:117-123. doi:10.1016/j.toxrep.2023.01.005
CrossRef - Ashoka S, Peake BM, Bremner G, Hageman KJ, Reid MR. Comparison of digestion methods for ICP-MS determination of trace elements in fish tissues. Anal Chim Acta. 2009;653:191-199. doi:10.1016/j.aca.2009.09.025
CrossRef - Rao EC, Capangpangan MB, Schuitz M. Modification and validation of a microwave-assisted digestion method for subsequent ICP-MS determination of selected heavy metals in sediment and fish samples in Agusan River, Philippines. J Environ Chem Ecotoxicol. 2010;2(9):141-151.
- Ahmad Al-Subeihi AA. Risk assessment of trace elements in selected imported frozen fish fillet in Jordanian market. Int J Environ Anal Chem. 2023;103(12):2749-2758. doi:10.1080/03067319.2021.1897797
CrossRef - Ahmad Al-Subeihi AA. Method validation of measuring endogenous lead levels in scalp hair of acid battery plant workers by flame atomic absorption spectroscopy. Int J Environ Anal Chem. 2022;102(19):7881-7888. doi:10.1080/03067319.2020.1839441
CrossRef - Saber A, Farag M, El-Sayed S, Shokr SA. Optimised determination of arsenic and lead in tea samples using microwave-assisted digestion and ICP-MS: method validation and health risk assessment. Int J Environ Anal Chem. Published online 2025. doi:10.1080/03067319.2025.2452952
CrossRef - Stamatis N, Kamidis N, Pigada P, Stergiou D, Kallianiotis A. Bioaccumulation levels and potential health risks of mercury, cadmium, and lead in albacore (Thunnus alalunga) from the Aegean Sea, Greece. Int J Environ Res Public Health. 2019;16(5):821. doi:10.3390/ijerph16050821
CrossRef - Brodziak-Dopierała B, Fischer A. Analysis of the mercury content in fish for human consumption in Poland. Toxics. 2023;11(8):717.
CrossRef - Pavla S, Danka H, Premysl M, Denisa M, Kristyna M, Zdenka S. Do the total mercury concentrations detected in fish from Czech ponds represent a risk for consumers? Sci Rep. 2022;12(1):553. doi:10.1038/s41598-021-04561-5
CrossRef - Akinhanmi TF, Akinwunmi F, Ajala OO, Usanga EE. Assessment of selected heavy metals and estimation of human health risk in some commonly consumed fish in Abeokuta, Ogun State, Nigeria. J Chem Soc Niger. 2021;46(2):358-365.
CrossRef - Awugo VE, Igejongbo TF. Determination of heavy metal concentration in African pike (Hepsetus odoe) from Alape River, Southwestern Nigeria. Mar Dev. 2024;2(1):18. doi:10.1007/s44312-024-00030-5
CrossRef - Dey S, Rajak P, Sen K. Bioaccumulation of metals and metalloids in seafood: a comprehensive overview of mobilization, interactive effects in eutrophic environments, and implications for public health risks. J Trace Elem Miner. 2024;8:100141. doi:10.1016/j.jtemin.2024.100141
CrossRef - Hasan GMMA, Das AK, Satter MA, Asif M. Distribution of Cr, Cd, Cu, Pb and Zn in organs of three selected local fish species of Turag River, Bangladesh and impact assessment on human health. Emerg Contam. 2023;9(1):100197. doi:10.1016/j.emcon.2022.11.002
CrossRef - Sanad H, Moussadek R, Mouhir L, Lhaj MO, Dakak H, Zouahri A. Geospatial analysis of trace metal pollution and ecological risks in river sediments from agrochemical sources in Morocco’s Sebou Basin. Sci Rep. 2025;15(1):16701. doi:10.1038/s41598-025-01199-5
CrossRef - Bouida L, Rafatullah M, Kerrouche A, et al. A review on cadmium and lead contamination: sources, fate, mechanism, health effects and remediation methods. Water. 2022;14(21):3432.
CrossRef - Arthur W, Asiamah E, Dowuona J, Crabbe G, Kortei NK. Concentration of heavy metals and its risk assessments on Pseudotolithus senegalensis, Sciaenops ocellatus and Chloroscombrus chrysurus smoked on different ovens. Sci Afr. 2021;13:e00953. doi:10.1016/j.sciaf.2021.e00953
CrossRef - Jamil Emon F, Rohani MF, Sumaiya N, et al. Bioaccumulation and bioremediation of heavy metals in fishes—a review. Toxics. 2023;11(6):510. doi:10.3390/toxics11060510
CrossRef - Ababneh FA, Al-Momani IF. Levels of mercury, cadmium, lead and other selected elements in canned tuna fish commercialised in Jordan. Int J Environ Anal Chem. 2013;93(7):755-766. doi:10.1080/03067319.2012.672981
CrossRef - Zahir A, Ge Z, Khan IA. Public health risks associated with food process contaminants—a review. J Food Prot. 2025;88(2):100426. doi:10.1016/j.jfp.2024.100426
CrossRef - Ahmed MM, Nur AAU, Sultana S, et al. Risk assessment and sources apportionment of toxic metals in two commonly consumed fishes from a subtropical estuarine wetland system. Biology (Basel). 2024;13(4):260.
CrossRef - Akinkpelumi VK, Ossai CM, Abdulai PM, et al. Human health risk assessment of metals and metalloid in food crops harvested from crude oil impacted community in Niger Delta, Nigeria. Sci Rep. 2025;16(1):231. doi:10.1038/s41598-025-29676-x
CrossRef
Abbreviations List
AAS – Atomic Absorption Spectroscopy
AOAC – Association of Official Analytical Chemists
ATn – Average Exposure Time
BW – Body Weight
BWa – Average Body Weight
C – Concentration of Heavy Metal
Cd – Cadmium
CFRM – Certified Food Reference Material
CRM – Certified Reference Material
EDI – Estimated Daily Intake
ED – Exposure Duration
EFR – Exposure Frequency
EU – European Union
FIR – Food Ingestion Rate
HCl – Hydrochloric Acid
Hg – Mercury
HNO₃ – Nitric Acid
ICP-MS – Inductively Coupled Plasma Mass Spectrometry
ICP-OES – Inductively Coupled Plasma Optical Emission Spectrometry
LOD – Limit of Detection
LOQ – Limit of Quantification
Pb – Lead
R² – Coefficient of Determination
RfD – Reference Dose
RSD – Relative Standard Deviation
SD – Standard Deviation
THQ – Target Hazard Quotient
Accepted on: 10 Mar 2026
Second Review by: Khritish Swargiary
Final Approval by: Dr. Nurul Huda


Web of Science Coverage
Emerging Sources Citation Index (ESCI)
2024 Journal Impact Factor: 1.1
Scopus Journal Metrics
CiteScore 2025: 2.6
CiteScore Details
Sustainable Nutrition: Food Systems, Nutrient Retention, and Public Health Impact
![]()
This journal is a member of, and subscribes to the principles of, the Committee on Publication Ethics (COPE)


