Nutrient Intake and Dietary Adequacy Relative to Recommended Dietary Allowances among Rural Populations in Northern India
 , Sunil Kumar Tailor1, Madhulika Gautam2, Manisha Rani1, Deepak Pandey3and Geeta Kumari Ray4
 1Department of Pediatrics, All India Institute of Medical Sciences, Bhopal, India
2Department of Home Science, Dayalbagh Educational Institute (Deemed University), Agra, India
3Department of Community and Family Medicine, All India Institute of Medical Sciences, Bhopal, India
4Department of Home Science, Shailabala Women’s Autonomous College, Cuttack, India
Corresponding Author Email: kumar.indresh@hotmail.com
DOI : http://dx.doi.org/10.12944/CRNFSJ.14.Special-Issue-June.13
Download this article as:
![]()
Malnutrition remains a persistent public health challenge in rural India, characterized not only by deficiencies in essential nutrients but also by excessive intake of select dietary components such as sodium and fats. While national surveys provide macro-level estimates, community-based analytical assessments of nutrient adequacy across demographic and occupational groups remain limited. To analytically evaluate macro- and micronutrient intake among rural households in Uttar Pradesh in relation to Indian Recommended Dietary Allowances (RDA), identify nutritionally vulnerable subgroups, and determine demographic and occupational predictors of dietary inadequacy. A community-based cross-sectional study was conducted among 491 individuals aged 13–59 years from rural households across eight villages in two agro-climatic zones of Uttar Pradesh. Dietary intake was assessed using a 24-hour dietary recall method. Nutrient intake was calculated using the Indian Food Composition Tables (IFCT 2017) and compared with ICMR–NIN RDA values. Nutrient Adequacy Ratio (NAR) and Mean Adequacy Ratio (MAR) were computed to assess diet quality. One-sample t-tests, ANOVA with post-hoc comparisons, and multivariable linear and logistic regression analyses were performed using R statistical software. Mean intake of calcium, vitamin A, potassium, riboflavin, and vitamin C was significantly below RDA levels (p < 0.001), whereas sodium, phosphorus, and magnesium intakes significantly exceeded recommended or tolerable upper intake levels (p < 0.001). The overall MAR was 0.78 ± 0.12, with 38.6% of participants exhibiting MAR < 0.75. Women (β = −0.051, p < 0.001), adolescents (β = −0.062, p < 0.001), and individuals engaged in heavy occupational work (β = −0.038, p < 0.001) had significantly lower MAR values. Adolescents had more than twice the odds of dietary inadequacy compared to adults (OR = 2.41; 95% CI: 1.62–3.58). Rural diets in northern India are characterized by significant micronutrient deficiencies coexisting with excessive sodium and mineral intake. Women, adolescents, and heavy workers represent high-risk groups for poor diet quality. These findings underscore the need for nutrition interventions that prioritize dietary diversity and micronutrient adequacy rather than calorie sufficiency alone.
KEYWORDS:Diet Quality; Dietary Intake; Micronutrient Deficiency; MAR; Nutrient Adequacy; RDA; Rural Nutrition
Introduction
Malnutrition continues to be a major global public health concern, particularly in low- and middle-income countries, where dietary inadequacy remains a critical determinant of morbidity, reduced productivity, and poor quality of life. Traditionally, malnutrition has been conceptualized primarily as undernutrition; however, contemporary evidence increasingly recognizes malnutrition as a dual burden, encompassing both nutrient deficiencies and excess intake of certain dietary components such as fats, sodium, and refined carbohydrates.1,2
In India, rapid demographic transitions, changing food environments, and persistent socioeconomic disparities have resulted in complex nutritional challenges, particularly in rural populations. Despite improvements in food availability and caloric access through national food security programs, diet quality remains suboptimal, with widespread deficiencies in micronutrients such as calcium, vitamin A, iron, zinc, and riboflavin.3-5 At the same time, excessive intake of sodium and imbalanced macronutrient consumption are emerging as risk factors for non-communicable diseases even in rural settings.6
Rural Diets and Nutritional Imbalance in India
Rural Indian diets are predominantly cereal-based, with limited consumption of fruits, vegetables, dairy products, and animal-source foods. This dietary pattern provides sufficient or near-sufficient energy for sedentary individuals but often fails to meet micronutrient requirements, particularly for calcium, vitamin A, and potassium.7 Pulses and cereals, while contributing to protein and mineral intake, also contain phytates that reduce mineral bioavailability, further exacerbating nutrient inadequacy.8
Although national surveys such as NFHS-5 (2019–21) provide macro-level nutrition indicators, they reveal a high prevalence of anaemia in India, with 57% of women aged 15–49 years, 59.1% of adolescent girls (15–19 years) and 67.1% of children aged 6–59 months being anaemic, indicating persistent micronutrient gaps at the population level. These macro-level results necessitate more detailed analysis of individual dietary intake and nutrient adequacy to identify specific dietary inadequacies and vulnerable sub-groups.9,10
Importance of Nutrient Adequacy Assessment
The Recommended Dietary Allowance (RDA), established in India by the Indian Council of Medical Research–National Institute of Nutrition (ICMR–NIN), represents the average daily intake sufficient to meet the nutrient requirements of nearly all healthy individuals within specific age and sex groups.11 Comparing actual dietary intake against RDA provides a meaningful benchmark for assessing nutritional adequacy and identifying priority nutrient gaps.
However, assessment of individual nutrients in isolation may underestimate overall diet quality. Composite indices such as the Nutrient Adequacy Ratio (NAR) and Mean Adequacy Ratio (MAR) are increasingly used in nutritional epidemiology to capture cumulative dietary adequacy and identify nutritionally vulnerable populations.12,13 Despite their utility, such indices are rarely applied in rural Indian dietary studies.
Gaps in Existing Literature
Most community-based nutrition studies in India remain descriptive, focusing on mean intake values or prevalence of deficiency without rigorous statistical comparison to RDAs or identification of predictors of inadequate intake. Additionally, occupational workload, a key determinant of energy and nutrient requirements in rural populations, has been inadequately explored in relation to dietary adequacy.
There is a critical need for analytical, hypothesis-driven studies that:
Quantitatively compare dietary intake with RDA benchmarks
Identify high-risk demographic and occupational groups
Use composite indicators of diet quality
Provide evidence to inform nutrition policy and program design
Study Objectives
In response to these gaps, the present study was designed to analytically assess nutrient consumption and dietary adequacy among rural populations in Uttar Pradesh, one of India’s most populous and nutritionally vulnerable states. By integrating inferential statistics and composite diet quality measures, this study aims to provide a more nuanced understanding of rural dietary patterns and their public health implications.
Hypothesis
We hypothesized that dietary inadequacy (lower MAR) would be more pronounced among women, adolescents, and individuals engaged in heavy occupational workload due to higher physiological requirements and sociocultural disparities in dietary access.
Materials and Methods
Study Design
A community-based analytical cross-sectional study was conducted to assess nutrient consumption and dietary adequacy in relation to the Indian RDA. The cross-sectional design was selected as it is appropriate for estimating population-level dietary intake, identifying nutrient gaps, and examining associations between demographic factors and dietary adequacy at a single point in time.14
The study was designed and reported in accordance with the STROBE (Strengthening the Reporting of Observational Studies in Epidemiology) guidelines for cross-sectional studies to ensure methodological transparency and reporting quality.15
Study Setting
The study was conducted in rural areas of Uttar Pradesh (UP), India, a state characterized by marked nutritional vulnerability, high population density, and pronounced rural–urban disparities in health and nutrition indicators. Two districts, Banda (Bundelkhand region) and Kannauj (central UP), were selected to represent distinct agro-climatic and dietary patterns, thereby enhancing the generalizability of findings within rural northern India.
Study Population
The study population comprised adolescents and adults aged 13–59 years residing in selected rural households. The following inclusion criteria were applied:
Inclusion Criteria
Individuals aged ≥13 years and <60 years
Permanent residents of the selected villages
Willing to participate and provide informed consent
Exclusion Criteria
Pregnant and lactating women (due to altered nutritional requirements)
Individuals with acute illness at the time of the survey
Individuals unable to recall dietary intake reliably
Women included in the study were exclusively non-pregnant and non-lactating (NPNL) to ensure uniformity in RDA comparison.
Sample Size and Sampling Strategy
Sampling Framework
A multi-stage random sampling technique was employed:
Stage 1: Two districts were randomly selected from different agro-climatic zones of Uttar Pradesh.
Stage 2: From each district, two sub-districts (blocks) were randomly selected.
Stage 3: From each selected sub-district, two villages were randomly chosen, resulting in a total of eight villages.
Stage 4: A household listing was conducted in each village, and households were selected using simple random sampling.
Sample Size
A formal a priori sample size calculation was not performed because this investigation was designed as a household-based community survey conducted in randomly selected rural villages, and all eligible individuals from the selected households were included. A total of 128 households were surveyed, yielding 491 eligible participants aged 13–59 years for analysis. The achieved sample size was considered adequate to: (i) estimate population-level mean nutrient intake using 24-hour dietary recall data, (ii) conduct subgroup comparisons across key strata (sex, age group, and occupational workload), and (iii) perform multivariable regression analyses to identify predictors of dietary adequacy (MAR) with acceptable statistical precision. The relatively large individual-level sample and balanced representation across demographic and workload categories provided sufficient power for inferential testing and strengthened the robustness of the analytical findings.
Classification of Participants
Participants were categorized based on age, sex, and occupational workload, consistent with ICMR–NIN dietary guidelines.
Age Groups
Adolescents: 13–15 years, 16–17 years
Adults: 18–59 years
Sex
Male
Female (NPNL)
Occupational Workload
Occupational workload was classified as:
Sedentary
Moderate
Heavy
This classification was based on self-reported daily activity patterns and aligned with RDA energy requirement categories defined by ICMR–NIN.11
Tools
To ensure standardization and reproducibility of dietary assessment, data collection was conducted using validated schedules and tools standardized by the National Nutrition Monitoring Bureau (NNMB), 2017. The following instruments were used:
Household Enumeration Schedule (NNMB, 2017)
Used for household listing and collection of basic household-level demographic and background information.
Household Schedule (NNMB, 2017)
Used to document household characteristics, member details, and relevant socio-demographic variables.
24-Hour Dietary Recall Schedule (NNMB, 2017)
Used to systematically record all foods and beverages consumed by each participant in the preceding 24 hours, including preparation methods and ingredients of mixed dishes.
Diet Measuring Cups (NNMB standardized set)
For accurate portion size estimation during the 24-hour dietary recall, a set of 12 standard measuring cups of different volumes, as recommended and used by NNMB for 24-hour dietary recall surveys. These cups were used to estimate portion sizes of cooked foods, cereals, pulses, and beverages in household measures.
Standard Kitchen Weighing Scale
A SECA brand digital kitchen weighing scale (SECA Culina 852) was used to improve precision in estimating food quantities. The scale measures a minimum of 1 gram up to a maximum of 3 kg, with approximately 0.3% accuracy, and was used to support accurate conversion of household measures into gram weights for nutrient computation.
Data Collection Procedures
Household and Enumeration Schedule
Household-level information was collected using standardized NNMB schedules, including the Household Enumeration Schedule and Household Schedule. These tools were used to systematically record household identification details and socio-demographic characteristics, including age, sex, family composition, and occupational status of participants. Household listing and enumeration were completed prior to dietary assessment to ensure accurate identification of eligible participants and to support structured data collection across the selected villages.
Dietary Intake Assessment
Dietary intake was assessed using a single 24-hour dietary recall method, which is widely accepted for community-based nutrition studies, particularly in rural and low-literacy settings16 Each participant was asked to recall all foods and beverages consumed during the preceding 24 hours, including portion sizes, cooking methods, and ingredients used in mixed dishes. To improve accuracy and reproducibility, standardized measuring cups, spoons, and food models were used to assist participants in estimating portion sizes. Interviews were conducted by trained investigators to reduce recall bias and ensure consistent probing for snacks, beverages, and commonly forgotten items. Importantly, the dietary recall was collected on a regular day when food was prepared as per usual household practice, and not during any special occasion, festival, or feast, to reflect typical routine intake patterns.17
Nutrient Computation
Food Composition Data
The nutrient content of foods was calculated using the Indian Food Composition Tables (IFCT), 2017, published by the National Institute of Nutrition, Hyderabad.18
A customized nutrient computation database was developed to convert household-level food intake into individual nutrient intake values.
Nutrients Assessed
The following nutrients were included based on public health relevance and data availability:
Macronutrients: Energy, carbohydrates, protein, fat
Macrominerals: Calcium, phosphorus, magnesium, sodium, potassium
Microminerals: Iron, zinc
Vitamins: Vitamin A (retinol equivalents), thiamine, riboflavin, niacin, folate, vitamin C
Assessment of Dietary Adequacy
Recommended Dietary Allowances
Nutrient intake was compared against ICMR–NIN RDA for age- and sex-specific groups.11
Nutrient Adequacy Ratio (NAR)
For each nutrient, the NAR was calculated as:
NAR values were capped at 1.0 to avoid overestimation of adequacy due to excessive intake.
Mean Adequacy Ratio (MAR)
The MAR was computed as the average of capped NARs for selected key nutrients, serving as a composite indicator of overall diet quality:
A MAR value < 0.75 was considered indicative of overall dietary inadequacy, consistent with previous nutritional epidemiology studies.12,13
Statistical Analysis (R-Style Reporting)
All statistical analyses were performed using R statistical software (version 4.3.0).
Descriptive Analysis
Continuous variables were summarized as mean ± standard deviation (SD).
Normality was assessed using the Shapiro–Wilk test.
Inferential Analysis
One-sample t-tests were used to compare mean nutrient intake with corresponding RDA values.
One-way ANOVA with Tukey post-hoc tests assessed differences across sex, age group, and occupational workload.
Multivariable linear regression models identified predictors of MAR.
Logistic regression models assessed factors associated with dietary inadequacy (MAR < 0.75).
Regression results are reported as β coefficients, odds ratios (OR), 95% confidence intervals (CI), and p-values.
A p-value < 0.05 was considered statistically significant.
Ethical Considerations
The study was conducted in accordance with the ethical principles of the Declaration of Helsinki. Ethical approval was obtained from the Human Ethics Committee, Dayalbagh Educational Institute (Deemed University), Agra, prior to initiation of data collection (Approval No.: DEI/HS/20181). Written informed consent was obtained from all adult participants after explaining the study objectives, procedures, potential benefits/risks, and the voluntary nature of participation. For participants aged 13–17 years, written informed consent was obtained from their parent/guardian, and written assent was obtained from the adolescent participants prior to inclusion in the study. Confidentiality and anonymity of all collected information were strictly maintained, and participants were assured of their right to withdraw from the study at any time without any consequences.
Results
A total of 491 individuals from 128 rural households were included in the final analysis. The study population comprised adult men, non-pregnant non-lactating adult women, and adolescents aged 13–17 years. Participants represented a range of occupational workloads, including sedentary, moderate, and heavy work categories. All dietary intake data were complete and eligible for nutrient computation and statistical analysis.
Socio-demographic and Occupational Characteristics
Table 1 describes the socio-demographic profile and occupational workload distribution of the 491 participants included in the study. The sample comprised a slightly higher proportion of females (52.5%) than males (47.5%). All women included were non-pregnant and non-lactating (NPNL), ensuring comparability with standard Recommended Dietary Allowances.
Table 1: Socio-demographic and Occupational Characteristics of the Study Population (n = 491).
|
Characteristic |
Category |
n (%) |
|
Sex |
Male | 233 (47.5) |
| Female (NPNL) |
258 (52.5) |
|
|
Age group (years) |
13–15 | 105 (21.4) |
|
16–17 |
67 (13.6) |
|
| 18–59 |
319 (65.0) |
|
|
Occupational workload |
Sedentary | 94 (19.1) |
| Moderate |
288 (58.7) |
|
|
Heavy |
109 (22.2) |
|
|
Households surveyed |
, | 128 |
| Villages covered | , |
8 |
Abbreviation: NPNL = Non-Pregnant, Non-Lactating
In terms of age distribution, the majority of participants were adults aged 18–59 years (65.0%), while adolescents constituted more than one-third of the study population. Specifically, 21.4% of participants were aged 13–15 years and 13.6% were aged 16–17 years, indicating substantial representation of adolescents, a nutritionally vulnerable group.
Occupational workload analysis revealed that most participants were engaged in moderate physical activity (58.7%), reflecting the predominance of agricultural and manual labor-related occupations in rural settings. Nearly one-fifth of the population (19.1%) reported sedentary work, while more than one-fifth (22.2%) were involved in heavy occupational workloads, highlighting considerable variability in physical activity demands within the study population.
The survey covered 128 households across 8 villages, providing a broad community-based representation and enhancing the generalizability of findings within rural agro-climatic settings of Uttar Pradesh.
Overall, the study population represents a demographically diverse rural cohort with balanced sex distribution, substantial adolescent participation, and heterogeneous occupational workload profiles, factors that are critical for interpreting variations in dietary intake and nutrient adequacy observed in subsequent analyses.
Energy Intake and Adequacy
The mean daily energy intake of the study population was 2223.6 ± 866.9 kcal, corresponding to 86% of the age- and sex-specific RDA. One-sample t-test analysis revealed that overall energy intake was significantly lower than the recommended intake for individuals engaged in moderate and heavy occupational workloads (p < 0.001), whereas sedentary adults consumed energy levels comparable to RDA values.
Table 2: Mean Daily Energy Intake and Adequacy by Sex, Age Group, and Occupational Workload.
|
Group |
n | Mean energy intake (kcal/day) | SD |
% of RDA |
|
Men |
||||
| Sedentary | 17 | 2277 | 974 |
98 |
|
Moderate |
90 | 2232 | 784 | 82 |
| Heavy | 26 | 2570 | 874 |
74 |
|
Women (NPNL) |
||||
|
Sedentary |
77 | 1920 | 898 |
101 |
| Moderate | 98 | 1956 | 986 |
88 |
|
Heavy |
11 | 2209 | 748 |
78 |
|
Boys |
||||
| 13–15 yrs | 46 | 2500 | 845 |
91 |
|
16–17 yrs |
26 | 2544 | 690 |
84 |
|
Girls |
||||
| 13–15 yrs | 59 | 1990 | 986 |
85 |
|
16–17 yrs |
41 | 2038 | 883 |
84 |
|
Overall |
491 | 2224 | 867 |
86 |
One-sample t-test vs RDA: p < 0.001 for heavy workers and adolescents.
When stratified by sex and workload, adult men engaged in heavy work demonstrated the greatest energy deficit, consuming only 74% of their recommended intake, while heavy-working women consumed 78% of RDA. In contrast, sedentary women exhibited near-adequate energy intake (101% of RDA). Adolescents also showed suboptimal energy intake, particularly those aged 16–17 years, whose mean intake remained significantly below recommended levels (p < 0.01).
One-way ANOVA confirmed a statistically significant difference in energy adequacy across occupational workload categories (F = 18.9, p < 0.001). Post-hoc analysis indicated that heavy workers had significantly lower energy adequacy compared to sedentary and moderately active individuals. These findings suggest a clear energy–workload mismatch, wherein increased physical demands were not accompanied by proportionately higher energy intake.
Macronutrient Intake: Carbohydrates, Protein, and Fat
Carbohydrates constituted the primary source of dietary energy across all demographic groups. The mean carbohydrate intake was 393 ± 112 g/day, corresponding to 95% of RDA. Sedentary adults of both sexes met or slightly exceeded recommended carbohydrate intake, while heavy workers consumed significantly lower proportions relative to their requirements (p < 0.05). Despite this, carbohydrate intake remained less variable across groups compared to other macronutrients, reflecting the cereal-dominant dietary pattern prevalent in rural households.
Table 3: Macronutrient Intake and Adequacy (Carbohydrate, Protein, Fat)
|
Nutrient |
Mean intake | SD |
RDA (%) |
|
Carbohydrate (g/day) |
393 | 112 | 95 |
| Protein (g/day) | 47.0 | 8.0 |
83 |
|
Fat (g/day) |
38.0 | 10.0 |
118 |
Protein inadequacy was significantly higher among women and adolescents (ANOVA, p < 0.001). Fat intake exceeded RDA in adults (p < 0.001).
Mean protein intake for the total population was 47.0 ± 8.0 g/day, representing 83% of the recommended intake. Protein adequacy differed significantly by sex and age (ANOVA, p < 0.001). Adult men had higher protein adequacy compared to women, while adolescents, particularly girls, exhibited lower intake relative to their requirements. Heavy-working women showed the lowest protein adequacy, consuming less than four-fifths of the recommended intake. Regression analysis indicated that female sex was independently associated with lower protein adequacy even after adjusting for age and workload.
In contrast, dietary fat intake exceeded recommended levels in most adult groups. The mean fat intake was 38.0 ± 10.0 g/day, corresponding to 118% of RDA. Sedentary women showed the highest relative fat intake, exceeding recommended levels by nearly 80%. Adolescents, particularly boys aged 13–15 years, consumed fat closer to recommended levels. One-sample t-tests confirmed that adult fat intake was significantly higher than RDA values (p < 0.001). This imbalance suggests a dietary pattern characterized by adequate or excessive fat consumption alongside inadequate intake of several essential micronutrients.
Intake of Macrominerals
Table 4: Macromineral Intake and Adequacy in the Study Population
|
Nutrient |
Mean intake | SD | % of RDA |
Direction |
|
Calcium (mg/day) |
293.1 | 326.4 | 41 | Deficient |
| Phosphorus (mg/day) | 1355.2 | 297.1 | 202 |
Excess |
|
Magnesium (mg/day) |
582.5 | 232.6 | 225 | Excess |
| Sodium (mg/day) | 4735.8 | 355.4 | 237 |
Excess |
|
Potassium (mg/day) |
2344.9 | 674.6 | 67 |
Deficient |
All comparisons with RDA were statistically significant (one-sample t-test, p < 0.001).
Calcium
Calcium intake was uniformly low across all population subgroups. The mean calcium intake was 293.1 ± 326.4 mg/day, corresponding to only 41% of RDA. One-sample t-test analysis demonstrated that calcium intake was significantly below recommended levels across all age, sex, and workload categories (p < 0.001). Women exhibited lower calcium adequacy compared to men, and adolescent girls had the lowest intake relative to requirements.
The widespread calcium deficiency observed in this study reflects limited consumption of milk, milk products, and other calcium-rich foods in rural diets. No subgroup achieved even half of the recommended calcium intake, highlighting calcium as one of the most critically deficient nutrients in the population.
Phosphorus and Magnesium
In contrast to calcium, phosphorus and magnesium intakes were markedly high. Mean phosphorus intake was 1355.2 ± 297.1 mg/day, corresponding to 202% of RDA, while magnesium intake averaged 582.5 ± 232.6 mg/day, equivalent to 225% of RDA. One-sample t-tests confirmed that intake of both minerals significantly exceeded recommended levels (p < 0.001).
High phosphorus and magnesium intake was observed consistently across all demographic groups, reflecting the heavy reliance on cereals, pulses, and legumes. While these foods contribute beneficial nutrients, excessive intake in the context of low calcium consumption may adversely affect mineral balance and bone health.
Sodium and Potassium
Mean sodium intake was 4735.8 ± 355.4 mg/day, amounting to 237% of the recommended intake and more than double the tolerable upper intake level. Sodium intake was excessively high across all groups, with adolescent girls aged 16–17 years showing the highest relative intake. One-sample t-test analysis confirmed statistically significant excess sodium consumption (p < 0.001).
Conversely, potassium intake was inadequate. Mean potassium intake was 2344.9 ± 674.6 mg/day, representing only 67% of RDA. Adolescent girls exhibited the lowest potassium adequacy, consuming barely over half of the recommended amount. The inverse pattern of high sodium and low potassium intake underscores an unfavorable electrolyte balance in the studied population.
Micromineral Intake
Table 5. Micromineral Intake and Adequacy (Iron and Zinc)
|
Nutrient |
Mean intake | SD |
% of RDA |
|
Iron (mg/day) |
17.9 | 7.9 | 81 |
| Zinc (mg/day) | 8.7 | 3.4 |
76 |
Women and adolescents had significantly lower iron and zinc adequacy (p < 0.01).
Iron and Zinc
Mean iron intake was 17.9 ± 7.9 mg/day, corresponding to 81% of RDA. Adult men engaged in moderate and heavy work achieved near-adequate iron intake, while women and adolescents, particularly girls aged 13–15 years, consumed significantly lower proportions of the recommended intake (p < 0.01). Although iron intake appeared closer to adequacy compared to other micronutrients, it remained insufficient for high-requirement groups.
Zinc intake averaged 8.7 ± 3.4 mg/day, equating to 76% of RDA. Zinc adequacy varied significantly by age and sex (p < 0.05), with adolescent boys aged 16–17 years showing the lowest intake. Logistic regression analysis indicated that adolescents had significantly higher odds of zinc inadequacy compared to adults.
Vitamin’s intake
Table 6. Vitamin Intake and Adequacy
|
Vitamin |
Mean intake | SD |
% of RDA |
|
Thiamine (mg/day) |
1.11 | 0.22 | 89 |
| Riboflavin (mg/day) | 0.93 | 0.24 |
64 |
|
Niacin (mg/day) |
12.71 | 3.93 | 82 |
| Folate (µg/day) | 168.8 | 25.7 |
89 |
|
Vitamin A (µg/day) |
193.9 | 327.9 | 32 |
| Vitamin C (mg/day) | 27.0 | 23.0 |
67 |
Vitamin A and riboflavin were the most deficient micronutrients.
Intake of B-Complex Vitamins
Intake of B-complex vitamins showed mixed adequacy patterns. Thiamine intake averaged 1.11 ± 0.22 mg/day, corresponding to 89% of RDA, with no major differences across demographic groups. Riboflavin intake, however, was substantially lower, with a mean intake of 0.93 ± 0.24 mg/day, corresponding to only 64% of RDA. Heavy-working men exhibited the lowest riboflavin adequacy.
Niacin intake was moderately adequate, averaging 82% of RDA, while folate intake reached 89% of RDA. Despite near-adequate mean values, subgroup analysis revealed persistent inadequacy among women and younger adolescents.
Vitamin A and Vitamin C Intake
Vitamin A intake was critically low across all groups. Mean intake was 193.9 ± 327.9 µg/day, representing only 32% of RDA. Sedentary women exhibited the lowest intake relative to requirements. One-sample t-test analysis confirmed severe deficiency across all demographic groups (p < 0.001).
Vitamin C intake averaged 27.0 ± 23.0 mg/day, corresponding to 67% of RDA. Intake did not differ significantly across age or sex categories, suggesting uniformly low consumption of fruits and vegetables.
Composite Diet Quality
The NAR reflects the proportion of the Recommended Dietary Allowance (RDA) met by the habitual diet. A NAR value of 1.0 indicates full adequacy, values below 1.0 indicate deficiency, and values above 1.0 indicate intake in excess of recommendations. In the present study, NAR values were capped at 1.0 for the calculation of MAR; however, uncapped values are presented here to highlight excessive intake.
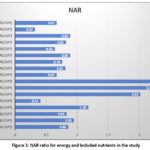 |
Figure 1: NAR ratio for energy and included nutrients in the study |
Nutrient Adequacy Ratios were calculated for selected nutrients and aggregated into the MAR. The overall MAR for the population was 0.78 ± 0.12. Approximately 38.6% of participants had MAR values below 0.75, indicating poor overall diet quality.
Table 7. NAR and MAR
|
Indicator |
Mean |
SD |
|
Mean NAR (selected nutrients) |
0.78 | 0.12 |
| Participants with MAR < 0.75 | 38.6% |
, |
Multivariable linear regression analysis demonstrated that female sex, adolescent age, and heavy occupational workload were independently associated with lower MAR values (p < 0.001).
Table 8. Multivariable Linear Regression Predicting Mean Adequacy Ratio (MAR)
|
Predictor |
β | SE | 95% CI |
p-value |
|
Female sex |
−0.051 | 0.009 | −0.068 to −0.034 | <0.001 |
| Adolescent age | −0.062 | 0.011 | −0.084 to −0.040 |
<0.001 |
|
Heavy workload |
−0.038 | 0.010 | −0.057 to −0.019 |
<0.001 |
Adjusted R² = 0.29; Model p < 0.001
Logistic regression further revealed that adolescents had 2.4 times higher odds of dietary inadequacy compared to adults, while women had nearly twofold higher odds compared to men.
Table 9: Logistic Regression Analysis for Dietary Inadequacy (MAR < 0.75)
|
Variable |
OR | 95% CI | p-value |
|
Female sex |
1.92 | 1.31–2.81 | <0.001 |
| Adolescents | 2.41 | 1.62–3.58 |
<0.001 |
|
Heavy workload |
1.63 | 1.07–2.49 |
0.02 |
Discussion
This analytical cross-sectional study provides a comprehensive assessment of nutrient consumption and dietary adequacy among rural populations in northern India and reveals a pattern of systemic dietary imbalance rather than simple caloric insufficiency. By applying inferential statistical methods and composite indicators of diet quality, the study advances beyond descriptive reporting and offers deeper insights into nutritional vulnerabilities across sex, age, and occupational workload categories.
The most salient finding of this study is the coexistence of critical micronutrient deficiencies alongside excessive intake of selected dietary components, particularly sodium and certain minerals. This dual burden reflects a transition in rural dietary patterns, wherein traditional cereal-based diets persist but are increasingly accompanied by high salt consumption and inadequate dietary diversity.19 Similar patterns have been reported in other low- and middle-income settings undergoing nutrition transition, where energy sufficiency masks underlying micronutrient inadequacy and emerging non-communicable disease risk.1,20
Energy Intake and Occupational Mismatch
Although the mean energy intake of the population approached recommended levels, significant inadequacies were observed among individuals engaged in heavy occupational work. The finding that heavy workers consumed substantially less energy relative to their physiological requirements highlights an energy–workload mismatch, a phenomenon frequently overlooked in rural nutrition assessments. This mismatch may contribute to chronic fatigue, reduced work productivity, and long-term health consequences, particularly among women who simultaneously shoulder domestic and agricultural labor.
The relatively adequate energy intake observed among sedentary adults, especially women, underscores the limitations of using average caloric intake as a proxy for nutritional adequacy. Energy sufficiency in the absence of micronutrient adequacy may create a misleading perception of nutritional well-being while masking hidden hunger.21
Energy intake showed moderate inadequacy with a NAR of 0.86, indicating that, on average, participants consumed only 86% of their recommended energy requirement. This deficit is particularly concerning for individuals engaged in moderate to heavy occupational workloads.
Macronutrient Imbalance and Diet Composition
Carbohydrates constituted the primary source of dietary energy across all demographic groups, reflecting heavy reliance on cereals such as wheat and rice. While carbohydrate intake was generally near recommended levels, this adequacy did not translate into balanced macronutrient intake. Protein consumption remained suboptimal for women, adolescents, and heavy workers, despite adequate or excessive carbohydrate intake. This imbalance suggests that dietary patterns prioritize quantity over quality, with insufficient inclusion of protein-rich foods such as pulses, dairy, and animal-source products.
Excessive fat intake among adults, particularly sedentary women, represents another dimension of imbalance. While fat is an essential macronutrient, intake exceeding recommended levels in the context of micronutrient deficiency may contribute to adiposity and cardiometabolic risk. These findings align with emerging evidence that rural populations are increasingly exposed to diets that are energy-dense but nutrient-poor.3,4
Carbohydrate intake was near-adequate (NAR = 0.95), reflecting the cereal-dominant dietary pattern typical of rural populations. While carbohydrates largely met energy needs, reliance on cereals alone did not translate into overall dietary balance.
Protein intake was suboptimal (NAR = 0.83), suggesting insufficient consumption of protein-rich foods such as pulses, dairy, and animal-source foods. This inadequacy is nutritionally significant given the increased protein needs of adolescents, women, and heavy workers.
Fat intake substantially exceeded recommended levels (NAR = 1.18), indicating a diet that is relatively energy-dense but not nutritionally balanced. Excess fat intake in the presence of micronutrient deficiencies points toward poor diet quality rather than simple caloric insufficiency.
Calcium Deficiency and Mineral Imbalance
Calcium emerged as one of the most critically deficient nutrients in the study population, with mean intake less than half of the recommended level across all subgroups. This widespread inadequacy is consistent with national evidence indicating low consumption of milk and milk products in rural India.5 The implications of chronic calcium deficiency extend beyond skeletal health, affecting neuromuscular function and long-term risk of osteoporosis, particularly among women.
In contrast, phosphorus and magnesium intakes were markedly excessive. While these minerals are essential, disproportionate intake relative to calcium may adversely affect mineral homeostasis. Diets high in cereals and pulses, which are rich in phosphorus and magnesium but also contain phytates, may further impair calcium absorption, exacerbating deficiency despite adequate mineral intake on paper.6
Calcium exhibited severe inadequacy, with a critically low NAR of 0.41, representing less than half of the recommended intake. This finding identifies calcium as one of the most deficient nutrients and highlights a major public health concern, particularly for bone health among women and adolescents.
In contrast, phosphorus (NAR = 2.02) and magnesium (NAR = 2.25) intakes were more than double the recommended levels. Such excessive intake, largely derived from cereals and pulses, may adversely affect mineral balance, especially in the context of very low calcium intake.
Sodium intake was excessively high (NAR = 2.37), more than twice the recommended level. This marked excess suggests habitual overuse of salt in cooking and food preparation and represents a significant risk factor for hypertension and cardiovascular disease.
Potassium intake was moderately inadequate (NAR = 0.67), indicating low consumption of fruits, vegetables, and other potassium-rich foods. The combination of high sodium and low potassium intake reflects an unfavorable electrolyte profile with important cardiometabolic implications.
Sodium Excess and Potassium Deficiency: An Unfavorable Electrolyte Profile
One of the most concerning findings of this study is the excessive sodium intake across all demographic groups, with mean intake more than double the recommended or tolerable upper intake levels. High sodium consumption has traditionally been associated with urban and processed food diets; however, the present findings suggest that rural diets are increasingly characterized by high salt use during cooking and food preservation.
Concurrently, potassium intake was substantially below recommended levels, reflecting low consumption of fruits, vegetables, and other potassium-rich foods. The combination of high sodium and low potassium intake represents an unfavorable electrolyte profile that may predispose rural populations to hypertension and cardiovascular disease, even in the absence of overt obesity. This pattern mirrors findings from recent national and regional studies indicating rising non-communicable disease risk in rural India.7,8
Reducing sodium intake in both adults and children significantly lowers blood pressure and helps prevent cardiovascular diseases. The World Health Organization (WHO) guideline recommends limiting daily sodium consumption to improve overall health and reduce the global burden of hypertension and related complications.19
Micromineral and Vitamin Deficiencies
Iron and zinc intakes, while closer to adequacy than other micronutrients, remained insufficient among women and adolescents. These findings are consistent with the high prevalence of anemia reported among women and adolescent girls in national surveys. It is important to note that iron intake alone does not guarantee adequacy, as bioavailability from plant-based sources is limited, particularly in diets high in phytates.9
Among vitamins, riboflavin, vitamin A, and vitamin C were markedly deficient. Vitamin A intake was particularly low, with mean intake reaching barely one-third of recommended levels. This severe deficiency reflects limited consumption of vitamin A–rich foods such as green leafy vegetables, fruits, and animal-source products. Vitamin C deficiency further indicates inadequate fruit and vegetable intake, which has implications not only for micronutrient status but also for immune function and chronic disease prevention.22
Iron intake was marginally inadequate (NAR = 0.81), suggesting that while average intake approached adequacy, it remains insufficient for high-requirement groups such as women and adolescents. Given the low bioavailability of plant-based iron, functional iron adequacy may be even lower than suggested by intake alone.
Zinc intake was borderline adequate (NAR = 0.76), falling just above the commonly used adequacy threshold of 0.75. This indicates a population at risk of zinc deficiency, particularly adolescents and individuals with monotonous cereal-based diets.
Thiamine (NAR = 0.89) and folate (NAR = 0.89) showed near-adequate intake, suggesting reasonable consumption of cereal-based and plant foods, though still below optimal levels.
Riboflavin intake was clearly inadequate (NAR = 0.64), reflecting limited intake of milk, dairy products, and animal-source foods. Riboflavin deficiency is a known marker of poor diet diversity in rural populations.
Niacin intake was moderately inadequate (NAR = 0.82), indicating partial but insufficient coverage of requirements.
Vitamin A intake was critically deficient, with a very low NAR of 0.32, representing only one-third of the recommended intake. This severe deficiency underscores minimal consumption of vitamin A–rich foods such as green leafy vegetables, fruits, and animal sources.23
Vitamin C intake was moderately inadequate (NAR = 0.67), further indicating low fruit and vegetable consumption and reinforcing the overall pattern of micronutrient-poor diets.
Composite Diet Quality and Vulnerable Groups
The use of the Mean Adequacy Ratio (MAR) as a composite indicator enabled a more holistic assessment of overall diet quality beyond individual nutrient gaps. In the present study, nearly two-fifths of participants had MAR values below 0.75, reflecting substantial dietary inadequacy at the community level. Multivariable regression further identified female sex, adolescent age, and heavy occupational workload as independent predictors of lower MAR, highlighting the combined influence of biological needs, social determinants, and work-related energy demands on dietary adequacy.
Importantly, these vulnerabilities must also be interpreted in the context of the regional agro-climatic setting of the study districts. Differences in agro-climatic conditions can shape cropping patterns, seasonal food availability, household food production, and market access, which in turn influence dietary diversity and micronutrient intake. In such settings, diets often remain cereal-dominant with limited and inconsistent access to fruits, vegetables, and animal-source foods, thereby contributing to persistently low MAR values across subgroups.
Adolescents, particularly girls, emerged as the most nutritionally vulnerable group, with more than twice the odds of dietary inadequacy compared to adults. This is of concern because inadequate nutrition during adolescence can impair growth, reduce future work capacity, and contribute to adverse intergenerational outcomes. The gender-based disparities observed in this study likely reflect intra-household food distribution practices, sociocultural norms, and unequal access to nutrient-rich foods, which may be further amplified in rural agro-climatic contexts where dietary options are constrained by seasonality and local food environments.
Comparison with Existing Literature
The findings of this study are broadly consistent with national and regional evidence documenting widespread micronutrient deficiencies in rural India. However, this study adds value by providing statistical comparisons with RDA benchmarks, identifying predictors of dietary inadequacy, and applying composite indicators of diet quality, which are rarely used in community-based Indian nutrition research. By integrating inferential statistics and regression modeling, the study strengthens the evidence base for targeted nutrition interventions. A study by the WHO (2003) showed that a balanced diet rich in fruits, vegetables, whole grains, and adequate nutrients plays a crucial role in preventing chronic diseases. Limiting saturated fats, sugar, and salt helps reduce the risk of obesity, cardiovascular disease, diabetes, and certain cancers. The report emphasizes population-based dietary and lifestyle modifications as key strategies for improving global health outcomes.24
Public Health and Policy Implications
The results have important implications for nutrition policy and programming. Current interventions often emphasize caloric sufficiency through cereal-based food security schemes, which may inadvertently perpetuate micronutrient deficiencies. The findings of this study suggest a need to shift focus toward dietary diversity and micronutrient adequacy, particularly for women, adolescents, and physically active individuals.
Nutrition education, promotion of locally available nutrient-rich foods, reduction of excessive salt use, and integration of diet quality indicators such as MAR into routine monitoring frameworks may enhance the effectiveness of existing programs. Addressing dietary imbalance at the household level is essential for breaking the cycle of hidden hunger and improving long-term health outcomes.
Strengths and Limitations
The strengths of this study include a relatively large community-based sample, comprehensive nutrient assessment using standardized food composition data, and application of robust analytical methods. The use of composite indicators and regression analysis enhances interpretability and policy relevance.
Nevertheless, certain limitations should be acknowledged. The cross-sectional design precludes causal inference, and dietary intake was assessed using a single 24-hour recall, which may not capture day-to-day variability. Seasonal variation in food availability was not assessed. Despite these limitations, the consistency of findings with national data supports the validity of the conclusions. Future research should consider repeated 24-hour recalls across multiple days and seasons to better capture usual dietary intake.
Conclusion
This analytical assessment of nutrient consumption among rural populations in northern India demonstrates that dietary inadequacy in this setting is not primarily due to insufficient energy intake but is driven by widespread micronutrient inadequacies occurring alongside excessive intake of sodium and selected minerals. The Nutrient Adequacy Ratio analysis identified particularly low adequacy for calcium, vitamin A, riboflavin, potassium, and vitamin C, despite near-adequate intake of energy and carbohydrates. The Mean Adequacy Ratio findings further indicate that a substantial proportion of individuals had poor overall diet quality, with significantly lower MAR values observed among women, adolescents, and individuals engaged in heavy occupational work. These patterns highlight clear demographic and workload-related disparities in dietary adequacy within rural households. Overall, the results demonstrate that assessment of diet quality using nutrient adequacy indicators provides insights beyond average energy intake and reveals important nutrient-specific gaps. The findings support the value of incorporating nutrient-level adequacy measures alongside conventional intake assessments to better characterize dietary imbalance in rural populations and to guide interpretation of nutritional vulnerability in similar settings.
Acknowledgement
The authors sincerely acknowledge all the study participants and household members for their time, cooperation, and willingness to share dietary information, without which this study would not have been possible. We also extend our gratitude to the field investigators and local community representatives for their assistance during data collection and coordination at the village level. The authors are thankful to the Department of Pediatrics, All India Institute of Medical Sciences (AIIMS), Bhopal, and the Department of Home Science, Dayalbagh Educational Institute, Agra, for providing academic guidance and institutional support throughout the conduct of this study.
Funding Sources
The author(s) received no financial support for the research, authorship, and/or publication of this article
Conflict of Interest
The authors do not have any conflicts of interest.
Data Availability Statement
The data supporting the findings of this study are available from the corresponding author upon reasonable request.
Ethics Statement
The study was conducted in accordance with the ethical principles outlined in the Declaration of Helsinki. Ethical approval was obtained from the Institutional Research Ethics Committee prior to the commencement of data collection. All participants were informed about the objectives and procedures of the study, and both verbal and written informed consent were obtained from each participant before their inclusion in the study.
Informed Consent Statement
Informed consent was obtained from all participants involved in the study.
Clinical Trial Registration
Not applicable.
Permission to Reproduce Material from Other Sources
Not applicable.
Author Contributions
- Indresh Kumar – Conceptualization, Methodology, Data Collection, and Writing – Original Draft.
- Sunil Kumar Tailor – Methodology and Data Collection
- Madhulika Gautam – Resources and Supervision.
- Manisha Rani – Analysis and Writing – Review and Editing.
- Deepak Pandey – Visualization, Supervision, and technical support.
- Geeta Roy – Writing – Review and Editing.
References
- Chen Y, Michalak M, Agellon LB. Importance of nutrients and nutrient metabolism on human health. Yale J Biol Med. 2018;91(2):95-103.
- Oz HS. Nutrients, infectious and inflammatory diseases. 2017;9(10):1085. doi:10.3390/nu9101085
CrossRef - Popkin BM, Corvalan C, Grummer-Strawn LM. Dynamics of the double burden of malnutrition and the changing nutrition reality. 2020;395(10217):65-74. doi:10.1016/S0140-6736(19)32497-3
CrossRef - Afshin A, Sur PJ, Fay KA, et al. Health effects of dietary risks in 195 countries, 1990-2017: a systematic analysis for the Global Burden of Disease Study 2017. 2019;393(10184):1958-1972. doi:10.1016/S0140-6736(19)30041-4
- Gonmei Z, Toteja GS. Micronutrient status of Indian population. Indian J Med Res. 2018;148(5):511-521. doi:10.4103/ijmr.IJMR_1768_18
CrossRef - Meshram II, Kumar BN, Venkaiah K, et al. Subclinical vitamin A deficiency and anemia among women and preschool children from Northeast India. Indian J Community Med. 2020;45(3):371-374. doi:10.4103/ijcm.IJCM_356_19
CrossRef - Bhattacherjee S, Datta S, Ray K. Nutrient adequacy and its correlation with dietary diversity in a sub-Himalayan region of West Bengal. J Family Med Prim Care. 2016;5(2):314-319. doi:10.4103/2249-4863.192315
CrossRef - Gibson RS, Bailey KB, Gibbs M, et al. A review of phytate, iron, zinc, and calcium concentrations in plant-based complementary foods used in low-income countries. Nutr Rev. 2010;68(8):456-469. doi:10.1111/j.1753-4887.2010.00304.x
CrossRef - Miller JL. Iron deficiency anemia: a common and curable disease. Cold Spring Harb Perspect Med. 2013;3(7):a011866. doi:10.1101/cshperspect.a011866
CrossRef - International Institute for Population Sciences (IIPS), ICF. National Family Health Survey (NFHS-5), 2019-21: India. Mumbai, India: IIPS; 2021.
- Indian Council of Medical Research, National Institute of Nutrition (ICMR–NIN). Nutrient Requirements for Indians: Recommended Dietary Allowances and Estimated Average Requirements. Hyderabad, India: ICMR–NIN; 2020.
- Hatloy A, Torheim LE, Oshaug A. Food variety—a good indicator of nutritional adequacy of the diet? A case study from an urban area in Mali, West Africa. Eur J Clin Nutr. 1998;52(12):891-898. doi:10.1038/sj.ejcn.1600662
CrossRef - Ruel MT. Operationalizing dietary diversity: a review of measurement issues and research priorities. J Nutr. 2003;133(11 Suppl 2):3911S-3926S. doi:10.1093/jn/133.11.3911S
CrossRef - Setia MS. Methodology series module 3: cross-sectional studies. Indian J Dermatol. 2016;61(3):261-264. doi:10.4103/0019-5154.182410
CrossRef - von Elm E, Altman DG, Egger M, et al. The Strengthening the Reporting of Observational Studies in Epidemiology (STROBE) statement: guidelines for reporting observational studies. PLoS Med. 2007;4(10):e296. doi:10.1371/journal.pmed.0040296
CrossRef - Gibson RS. Principles of Nutritional Assessment. 2nd ed. New York, NY: Oxford University Press; 2005.
- Willett W. Nutritional Epidemiology. 3rd ed. New York, NY: Oxford University Press; 2013.
CrossRef - Longvah T, Ananthan R, Bhaskarachary K, et al. Indian Food Composition Tables (IFCT 2017). Hyderabad, India: National Institute of Nutrition, Indian Council of Medical Research; 2017.
- World Health Organization. Guideline: Sodium Intake for Adults and Children. Geneva, Switzerland: World Health Organization; 2012.
- Gómez G, Nogueira Previdelli Á, Fisberg RM, et al. Dietary diversity and micronutrient adequacy in women of childbearing age. 2020;12(7):1994. doi:10.3390/nu12071994
CrossRef - French SA, Tangney CC, Crane MM, et al. Nutrition quality of food purchases varies by household income. BMC Public Health. 2019;19:231. doi:10.1186/s12889-019-6546-2
CrossRef - Mahmood L, Flores-Barrantes P, Moreno LA, et al. The influence of parental dietary behaviors and practices on children’s eating habits. 2021;13(4):1138. doi:10.3390/nu13041138
CrossRef - Popkin BM. Nutrition transition and the global diabetes epidemic. Curr Diab Rep. 2015;15(9):64. doi:10.1007/s11892-015-0631-4
CrossRef - World Health Organization. Diet, Nutrition and the Prevention of Chronic Diseases. WHO Technical Report Series 916. Geneva, Switzerland: World Health Organization; 2003.
Abbreviations list
NFHS- National Family Health Survey
NNMB-National Nutrition Monitoring Bureau
RDA-Recommended Dietary Allowance
ICMR-Indian Council of Medical Research
NIN-National Institute of Nutrition
NAR-Nutrient Adequacy Ratio
MAR-Mean Adequacy Ratio
STROBE-Strengthening the Reporting of Observational Studies in Epidemiology
NPNL-non-pregnant and non-lactating
IFCT-Indian Food Composition Tables
WHO-World Health Organization
Accepted on: 13 Feb 2026
Second Review by: Wong Yau Hsiung
Final Approval by: Dr. Jiwan Sidhu


Web of Science Coverage
Emerging Sources Citation Index (ESCI)
2024 Journal Impact Factor: 1.1
Scopus Journal Metrics
CiteScore 2025: 2.6
CiteScore Details
Sustainable Nutrition: Food Systems, Nutrient Retention, and Public Health Impact
![]()
This journal is a member of, and subscribes to the principles of, the Committee on Publication Ethics (COPE)


