Comparative Effects of Time-Restricted Eating, Calorie Restriction, and Their Combination on Glycemic Control: A Randomized Controlled Trial
 , Hayder Al-Domi and Aseel Jawamis
 Department of Nutrition and Food Technology, University of Jordan, Amman, Jordan
Corresponding Author Email: Najd.nutricenter@gmail.com
DOI : http://dx.doi.org/10.12944/CRNFSJ.14.1.27
Download this article as:
![]()
The present study was designed to evaluate and compare the effects of time-restricted eating alone, caloric restriction alone, and their combination on insulin resistance in obese adults with prediabetes living in Amman, Jordan. In a 12-week open-label randomized controlled trial, using a 2×2 factorial design was employed. A total of 120 obese adults aged 18–40 years with prediabetes were randomized into four groups: time-restricted eating, caloric restriction (reduction of 500 kilocalories), time-restricted eating with caloric restriction, or a control group. Blood samples were collected at baseline and week 12 following an overnight fast. Fasting blood glucose and insulin concentrations were measured using standardized laboratory methods, and insulin resistance was assessed using the homeostatic model assessment of insulin resistance (HOMA-IR). The dietary interventions significantly affected insulin resistance (p = 0.001), fasting insulin (p = 0.001), and fasting blood glucose (p = 0.004). Both caloric restrictions alone and the combined time-restricted eating with caloric restriction intervention significantly reduced homeostatic model assessment of insulin resistance compared with the control group (p = 0.021 and p < 0.001, respectively). The combined intervention achieved the most significant reduction in insulin resistance (−32.3%), followed by caloric restriction alone (−19.6%), whereas time-restricted eating alone did not differ significantly from the control. Overall, interventions involving caloric restriction, either alone or combined with time-restricted eating, were associated with significant improvements in insulin resistance and glycemic control over the 12-week study period in obese adults with prediabetes
KEYWORDS:Caloric restriction; HOMA-IR; Obesity; Prediabetes; Time-restricted eating
Introduction
The global rise in obesity and related metabolic disorders has led to increasing emphasis on identifying effective dietary interventions that can improve metabolic health and reduce the progression to type 2 diabetes.1 In Jordan, this trend is particularly pronounced, with obesity and prediabetes becoming increasingly prevalent, especially in urban centers such as Amman. Sedentary lifestyles, high caloric intake, and limited engagement in structured dietary programs have contributed to a growing burden of metabolic disease among adults.2 As a result, developing and evaluating practical, culturally acceptable, and sustainable nutritional strategies is essential for addressing this escalating public health concern.3
There are many dietary interventions used to improve health outcomes, each designed to address specific nutritional needs and metabolic conditions. These interventions include calorie-based strategies such as calorie restriction and very low-calorie diets, which aim to reduce overall energy intake.4 Another dietary approach is intermittent fasting, which focuses on alternating periods of eating and fasting rather than reducing total calorie intake.5 Also, other interventions modify macronutrient composition, such as low-carbohydrate, low-fat, high-protein diets.6
Intermittent fasting encompasses various dietary patterns that incorporate recurring periods of short-term energy restriction. One common approach, alternate-day fasting, involves alternating between fasting days with complete caloric restriction and feeding days during which food is consumed freely. Among the different intermittent fasting strategies, time-restricted eating (TRE) is the most widely practiced, characterized by limiting daily food intake to a specific time window (typically 6–10 hours) followed by fasting for the remaining hours of the day.7
Caloric restriction (CR) is one of the most thoroughly researched dietary interventions and typically involves reducing total daily calorie intake by about 20–40% without causing malnutrition.8 Unlike IF, which emphasizes meal timing, CR mainly aims to decrease overall caloric intake throughout the day. This reduction in energy intake has been shown to trigger a variety of physiological changes, including lower body weight and improved insulin sensitivity, with previous studies reporting reductions in HOMA-IR of approximately 15-35% following 8-16 weeks of CR. CR is also resulted in a significant decline in fasting blood glucose (5-15%) and circulating lipids.9 CR also activates several cellular pathways linked to longevity and metabolic health, such as reduced oxidative stress, improved mitochondrial function, and increased autophagy.10 Because of these broad effects, CR has been extensively studied as a treatment for obesity, metabolic syndrome, and prediabetes, serving as a key comparison to time-restricted eating in research on metabolic outcomes.11
Although TRE and CR have been studied separately across various populations, the evidence comparing their relative effectiveness remains limited, especially in Middle Eastern contexts. Cultural eating patterns, food availability, social meal timing, and lifestyle habits in Amman may influence how individuals respond to or adhere to these dietary approaches. Among obese adults with prediabetes, a population at elevated risk for progression to type 2 diabetes, understanding which strategy offers greater metabolic benefits and which is more feasible to implement has direct clinical relevance.
However, it remains unclear whether improvements in insulin resistance are primarily driven by meal timing, overall caloric restriction, or their combination in obese adults with prediabetes. Adherence has emerged as a critical determinant of dietary intervention effectiveness. While CR has well-documented metabolic benefits, maintaining compliance in real-world settings can be difficult due to hunger, reduced energy intake, and concerns about long-term sustainability. TRE, on the other hand, might be easier for some individuals because it limits the timing of eating rather than the amount of food. Nevertheless, evidence regarding the feasibility and metabolic impact of TRE in Middle Eastern populations remains limited. Given existing gaps in the literature, the present study aims to examine the effects of time-restricted eating alone, caloric restriction alone, and their combination on insulin resistance in obese adults with prediabetes living in Amman.
Materials and Methods
Study Design and Protocol
This open-label, 12-week randomized controlled trial employed a 2×2 factorial design with a 1:1 allocation ratio to examine the effects of four dietary interventions. Participants were enrolled between 5 and 10 April 2025, and all intervention and follow-up assessments were completed as planned by 5-9 July 2025, with no early stopping.
Participants were assigned to one of four intervention groups: (1) Time-restricted eating with caloric restriction (TRE+CR), consisting of a 10-hour daily eating window from 8:00 am to 6:00 pm (fasting from 6:00 pm to 8:00 am) combined with a daily caloric reduction of approximately 500 kilocalories; (2) Time-restricted eating alone (TRE) consuming a regular diet based on the Acceptable Macronutrient Distribution Ranges (AMDR) (45–65% carbohydrates, 20–35% fat, and 10–35% protein), following the same 10-hour eating window without intentional caloric restriction; (3) Caloric restriction alone (CR), defined as a daily reduction of approximately 500 kilocalories without time restriction; and (4) Control group, received a standardized normal diet designed to maintain body weight (isocaloric) and reflect usual dietary care, without caloric restriction or time-restricted eating. Specifically, the control group consumed a regular diet based on the AMDR and maintenance caloric intake to ensure nutritional adequacy.12 The control group was intended to represent standard dietary practice, without deprivation of any established medical treatment. Importantly, time-restricted eating and caloric restriction are dietary interventions that are not considered standard care for individuals with prediabetes
All participants, including controls, received dietary guidance based on AMDR to ensure nutritional adequacy. Notably, previous studies have demonstrated that adherence to a healthful, nutritionally adequate dietary pattern alone can improve insulin sensitivity and metabolic outcomes in individuals with insulin resistance, supporting the ethical appropriateness of the control group design.13,14 This approach was designed to ensure that the control group was not deprived of necessary care or interventions, while still allowing for comparisons between dietary interventions.
The trial included both male and female Jordanian adults aged 18–40 years diagnosed with obesity (BMI 30–39.9 kg/m²) and prediabetes. Participants attended a total of seven follow-up visits throughout the intervention period. Biochemical assessments were evaluated at the beginning of the study and at the end of the 12-week trial).
Several measures were implemented to minimize potential sources of bias. Random allocation was used to reduce selection bias, and standardized intervention protocols were applied across all study groups. All biochemical analyses were performed using standardized laboratory methods by personnel blinded to group allocation. Participants were instructed to maintain their usual lifestyle habits outside the assigned dietary interventions, and outcome assessments were conducted at predefined time points for all groups.
Sample Size
The sample size for this four-arm randomized controlled trial was calculated using standard methods for clinical trials.15 The calculation was based on detecting a medium effect size for the primary outcomes related to insulin sensitivity and cardiometabolic parameters. Estimates for the expected effect size were derived from a previous study comparing time-restricted eating with a control diet in obese individuals with insulin resistance, which reported differences in insulin sensitivity, blood pressure, and oxidative stress.16 Assuming a two-sided significance level of α = 0.05 (Zα/2 = 1.96), a statistical power of 80% (Zβ = 0.84), and a medium effect size (δ = 0.6).16 This resulted in an estimated sample size of approximately 30 participants per group. The total number of samples is 120 participants.
Participants
A total of 515 individuals were screened for eligibility; 340 did not meet the inclusion criteria, and 55 declined to participate. The remaining 120 eligible participants were randomly assigned in equal proportions to one of four study groups: time-restricted eating (TRE), time-restricted eating with caloric restriction (TRE+CR), caloric restriction alone (CR), or a control group.17
Inclusion criteria were: (1) male or female aged 18–40 years; (2) glycated hemoglobin (HbA1c) between 5.7% and 6.4%; (3) stable body weight for at least three months before enrollment; (4) body mass index (BMI) ≥30 and <40 kg/m²; and (5) sedentary lifestyle.18,19 Exclusion criteria included: (1) previous bariatric surgery; (2) pregnancy or lactation; (3) chronic diseases such as cardiovascular, renal, hepatic, respiratory, or neurodegenerative disorders, or cancer; (4) use of medications affecting metabolic status (e.g., corticosteroids or antidiabetic drugs); (5) diagnosis of type 1 or type 2 diabetes mellitus; and (6) engagement in regular moderate or vigorous physical activity.18–20 All eligible participants provided written informed consent and received an information sheet outlining the study procedures and objectives. Recruitment was conducted through social media platforms.
The dietary intervention incorporated traditional foods commonly consumed in Jordan, such as bread, rice, vegetables, fruits, legumes, olive oil, and lean meats, to ensure that participants could easily adopt and follow the plan. These foods are culturally familiar and widely available, making the diet both practical and acceptable. The intervention also took into account the importance of family meals, which are central to Jordanian culture, promoting shared eating practices to integrate the intervention into participants’ daily routines without disrupting family eating habits. The intervention’s 6 p.m. time-restricted eating cut-off was well-suited to the local eating pattern, where the main meal is typically consumed earlier in the evening. Additionally, the diet was designed with local food availability and economic feasibility in mind, ensuring that the recommended foods were affordable and accessible in local markets. Additionally, participants were community-dwelling adults residing in Amman, Jordan. In urban areas of Jordan, people from different occupations and income levels often share similar daily routines and eating habits, especially among young adults. For this reason, including a general urban population was considered appropriate to reflect real-world eating behaviors within the local cultural context. This approach reflects a cultural background adaptation, ensuring that the intervention is culturally relevant and feasible within the participants’ social and dietary context.
Randomization
Randomization was performed using a manual block randomization procedure. An independent researcher who was not involved in participant recruitment or outcome assessment prepared the randomization sequence in advance. Group assignments were organized into fixed-size blocks to ensure balanced allocation across the four study groups. Allocation assignments were placed in a container as identical, opaque, folded papers. Participants were assigned to groups by drawing a paper at random, ensuring allocation concealment until the moment of assignment. Baseline assessments were obtained immediately following randomization.
Adherence to the Dietary Interventions
All participants met with the nutritionist at baseline, followed by biweekly sessions to track changes in weight and body composition during the 12-week intervention period in a private nutrition center (Amman, Jordan). The nutritionist checked diet compliance and assessed it using the 3-day food records (“food log”). The adherence percentage to dietary interventions was calculated from the feeding logs using food processor software (ESHA Research, USA), based on calories, carbohydrates, protein, and fat in grams. This analysis was conducted three times during the study: after 4 weeks, after 8 weeks, and at the end of the study (12 weeks). Harms were defined as any adverse events or undesirable effects experienced by participants during the intervention period, including dizziness, fatigue, hypoglycemia-related symptoms, and gastrointestinal discomfort. Adverse events were assessed systematically at each scheduled follow-up visit through participant self-report and investigator inquiry, and non-systematically through spontaneous reporting by participants between visits. No serious adverse events were anticipated due to the non-pharmacological nature of the dietary interventions.21
Biochemical Analysis
A total of 6 ml of venous blood was collected from each participant by a registered nurse and a phlebotomist at a licensed private laboratory (Medical Scale Lab, Ibn Khaldoun Street, Amman) measured at baseline and after 12 weeks following an overnight fast. All samples were analyzed in the same laboratory.22
Fasting blood glucose levels were measured using an automated chemistry analyzer (Mindray BS-240, Mindray Bio-Medical Electronics Co., Shenzhen, China) with the glucose oxidase–peroxidase enzymatic colorimetric method, according to the manufacturer’s protocol. Serum insulin levels were determined by chemiluminescence immunoassay on a Mindray CL-series automated immunoassay analyzer in a commercial laboratory, following the manufacturer’s instructions. HOMA-IR was calculated using the HOMA method [(fasting glucose (mg/dL) * fasting insulin (mU/mL)) / 405].23
Fasting blood glucose, fasting insulin, and HOMA-IR were interpreted using established clinical reference values. Prediabetes was defined as glycated hemoglobin (HbA1c) levels between 5.7% and 6.4%.24 Standard clinical cut-offs were used for fasting blood glucose (<100 mg/dL normal; 100–125 mg/dL impaired fasting glucose) and fasting insulin (approximately 2–25 µIU/mL).25 Insulin resistance was assessed using HOMA-IR, with values > 1.8 indicating insulin resistance.26
Statistical Analysis
Categorical data are expressed as frequencies and percentages, while continuous variables are expressed as means ± standard deviation or medians, as appropriate. Within-group changes from baseline to week 12 were assessed using the Wilcoxon signed-rank test for non-normally distributed variables. Between-group comparisons were performed using analysis of covariance (ANCOVA) or multivariate analysis of covariance (MANCOVA), as appropriate, with baseline values included as covariates. This approach was used to account for baseline differences and to compare intervention effects across groups. To control for multiple comparisons, the Benjamini–Hochberg procedure was applied for analyses involving multiple outcomes, while the Bonferroni adjustment was used for post-hoc pairwise comparisons. A two-tailed p-value of less than 0.05 was considered indicative of statistical significance. Statistical analyses were performed using IBM SPSS Statistics.27
Results
Participants Flow
During the 12-week intervention period, 29 participants discontinued the study: 14 were lost to follow-up, and 15 withdrew due to non-adherence. A total of 91 participants completed the intervention and were included in the final analysis. Participant flow throughout the trial is presented in the CONSORT diagram (Figure 1). Analyses were conducted using data from participants who completed the study.
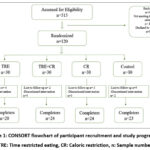 |
Figure 1: CONSORT flowchart of participant recruitment and study progression |
TRE: Time restricted eating, CR: Caloric restriction, n: Sample number
Baseline Characteristics
At baseline, there were no significant differences among the study groups in age (p = 0.811) or gender distribution (p = 0.179). Body weight showed a statistically significant difference (p = 0.028), with post hoc comparisons indicating higher weight in the TRE and CR groups compared with the control group. Skeletal muscle mass also differed significantly across groups (p = 0.027). No significant baseline differences were observed in body fat mass (p = 0.312), BMI (p = 0.248), triglycerides (p = 0.906), HDL (p = 0.742), VLDL (p = 0.961), total cholesterol (p = 0.096), HOMA-IR (p = 0.357), insulin (p = 0.762), or fasting blood sugar (p = 0.001), although FBS was lower in the CR group compared with the control group. Table 1. Shows the baseline characteristics for each intervention group.
Table 1: Baseline characteristics of the participants in each intervention group
|
Dependent Variable |
TRE +CR
M±SD n=30 |
TRE
M±SD n= 30 |
CR
M±SD n=30 |
CON
M±SD n=30 |
p-value | Post hoc test | 95%CI mean difference | |
| Upper | Lower | |||||||
| Age in years | 31.21±8.16 | 32.95±8.83 | 31.17±6.16 | 30.87±7.86 | 0.811 | — | — |
— |
|
Gender Females Males |
50.0% 50.0% |
45.0% 55.0% |
33.3% 66.7% |
65.2% 34.8% |
0.179 | — | — | — |
| Body
Weight (kg) |
100.5±14.87 | 110.1±17.91 | 108.71±21.35 | 95.38±18.96 | 0.028 | TRE-CON
P =0.011 |
3.47
2.63 |
25.88 24.02 |
|
CR-CT P= 0.015 |
||||||||
|
HOMA-IR |
5.39±1.44 | 5.60±2.53 | 6.09±3.23 | 4.87±1.72 | 0.357 | — | — | — |
| Insulin
µIU\ml |
22.6±7.24 | 22.7±9.89 | 21.80±8.58 | 20.36±7.27 | 0.762 | — | — |
— |
|
FBS mg\dl |
95.3±6.07 | 100.2±8.5 | 110.11±14.58 | 97.20±6.80 | 0.001 | CR-TRE
P= 0.006 |
2.00
7.28
5.29 |
17.81 22.34 20.51 |
|
CR-TRE + CR P <0.001 |
||||||||
|
CR-CON P <0.001 |
||||||||
Values are presented as mean ± standard deviation (M±SD). Between-group comparisons were analyzed using ANOVA
TRE = Time-restricted eating; CR = Calorie restriction; CON = Control; HOMA-IR = Homeostatic model assessment of insulin resistance; FBS = Fasting blood sugar; n= Sample number
Effect of three dietary interventions on Glycemia
Dietary Interventions significantly affected HOMA-IR (p = 0.001), fasting insulin (p = 0.001), and FBS (p = 0.004). Pairwise comparisons showed that HOMA-IR in TRE+CR and CR was significantly lower than in the control (p < 0.001, p = 0.021). However, TRE+CR vs TRE was not significant (p = 0.068), and TRE vs control was also nonsignificant (p = 0.286). For fasting insulin, only TRE+CR differed from control (p < 0.001); TRE+CR vs CR (p = 0.220), TRE vs control (p = 0.170), and CR vs control (p = 0.104) were not significant. For FBS, TRE+CR was significantly lower than TRE (p = 0.030) and control (p = 0.014). Although the TRE group showed a small within-group increase in FBS relative to baseline, adjusted between-group analyses demonstrated no statistically significant difference between the TRE and control groups (Table 5), indicating that the observed within-group change was not meaningful between groups. Differences for TRE vs control (p = 1.000) and CR vs control (p = 0.323) were not significant. Percentage changes confirmed significant dietary effects on HOMA-IR and FBS (p < 0.001), with TRE+CR showing greater reduction than TRE (p = 0.022) and control (p < 0.001). Fasting insulin % change did not differ among groups (p = 0.682). The effect of the three dietary interventions is presented in Tables 2-5. Figure 2 ANCOVA-adjusted effects of dietary interventions on HOMA-IR, fasting insulin, and fasting blood glucose at week 12. Bars in Figure 2 represent adjusted means ± standard error for (A) HOMA-IR, (B) fasting insulin, and (C) fasting blood glucose after 12 weeks of intervention in the TRE+CR, CR, TRE, and control groups.
Table 2: The impact of dietary interventions (TRE, TRE+CR, CR, and control) on HOMA-IR, fasting insulin, and fasting blood sugar.
|
Variable |
TRE + CR | CR | TRE | CON | p-value ⁶ | Partial η² ⁷ |
| HOMA-IR (week 12) ˡ | 3.60 ± 0.27 (2.8–4.4)ᵃ | 4.27 ± 0.29 (3.4–5.1)ᵃ | 4.66 ± 0.30 (3.7–5.6)ᵃ | 5.51 ± 0.29 (4.6–6.4)ᵇ | 0.001 |
0.231 |
|
HOMA-IR % change ² ³ ⁵ |
−32.32 ᵃ(↓) | −19.63 ᵃᵇ(↓) | −5.80 ᵇ(↓) | +3.49 ᶜ(↑) | <0.001 | 0.199 |
| Insulin (µIU/ml, week 12) ˡ | 15.20 ± 1.00 (13.1–17.3)ᵃ | 18.29 ± 1.05 (16.1–20.5)ᵃᵇ | 18.48 ± 1.11 (16.2–20.8)ᵃᵇ | 21.93 ± 1.07 (19.7–24.2)ᵇ | 0.001 |
0.211 |
|
Insulin % change ² ³ |
−14.04 ᵃ(↓) | −13.35 ᵃ(↓) | −8.74 ᵃ(↓) | +2.10 ᵇ(↑) | 0.682 | 0.018 |
| FBS (mg/dl, week 12) ˡ | 93.41 ± 1.63 (90.1–96.8)ᵃ | 95.51 ± 1.87 (91.9–99.2)ᵃᵇ | 100.29 ± 1.75 (96.8–103.8)ᵇ | 100.64 ± 1.70 (97.3–103.9)ᵇ | 0.004 |
0.151 |
|
FBS % change ² ³ |
−4.62 ᵃ(↓) | −8.59 ᵃ(↓) | +0.53 ᵇ(↑) | +1.71 ᵇ(↑) | <0.001 |
0.197 |
Table 3: Pairwise Comparisons of HOMA-IR Between Study Groups⁴
|
Comparison |
Mean Difference ± SE | p-value ⁶ | 95% CI |
| RE vs. TRE + CR | 1.061 ± 0.409 | 0.068 |
−0.047 to 2.169 |
|
TRE vs CR |
0.395 ± 0.415 | 1 | −0.728 to 1.519 |
| TRE vs. Control | 0.848 ± 0.422 | 0.286 |
−1.990 to 0.293 |
|
TRE + CR vs. CR |
−0.666 ± 0.396 | 0.58 | −1.737 to 0.406 |
| TRE + CR vs. Control |
−1.909 ± 0.397 |
< 0.001 |
−2.982 to −0.836 |
|
CR vs. Control |
−1.244 ± 0.412 | 0.021 |
−2.359 to −0.128 |
Table 4: Pairwise Comparisons of Fasting Insulin Between Study Groups⁴
|
Comparison |
Mean ± SE | p-value ⁶ | 95 % CI |
| TRE vs. TRE + CR | 3.281 ± 1.502 | 0.191 |
−0.784 to 7.346 |
|
TRE vs CR |
0.185 ± 1.519 | 1 | −3.924 to 4.294 |
| TRE vs. Control | −3.457 ± 1.548 | 0.17 |
−7.645 to 0.731 |
|
TRE + CR vs. CR |
−3.096 ± 1.457 | 0.22 | −7.038 to 0.847 |
| TRE + CR vs. Control | −6.738 ± 1.457 | < 0.001 |
−10.679 to −2.796 |
|
CR vs. Control |
−3.642 ± 1.499 | 0.104 |
−7.697 to 0.413 |
Table 5: Pairwise Comparisons of FBS Between Study Groups⁴
|
Comparison |
Mean ± SE | P value ⁶ | 95 % CI |
| TRE vs. TRE + CR | 6.878 ± 2.383 | 0.03 |
0.432 to 13.323 |
|
TRE vs CR |
4.781 ± 2.598 | 0.417 | −2.248 to 11.809 |
| TRE vs. CON | −0.350 ± 2.439 | 1 |
−6.949 to 6.248 |
|
TRE + CR vs. CR |
−2.097 ± 2.635 | 1 | −9.226 to 5.032 |
| TRE + CR vs. CON | −7.228 ± 2.291 | 0.014 |
−13.425 to −1.031 |
|
CR vs. CON |
−5.131 ± 2.621 | 0.323 |
−12.223 to 1.961 |
Values are presented as adjusted means ± standard error (SE). Adjusted means were obtained using analysis of covariance (ANCOVA), controlling for baseline values following 12 weeks of dietary treatment. Significant between-group differences are indicated by post hoc tests (Bonferroni). With covariates age, sex, and BMI
Percent change from baseline (mean ± SE) for each intervention group. Analyzed using multivariate analysis of covariance (MANCOVA) to examine between-group differences with covariates age, sex, and BMI. Percent change (%) was calculated using the following formula: ((Post-pre)/pre)* 100
Within-group pre–post changes (medians) were analyzed using the Wilcoxon signed-rank test, with directional arrows indicating the trend of change: ↓ decrease, ↑ increase, and — no change. Positive values indicate an increase, and negative values indicate a decrease relative to baseline. Within-group percentage changes describe changes relative to baseline within each intervention group and do not necessarily indicate statistically significant differences between groups. Between-group comparisons are presented separately based on adjusted models
Post hoc pairwise comparisons were performed using Bonferroni correction for multiple testing.
HOMA-IR was calculated as
Statistical significance was set at p < .05.
Effect size is expressed as partial η², where 0.01, 0.06, and 0.14 represent small, medium, and large effects, respectively.
Values sharing different superscript letters (a,b,c) differ significantly between groups (p < 0.05) based on Bonferroni-adjusted comparisons
All statistical analyses were performed using SPSS version 28. TRE = Time-restricted eating; CR = Calorie restriction; CON = Control; HOMA-IR = Homeostatic Model Assessment of Insulin Resistance; FBS = Fasting blood sugar.
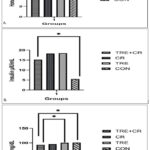 |
Figure 2: ANCOVA-adjusted effects of dietary interventions on HOMA-IR, fasting insulin, and fasting blood glucose at week 12. |
Bars represent adjusted means ± standard error (SE) for (A) HOMA-IR, (B) fasting insulin, and (C) fasting blood glucose after 12 weeks of intervention in the TRE+CR, CR, TRE, and control groups. Outcomes were analyzed using analysis of covariance with baseline values, age, gender, BMI included as covariates. * Indicates statistically significant between-group difference(p < 0.05)
TRE+CR TRE: time-restricted eating; CR: caloric restriction; FBS: fasting blood sugar
Discussion
Emerging evidence indicates that dietary interventions that target both energy intake and meal timing are crucial for influencing metabolic health, offering non-pharmacological strategies for preventing and managing metabolic disorders. To the best of our knowledge, this is the first randomized clinical trial to directly compare the effects of time-restricted eating (TRE), caloric restriction (CR), and their combination (TRE+CR) with control on HOMA-IR among pre-diabetic obese Jordanian adults aged 18–40 years. This 12-week intervention showed that both time-restricted eating combined with calorie restriction (TRE + CR) and calorie restriction alone improved insulin sensitivity, fasting insulin, and blood glucose levels compared with the control diet, yielding the most consistent benefits.
Insulin resistance is a multifactorial metabolic disorder influenced by energy balance, adiposity, hormonal regulation, inflammation, and circadian rhythm disruption. Experimental and clinical evidence indicate that misalignment between feeding patterns and endogenous circadian clocks can impair glucose metabolism and insulin signaling, providing a physiological framework within which dietary interventions such as caloric restriction and time-restricted eating may exert their effects. Accordingly, the findings of the present study are interpreted within this broader metabolic and circadian context.28–31
Effects of the Dietary Interventions on Glycemic Control
HOMA-IR was selected as the primary marker of insulin resistance because it detects short-term metabolic changes more sensitively than HbA1c in prediabetes. HbA1c reflects a 3-month average glycemia and changes minimally near normal baselines, whereas HOMA-IR responds rapidly to interventions targeting insulin sensitivity. A meta-analysis of 30 RCTs showed that fasting or energy-restricted diets significantly improved fasting glucose, insulin, and HOMA-IR while HbA1c remained unchanged, supporting its use as the primary outcome in this 12-week trial.32
This randomized clinical trial found significant effects of diet on HOMA-IR, fasting insulin, and FBS. Both CR and TRE+CR produced significant reductions in HOMA-IR and fasting insulin compared with control, indicating improved insulin sensitivity. Although the TRE+CR group had the lowest HOMA-IR, the difference from TRE alone was not significant (p = 0.068), and TRE+CR did not differ from CR (p = 0.58), suggesting caloric restriction was the dominant driver of improvement. Fasting glucose changes paralleled those of HOMA-IR and fasting insulin: both CR and TRE+CR significantly lowered FBS compared with control, while TRE alone showed smaller, inconsistent reductions. MANCOVA confirmed this gradient, with the most significant decrease in HOMA-IR in TRE+CR (−32.3%), followed by CR (−19.6%) and an increase in TRE (+7.5%).
The TRE-only group did not differ from the control group in HOMA-IR, fasting insulin, or FBS in the present study. This may reflect that the relatively moderate eating window (10 hours) may have limited the metabolic impact of the intervention, indicating a limited glycemic response to the 10-hour eating window. This suggests that the degree of time restriction used in this study may not have been sufficient to produce measurable improvements in insulin sensitivity within the study duration. Calorie compensation is further supported by our dietary findings, as total energy intake did not significantly change during the intervention. This indicates that participants likely consumed similar amounts of calories despite restricting their eating window. Taken together, the lack of change in both glycemic outcomes and energy intake in our data supports the interpretation that the TRE protocol applied in this study was insufficient to elicit significant metabolic benefits. Additionally, the limited response observed may be related to reduced metabolic flexibility in individuals with prediabetes, which could attenuate the short-term effects of meal-timing interventions.33,34
In addition, individuals with prediabetes may exhibit reduced metabolic flexibility, potentially limiting their responsiveness to meal-timing interventions over short durations.35 A randomized controlled trial showed that time-restricted eating without caloric reduction did not result in significant improvements in insulin sensitivity, fasting insulin, or glycemic outcomes compared with a control group when energy intake was matched, supporting the notion that meal timing alone may be insufficient to induce short-term metabolic benefits.36 The 12-week duration may also have been insufficient for full circadian and hormonal adaptations, and the reduced metabolic flexibility common in prediabetes may have further blunted responsiveness.37 Together, these factors likely explain the nonsignificant effects observed in the TRE-only arm.
In contrast, substantial evidence indicates that caloric restriction remains a primary driver of metabolic benefit. In a large randomized controlled trial, researchers reported that reducing dietary calories, regardless of macronutrient composition, led to significant improvements in insulin sensitivity and cardiometabolic risk factors in overweight and obese adults.38 These results reinforce the central role of sustained energy deficit in improving metabolic health and align with the significant reductions in insulin resistance observed in the CR and TRE+CR groups in the present study.
Direct comparisons between time-restricted eating and daily caloric restriction further highlight the limited independent contribution of meal timing. Also conducted an RCT that showed no clear advantage of time-restricted eating over continuous caloric restriction for mood and quality-of-life outcomes, suggesting that TRE does not consistently outperform traditional energy restriction even in non-metabolic domains.39 Similarly, a recent RCT comparing early TRE with energy restriction, late TRE with energy restriction, and energy restriction alone demonstrated that improvements in cardiometabolic markers were primarily driven by energy restriction, with only modest and context-dependent effects attributable to meal timing.35 Differences in intervention duration, magnitude of caloric deficit, and adherence likely explain the variability in observed TRE effects across studies.
These results align with evidence showing that caloric restriction is the primary driver of metabolic improvement. Several trials found that reducing energy intake improves insulin sensitivity, glucose metabolism, and cardiometabolic risk factors, with benefits occurring independently of meal timing and sufficient to induce diabetes remission when the energy deficit is significant and sustained40,41 In contrast, some studies have shown that combining TRE with caloric restriction can produce synergistic metabolic benefits, and differences in intervention duration, energy deficit, or participant characteristics may account for these inconsistent findings. The 12-week duration and possible caloric compensation in this trial may have limited the ability to detect such synergy.35,42
Mechanistically, the improvements observed in CR and TRE+CR are consistent with known fasting-related pathways. A sustained energy deficit reduces hepatic and visceral fat, lowers hepatic glucose output, and improves insulin sensitivity.43,44 Daily fasting further aligns feeding with circadian rhythms, reducing nocturnal gluconeogenesis and early-morning hyperglycemia.45 At the cellular level, fasting activates AMPK and inhibits mTOR, promoting autophagy, fat oxidation, and enhanced mitochondrial function.46 Which together support improved insulin action.
Physiologically, the modest glycemic improvements observed reflect enhanced metabolic flexibility from sustained caloric restriction, with TRE providing limited additional benefit. CR and TRE+CR may upregulate CPT1 and SIRT1, promoting fat oxidation and improving insulin sensitivity, and may affect gut hormones such as GLP-1 and PYY that regulate satiety and insulin secretion.42,47,48 However, these pathways are also activated by caloric restriction alone, consistent with the absence of clear superiority of TRE+CR over CR.
Conclusion
In conclusion, this 12-week randomized controlled trial in obese adults with prediabetes found that dietary interventions involving caloric restriction, either alone or combined with time-restricted eating, were associated with significant improvements in insulin resistance and glycemic markers compared with a control diet. In contrast, time-restricted eating alone did not result in statistically significant improvements over the study period. These findings suggest that, within this population and intervention duration, reductions in overall energy intake may play a more prominent role in short-term metabolic improvements than meal timing alone.
These findings suggest that, within this population and during this intervention duration, reductions in overall energy intake may play a more prominent role in short-term improvements in insulin sensitivity than meal timing alone. However, the results should be interpreted cautiously, and further studies with longer follow-up and diverse populations are needed to clarify the independent and long-term effects of time-restricted eating strategies
This study has several limitations that should be acknowledged. Reliance on self-reported food records to assess dietary adherence introduces potential recall and reporting biases. At the same time, unmeasured factors such as sleep and psychological stress may have influenced the results. Although the 2×2 factorial design was appropriate for addressing the study objectives, the randomization method based on identical folded papers placed in a container is outdated and may be prone to selection bias compared with contemporary computer-generated allocation procedures
Future research should evaluate longer intervention durations to determine whether extended exposure to time-restricted eating can produce independent, clinically meaningful improvements in insulin sensitivity. Studies examining different fasting window lengths and timing (e.g., early versus late TRE) may help clarify whether circadian alignment plays a more substantial role in metabolic regulation. Additionally, incorporating objective biomarkers of metabolic health, such as proinflammatory indices, lipid profile, physical activity, sleep, and psychological stress, would strengthen causal inferences. Future trials should also explore the long-term sustainability and adherence of combined dietary strategies and assess their effects across diverse populations and metabolic risk profiles.
Acknowledgement
The authors are thankful to the Department of Nutrition and Food Technology, The University of Jordan, for their support and for providing the necessary facilities and resources for this research. The authors used Artificial Intelligence (AI)- assisted tools (e.g., ChatGPT by OpenAI) to enhance the readability and clarity of the language in this manuscript. All intellectual content was developed and verified by the authors.
Funding Sources
The Deanship of Scientific Research at the University of Jordan funded this research (Funding number 2906).
Conflict of Interest
The authors do not have any conflicts of interest.
Data Availability Statement
The datasets generated and/or analyzed during the current study are available from the
corresponding author on reasonable request.
Ethics Statement
The study protocol was approved by the Institutional Review Board of the University of Jordan (Decision No. 382/2025; approval date: 3 March 2025) and registered at ClinicalTrials.gov (Identifier: NCT06911918).
Informed Consent Statement
Written informed consent was obtained from all participants before they participated in the study.
Clinical Trial Registration
The trial is registered at ClinicalTrials.gov (Identifier: NCT06911918).
Permission to Reproduce Material from Other Sources
Not Applicable.
Author Contributions
- Najd Al Sarayreh – Study concept and design, participant recruitment, data collection, research, analysis, Investigation, writing – original draft, writing review and editing, and Visualization.
- Hayder Al-Domi – Conceptualization, Supervision, writing, review, and editing.
- Aseel Jawamis – Conceptualization, writing, review, and editing.
References
- Brauer M, Roth GA, Aravkin AY, et al. Global burden and strength of evidence for 88 risk factors in 204 countries and 811 subnational locations, 1990–2021: a systematic analysis for the Global Burden of Disease Study 2021. The Lancet. 2024;403(10440):2162-2203. doi:10.1016/S0140-6736(24)00933-4
CrossRef - International Diabetes Federation. IDF Diabetes Atlas, 11th edn. International Diabetes Federation. Published online 2025. Accessed December 7, 2025. : https://diabetesatlas.org
- Rababah T, Al-U’datt M, Angor MM, et al. Impact of COVID-19 pandemic on obesity among adults in Jordan. Front Nutr. 2023;10. doi:10.3389/fnut.2023.1114076
CrossRef - Xie Y, Gu Y, Li Z, Zhang L, Hei Y. Comparing exercise modalities during caloric restriction: a systematic review and network meta-analysis on body composition. Front Nutr. 2025;12. doi:10.3389/fnut.2025.1579024
CrossRef - Semnani-Azad Z, Khan TA, Chiavaroli L, et al. Intermittent fasting strategies and their effects on body weight and other cardiometabolic risk factors: systematic review and network meta-analysis of randomised clinical trials. BMJ. 2025;389:e082007. doi:10.1136/bmj-2024-082007
CrossRef - Leung LYL, Tam HL, Ho JKM. Effects of ketogenic and low-carbohydrate diets on the body composition of adults with overweight or obesity: A systematic review and meta-analysis of randomised controlled trials. Clinical Nutrition. 2025;46:10-18. doi:10.1016/j.clnu.2025.01.017
CrossRef - Al Sarayreh N, H. AD, Jawamis A. Time-restricted eating and its metabolic benefits in obesity and insulin resistance. Clin Nutr ESPEN. 2025;69:703-710. doi:10.1016/j.clnesp.2025.08.033.
CrossRef - Abad-Jiménez Z, López-Domènech S, Pelechá M, et al. Calorie restriction modulates mitochondrial dynamics and autophagy in leukocytes of patients with obesity. Free Radic Biol Med. 2024;225:677-686. doi:10.1016/j.freeradbiomed.2024.10.295
CrossRef - Most J, Tosti V, Redman LM, Fontana L. Calorie restriction in humans: An update. Ageing Res Rev. 2017;39:36-45. doi:10.1016/j.arr.2016.08.005
CrossRef - Surugiu R, Iancu MA, Vintilescu Ștefănița B, et al. Molecular Mechanisms of Healthy Aging: The Role of Caloric Restriction, Intermittent Fasting, Mediterranean Diet, and Ketogenic Diet—A Scoping Review. Nutrients. 2024;16(17):2878. doi:10.3390/nu16172878
CrossRef - Chung KW, Chung HY. The Effects of Calorie Restriction on Autophagy: Role on Aging Intervention. Nutrients. 2019;11(12):2923. doi:10.3390/nu11122923
CrossRef - Chacón V, Cara KC, Chung M, Wallace TC. Defining “low-carb” in the scientific literature: A scoping review of clinical studies. Crit Rev Food Sci Nutr. 2025;65(10):1792-1801. doi:10.1080/10408398.2023.2300705
CrossRef - Sood S, Feehan J, Itsiopoulos C, et al. Higher Adherence to a Mediterranean Diet Is Associated with Improved Insulin Sensitivity and Selected Markers of Inflammation in Individuals Who Are Overweight and Obese without Diabetes. Nutrients. 2022;14(20):4437. doi:10.3390/nu14204437
CrossRef - Gong D, Lai WF. Dietary patterns and type 2 diabetes: A narrative review. Nutrition. 2025;140:112905. doi:10.1016/j.nut.2025.112905
CrossRef - Chow SC, Shao J, Wang H, Lokhnygina Y. Sample Size Calculations in Clinical Research: Third Edition. (Chow SC, Shao J, Wang H, Lokhnygina Y, eds.). Chapman and Hall/CRC; 2017. doi:10.1201/9781315183084
CrossRef - Sutton EF, Beyl R, Early KS, Cefalu WT, Ravussin E, Peterson CM. Early time restricted feeding improves insulin sensitivity, blood pressure, and oxidative stress even without weight loss in men with prediabetes. Cell Metab. 2018;27:1212-1221.
CrossRef - J, GH. M, CS R. Data Analysis: A Model Comparison Approach. 2nd ed. Routledge; 2009.
- Chow LS, Manoogian EN, Alvear A, et al. Time restricted eating effects on body composition and metabolic measures in humans who are overweight: A feasibility study. Obesity. 2020;28:860-869. doi:10.1002/oby.22756
CrossRef - Hutchison AT, Regmi P, Manoogian ENC, et al. Time‐Restricted Feeding Improves Glucose Tolerance in Men at Risk for Type 2 Diabetes: A Randomized Crossover Trial. Obesity. 2019;27(5):724-732. doi:10.1002/oby.22449
CrossRef - Wilkinson MJ, Manoogian ENC, Zadourian A, et al. Ten hour time restricted eating reduces weight, blood pressure, and atherogenic lipids in patients with metabolic syndrome. Cell Metab. 2020;31(1):92-104.
CrossRef - González-Salazar LE, Pichardo-Ontiveros E, Palacios-González B, et al. Effect of the intake of dietary protein on insulin resistance in subjects with obesity: A randomized controlled clinical trial. Eur J Nutr. 2021;60:2435-2447. doi:10.1007/s00394-020-02428-5
CrossRef - Marco-Benedí V, Pérez-Calahorra S, Bea AM, et al. High-protein energy-restricted diets induce greater improvement in glucose homeostasis but not in adipokines comparing to standard-protein diets in early-onset diabetic adults with overweight or obesity. Clinical Nutrition. 2020;39(5):1354-1363. doi:10.1016/j.clnu.2019.06.005
CrossRef - Parr EB, Devlin BL, Radford BE, Hawley JA. A Delayed Morning and Earlier Evening Time-Restricted Feeding Protocol for Improving Glycemic Control and Dietary Adherence in Men with Overweight/Obesity: A Randomized Controlled Trial. Nutrients. 2020;12(2):505. doi:10.3390/nu12020505
CrossRef - Jonas DE, Crotty K, Yun JDY, et al. Screening for prediabetes and type 2 diabetes: Updated evidence report and systematic review for the US Preventive Services Task Force. The Journal of the American Medical Association. 2021;326(8):744-760. doi:10.1001/jama.2021.10403
CrossRef - Munekawa C, Okada H, Hamaguchi M, et al. Fasting plasma glucose level in the range of 90–99 mg/dL and the risk of the onset of type 2 diabetes: Population‐based Panasonic cohort study 2. J Diabetes Investig. 2022;13(3):453-459. doi:10.1111/jdi.13692
CrossRef - Abdesselam A, Zidoum H, Zadjali F, et al. Estimate of the HOMA-IR Cut-off Value Identifying Subjects at Risk of Insulin Resistance Using a Machine Learning Approach. Sultan Qaboos Univ Med J. 2021;21(4):604-612. doi:10.18295/squmj.4.2021.030
CrossRef - Cienfuegos S, Gabel K, Kalam F, et al. Effects of 4 and 6 h time restricted feeding on weight and cardiometabolic health: A randomized controlled trial in adults with obesity. Cell Metab. 2020;378(DOI). doi:10.1016/j.cmet.2020.06.018
CrossRef - Lloyd M, Prakash BA, Zhao L, Ni G, Ru Y, Vasudevan SR. Circadian rhythms in metabolism and mental health: a reciprocal regulatory network with implications for metabolic and neuropsychiatric disorders. Curr Opin Physiol. 2025;45:100836. doi:10.1016/j.cophys.2025.100836
CrossRef - Dong Y, Lam SM, Li Y, Li MD, Shui G. The circadian clock at the intersection of metabolism and aging – emerging roles of metabolites. Journal of Genetics and Genomics. 2025;52(11):1325-1336. doi:10.1016/j.jgg.2025.04.014
CrossRef - Catalano F, De Vito F, Cassano V, Fiorentino TV, Sciacqua A, Hribal ML. Circadian Clock Desynchronization and Insulin Resistance. Int J Environ Res Public Health. 2022;20(1):29. doi:10.3390/ijerph20010029
CrossRef - Peters B, Vahlhaus J, Pivovarova-Ramich O. Meal timing and its role in obesity and associated diseases. Front Endocrinol (Lausanne). 2024;15. doi:10.3389/fendo.2024.1359772
CrossRef - Fatahi S, Nazary-Vannani A, Sohouli MH, et al. The effect of fasting and energy restricting diets on markers of glucose and insulin controls: a systematic review and meta-analysis of randomized controlled trials. Crit Rev Food Sci Nutr. 2021;61(20):3383-3394. doi:10.1080/10408398.2020.1798350
CrossRef - Templeman I, Gonzalez JT, Thompson D, Betts JA. The role of intermittent fasting and meal timing in weight management and metabolic health. Proceedings of the Nutrition Society. 2020;79(1):76-87. doi:10.1017/S0029665119000636
CrossRef - Lowe DA, Wu N, Rohdin-Bibby L, et al. Effects of Time-Restricted Eating on Weight Loss and Other Metabolic Parameters in Women and Men With Overweight and Obesity. JAMA Intern Med. 2020;180(11):1491. doi:10.1001/jamainternmed.2020.4153
CrossRef - Habe B, Črešnovar T, Petelin A, Kenig S, Mohorko N, Jenko Pražnikar Z. Comparing the influence of early and late time-restricted eating with energy restriction and energy restriction alone on cardiometabolic markers, metabolic hormones and appetite in adults with overweight/obesity: per-protocol analysis of a 3-month randomized clinical trial. Nutr Metab (Lond). 2025;22(1):85. doi:10.1186/s12986-025-00984-3
CrossRef - Lowe DA, Wu N, Rohdin Bibby L, et al. Effects of time restricted eating on weight loss and other metabolic parameters in women and men with overweight and obesity: The TREAT randomized clinical trial. The Journal of the American Medical Association. 2020;1;180(11):1491-1499. doi:10.1001/jamainternmed.2020.4153.
CrossRef - Kelley DE, Mandarino LJ. Fuel selection in human skeletal muscle in insulin resistance: A reexamination. Diabetes. 2000;49(5):677-683. doi:10.2337/diabetes.49.5.677
CrossRef - Sun J, Ruan Y, Xu N, et al. The effect of dietary carbohydrate and calorie restriction on weight and metabolic health in overweight/obese individuals: A multi-center randomized controlled trial. BioMed Central Medicine. 2023;21(1):192. doi:10.1186/s12916-023-02869-9
CrossRef - Liu D, Huang Y, Huang C, et al. Calorie Restriction with or without Time-Restricted Eating in Weight Loss. New England Journal of Medicine. 2022;386(16):1495-1504. doi:10.1056/NEJMoa2114833
CrossRef - Lin S, Cienfuegos S, Ezpeleta M, et al. Effect of Time-Restricted Eating versus Daily Calorie Restriction on Mood and Quality of Life in Adults with Obesity. Nutrients. 2023;15(20):4313. doi:10.3390/nu15204313
CrossRef - Sun J, Ruan Y, Xu N, et al. The effect of dietary carbohydrate and calorie restriction on weight and metabolic health in overweight/obese individuals: a multi-center randomized controlled trial. BMC Med. 2023;21(1):192. doi:10.1186/s12916-023-02869-9
CrossRef - Templeman I, Thompson D, Gonzalez J, et al. Intermittent fasting, energy balance and associated health outcomes in adults: study protocol for a randomised controlled trial. Trials. 2018;19(1):86. doi:10.1186/s13063-018-2451-8
CrossRef - Sadowska-Krępa E, Gdańska A, Přidalová M, Rozpara M, Grabara M. The effect of calorie restriction on the anthropometric parameters, HOMA-IR index, and lipid profile of female office workers with overweight and obesity: a preliminary study. Int J Occup Med Environ Health. 2022;35(6):693-706. doi:10.13075/ijomeh.1896.01963
CrossRef - Most J, Redman LM. Impact of calorie restriction on energy metabolism in humans. Exp Gerontol. 2020;133:110875. doi:10.1016/j.exger.2020.110875
CrossRef - Reytor-González C, Simancas-Racines D, Román-Galeano NM, et al. Chrononutrition and Energy Balance: How Meal Timing and Circadian Rhythms Shape Weight Regulation and Metabolic Health. Nutrients. 2025;17(13):2135. doi:10.3390/nu17132135
CrossRef - Lv Y, Hao J, Liu C, et al. Anti-diabetic effects of a phenolic-rich extract from Hypericum attenuatum Choisy in KK-Ay mice mediated through AMPK /PI3K/Akt/GSK3β signaling and GLUT4, PPARγ, and PPARα expression. J Funct Foods. 2019;61:103506. doi:10.1016/j.jff.2019.103506
CrossRef - Habe B, Črešnovar T, Petelin A, et al. Comparing the influence of early and late time restricted eating with energy restriction and energy restriction alone on cardiometabolic markers, metabolic hormones, and appetite in adults with overweight/obesity: Per protocol analysis of a 3 month randomized clinical trial. Nutr Metab (Lond). 2025;22:85. doi:10.1186/s12986-025-00984-3
CrossRef - Templeman I, Thompson D, Gonzalez J, et al. Intermittent fasting, energy balance and associated health outcomes in adults: Study protocol for a randomized controlled trial. Trials. 2018;19:86. doi:10.1186/s13063-018-2451-8
CrossRef
Abbreviations List
AMDR – Acceptable Macronutrient Distribution Ranges
BMI – Body mass index
CON – Control
CR – Caloric restriction
FBS – Fasting blood sugar
HbA1c – Glycated hemoglobin (Hemoglobin A1c)
HOMA-IR – Homeostatic model assessment of insulin resistance
IF – Intermittent fasting
T2DM – Type 2 diabetes mellitus
TRE – Time-restricted eating
Accepted on: 13 Feb 2026
Second Review by: Bhimana Sasidhar
Final Approval by: Dr. Jiangfeng Song


Web of Science Coverage
Emerging Sources Citation Index (ESCI)
2024 Journal Impact Factor: 1.1
Scopus Journal Metrics
CiteScore 2025: 2.6
CiteScore Details
Sustainable Nutrition: Food Systems, Nutrient Retention, and Public Health Impact
![]()
This journal is a member of, and subscribes to the principles of, the Committee on Publication Ethics (COPE)


