A Study on the Status of Nutrition Management and Life Satisfaction among Elderly Living Alone in Korea.
Department of Food and Nutrition, Seowon University. Cheongju City, South Korea
Corresponding Author E-mail: joody88@hanmail.net
DOI : http://dx.doi.org/10.12944/CRNFSJ.13.2.23
Download this article as:
![]()
This study analyzed the nutritional management status of elderly individuals living alone in the Korean community, utilizing data from “the 2020 Elderly Survey” conducted by the Ministry of Health and Welfare. It also examined the relationship between nutritional management and life satisfaction. The findings revealed that common nutritional management issues among the elderly living alone included factors such as eating alone almost every time and rarely consuming fruits, vegetables, or dairy products (e.g., milk). Among the 3,137 elderly individuals surveyed, 59.7% were classified as having 'Good' nutritional status, 25.6% as 'Moderate Risk,' and 14.8% as 'High Risk' according to the Nutrition Screening Initiative (NSI). Significant differences were observed in health status, relationships with their children, economic status, socio-cultural leisure activities, relationships with friends and local communities, and overall life satisfaction based on the nutritional management status of elderly individuals living alone (P < 0.001). Those with good nutritional management demonstrated 1.277 times greater overall life satisfaction compared to those with poor nutrition (P < 0.001). Furthermore, individuals who self-reported as healthy exhibited 2.191 times higher life satisfaction than those who did not (P < 0.001). These findings indicate the need to enhance nutritional management, particularly addressing the issues of eating alone and insufficient intake of foods such as vegetables, fruits, and dairy products. Additionally, there is a need to expand institutional support to facilitate various activities that promote healthy eating habits and social interaction, enabling them to lead a more fulfilling life in their later years.
KEYWORDS:Elderly; Life satisfaction; Living alone; Nutrition; Social support
Introduction
As the human body ages, various changes occur that affect nutritional status, including a decrease in meal intake and absorption. In elderly individuals, these changes are often accompanied by muscle loss, tooth loss, and a decline in gastrointestinal function. Additionally, the prevalence of chronic diseases tends to increase with age. Nutritional imbalances or deficiencies can exacerbate the progression of these diseases and accelerate the aging process. Therefore, careful attention to nutritional management is essential for elderly.1,2
The causes of nutritional management problems in the elderly can include physical issues such as loss of appetite, dysphagia, endocrine disorders, neurological diseases, and various infections or disorders. Additionally, social isolation resulting from the death of a spouse or friend, or the independence of a child, can contribute to these challenges. Economic factors, such as poverty stemming from decreased economic activity, may also impact eating habits and lead to nutritional problems. Furthermore, psychological factors such as anxiety, depression, and loneliness, which can arise with aging, may adversely affect nutritional status.2,3 For elderly individuals who may experience challenges with nutritional management due to various factors, it is essential to assess their overall nutritional status, including dietary intake, in their daily lives. To achieve this, regular screening tests should be conducted, and personalized nutritional support is necessary for those identified as having issues. In particular, it is beneficial to consider the individual’s realistic circumstances and apply nutritional knowledge that reflects their specific needs. Additionally, it would be advantageous to provide comprehensive nutritional management plans, nutrition education and counseling, reinforcement of supplements, and support for oral nutritional supplements.3,4
The Nutrition Screening Initiative (NSI) is a tool designed to assess nutritional management conditions, such as malnutrition. It was established in 1990 as a collaborative effort among the American Dietetic Association, the American Academy of Family Physicians, and the National Council on Aging. The NSI has created an opportunity in our rapidly aging society to connect the nutritional management systems for the elderly in the community with the healthcare delivery system.5 This tool has demonstrated reliability and validity through prior research and has been utilized in several studies.6-10
Korea is one of the countries experiencing rapid aging due to economic growth and advancements in medical science. It is projected that by 2024, 19.4% of the total population will be aged 65 or older, and that the proportion of the elderly population will exceed 30% from 2035 onwards.11 Additionally, due to social and cultural changes, the percentage of single-person households among those aged 65 or older was gradually increasing, rising from 16.0% in 2000 to 18.5% in 2015, and reaching 22.1% in 2024.12
It was found that elderly individuals living in single-person households experienced greater difficulties in obtaining adequate nutrition compared to those living with their spouse or family members. This was particularly evident in their infrequent consumption of vegetables, fruits and low intake of calcium, vitamin A, and omega-3 fatty acids.13 A study examining the living conditions of elderly individuals residing alone in Japan revealed that their ability to shop for ingredients and prepare meals was associated with a more varied diet, which in turn positively influenced their physical health. Furthermore, social interactions during meals with others were found to have beneficial effects, playing a crucial role in maintaining well-being and promoting a balanced lifestyle for elderly individuals living alone.14
In a study comparing the nutritional intake of the elderly based on family composition, it was found that elderly individuals living alone experienced numerous health-related issues compared to those living with family. These issues included reduced chewing ability, lower levels of physical activity, and increased complaints of pain. Their overall happiness was significantly diminished not only due to physical discomfort but also as a result of mental stress and poor sleep habits.13 The physical health problems faced by the elderly not only contribute to a decline in their actual quality of life but also serve as a major factor in nutritional deficiencies. In this context, quality of life refers to a sense of psychological satisfaction or stability and can be understood as overall life satisfaction. It is influenced by physical and mental functional status, socioeconomic status, and psychological well-being.15 Life satisfaction is a crucial criterion for the subjective evaluation of one’s life, and understanding the relationship between the life satisfaction of the elderly and its influencing factors is essential for preparing for and managing a positive aging experience.16
There are cases in which the poor nutritional status of the elderly living alone negatively affects their lives. In a study analyzing the relationship between nutritional risk, physical function, and depression of the elderly living alone, 44.8% of the elderly were found to have moderate or high nutritional risk. They stated that the risk of depression was 2.01 times greater than that of the group with good nutritional status.17 The nutritional status of the older people is closely linked to cognition. A study examining the cognitive function, nutritional status, and depression among elderly individuals in the community found that higher cognitive function is related to better nutritional status and lower levels of depression. Notably, the cognitive function and nutritional status of elderly individuals living alone were found to be poorer than those of their peers living with family members, and the relationship between cognitive function and nutritional status was also determined to be significant.18
Physical discomfort and stress experienced by elderly individuals living alone, without family support, diminish their overall sense of happiness. Additionally, inadequate nutritional status can adversely impact cognitive function and contribute to depression.13,18 Therefore, this study aims to assess the nutritional management status of elderly individuals living alone within the Korean community and to examine the association between their overall life satisfaction. Through this research, we seek to determine whether the nutritional challenges faced by these elderly individuals affect their physical health and social relationships, and whether these factors, in turn, influence their overall life satisfaction. Furthermore, by analyzing the relation between nutritional status and life satisfaction, we aim to highlight the need for policy and institutional interventions to enhance nutrition for older adults living alone.
Materials and Methods
Research participants and ethics review
This study utilized raw data from the elderly survey conducted by the Ministry of Health and Welfare in Korea, focusing on individuals aged 65 and older. The survey has been administered every three years since 2008, and this study specifically analyzed data from the 2020 survey. In 2020, the survey included 10,097 elderly participants, of whom 3,137 individuals in single-person households were selected for this study. Statistical data were downloaded after the researcher obtained certification at the homepage and disclosed the purpose of the study.19 The survey was conducted through one-on-one interviews with trained investigators. Prior to the interviews, the study was explained to participants, and consent for participation and data use was obtained. This research was conducted following approval from the Bioethics Review Committee of the Seowon university (Deliberation No. 1040820-202408-HR-004-02).
Research design and contents
The survey on the elderly, which serves as the data source for this study, was conducted to establish welfare policies for older adults in Korea. To prepare foundational data, the survey comprehensively included items that capture the current status of life, characteristics, and needs of the elderly population. These items encompass demographic characteristics, socioeconomic status, nutritional management, living environment, mental and physical health, and utilization of welfare institutions. In particular, this study utilized data from a Nutritional Screening Initiative (NSI) survey involving 3,137 elderly individuals aged 65 and older who live alone. The NSI consists of a total of 10 questions, with each question assigned a score ranging from 1 to 4 points, resulting in a maximum total score of 21 points. In this context, a higher total score indicates a greater nutritional risk. NSI items (weighted score) include questions such as disease (2 points), poor eating habits (3 points), consumption of fruits, vegetables, and dairy products (2 points), alcohol consumption (2 points), tooth loss or oral pain (2 points), economic difficulties (4 points), reduced social contact (1 point), and the need for self-care (2 points).20 Additionally, demographic characteristics such as age, weight, height, educational attainment, spousal situation, monthly income, and occupational situation of elderly individuals aged 65 or older living alone were examined. The survey also investigated health-related behaviors, including exercise, smoking, and drinking, as well as self-assessed health status and satisfaction with the living environment and overall quality of life, encompassing economic conditions, social interactions, cultural engagement, leisure activities, relationships with sons, daughters and friends, and connections to local communities (Figure 1).
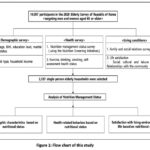 |
Figure 1: Flow chart of this study |
Data analysis
For the statistical analysis in this study, SPSS ver. 18.0 for Windows (Statistical Package for the Social Sciences, SPSS Inc., Chicago, IL, USA) was utilized. A frequency analysis was conducted for each question, and the reliability of the questions was assessed using the Nutrition Screening Initiative (NSI) checklist results to determine the nutritional management status of elderly individuals living alone. The total score for nutritional management status was categorized into three areas, and the average and standard deviation of the NSI scores in each area were calculated. Among the health-related survey of the elderly living alone, Body Mass Index (BMI) was calculated using height and weight, and classified into the following categories: 18.4 or less, 18.5-22.9, 23-24.9, 25-29.9, and 30 or more.21 Through cross-analysis, we examined whether there were differences in the distribution of gender, age, BMI, education level, marital status, employment status, alcohol consumption, smoking, and self-assessed health status according to nutritional management status. Additionally, we analyzed whether there were differences in overall life satisfaction and living environment factors, such as health status, friendships, economic status, and participation in social, cultural, and leisure activities, based on nutritional management status. Logistic regression was performed to examine the effect of the living environment on life satisfaction, considering factors such as nutritional management status, self-assessed health status, relationships with their child(s), economic status, friendships, social and cultural leisure activities, and connections with local communities among elderly individuals living alone.
Results
Nutrition screening initiative for elderly living alone
The results of the NSI checklist survey, conducted to evaluate the nutritional management status of 3,137 older people aged 65 and older who live alone, are presented in Table 1. The survey consists of a total of 10 items, and the analysis of item reliability yielded a Cronbach’s α value of 0.691. Among the 3,137 participants, the item reflecting the nutritional management issues faced by elderly individuals living alone was eat alone almost every time, which applied to 1,875 respondents (59.8%). The second item related to nutritional management problems was taken more than three different medications (both prescription and over-the-counter) per day, 968 individuals (30.9%). Following this, 882 individuals (28.2%) stated, can eat less than two meals per day, 715 participants (22.8%) indicated rarely eat fruits, vegetables, or dairy products (such as milk). 586 respondents (18.7%) expressed that can’t always physically shop, cook and/or feed themselves, and 558 individuals (17.8%) reported, am changing the amount or type of food I eat due to health issues. 360 participants (11.5%) indicated that they found it difficult to eat due to poor dental health or oral issues, 227 individuals (7.2%) stated they could not purchase the food they needed due to financial constraints, 128 respondents (4.1%) reported they could not afford grocery shopping, meal preparation, and eating, and 44 individuals (1.4%) mentioned that they consumed more than three alcoholic beverages almost every day.
Table 1: Nutrition screening initiative checklist of the elderly.
|
(n=3,137) |
||
|
Checklist |
Score* |
Yes (%) |
|
1. I am changing the amount or type of food I eat because of the disease (health) |
2 | 558(17.8) |
| 2. I can’t eat two meals a day. | 3 |
882(28.2) |
|
3. I rarely eat fruits, vegetables, or dairy products (such as milk). |
2 | 715(22.8) |
| 4. I drink more than three drinks almost every day. | 2 |
44(1.4) |
|
5. My teeth are not good or my mouth is broken, so I have a hard time eating food. |
2 | 360(11.5) |
| 6. Sometimes I can’t buy the food I need because I don’t have enough money. | 4 |
227(7.2) |
|
7. I eat alone most of the time. |
1 | 1,875(59.8) |
|
8. I take three or more different prescription or over-the-counter medications on a daily basis. |
1 | 968(30.9) |
|
9. I’ve lost or gained more than 5kg in the last six months, even though I haven’t deliberately controlled my weight. |
2 | 128(4.1) |
| 10. I sometimes find grocery shopping, making food, and eating too much to handle. | 2 | 586(18.7) |
|
Total |
21 | – |
|
Cronbach’s α = 0.691 |
||
*Weighted Score.
The total score for each elderly individual was calculated based on the weighted scores of the NSI checklist questions. Their nutritional management status was classified into three categories: Good (0-2 points), Moderate Nutritional Risk (3-5 points), and High Nutritional Risk (6 points or more), according to NSI criteria.20 The elderly individuals living alone was categorized according to their nutritional management status, and the average and standard deviation of the scores in each category were calculated and presented in Table 2. Of the 3,137 elderly individuals living alone, 1,872 (59.7%) fell into the Good category, with an average nutritional score of 0.885. Those classified as Moderate Nutritional Risk numbered 802 (25.6%), with an average score of 3.702 points, while the average score for those in the High Nutritional Risk category (14.8%) was 8.803 points.
Table 2: Number of elderly and score of nutrition status classification
| Good | Moderate risk | High risk | Total | |
| N(%) | 1,872(59.7) | 802(25.6) | 463(14.7) |
3,137(100.0) |
|
Score1) (mean±S.D.) |
0.885±0.790 | 3.702±0.759 | 8.803±3.662 |
2.774±3.195 |
1)Total nutritional score: 0~2 (good), 3~5 (moderate nutritional risk), 6 or more (high nutritional risk).
Demographic characteristics based on the elderly’s nutritional status
Table 3 presents the demographic characteristics of elderly individuals living alone. Among the 3,137 of elderly people in this group, 640 (20.4%) were male and 2,497 (79.6%) were female, indicating a higher prevalence of females. In terms of Body Mass Index (BMI) distribution, the largest group consisted of individuals with a BMI between 18.5 and 22.9, totaling 1,332 (42.6%). This was followed by 932 (29.8%) individuals with a BMI of 23-24.9, and 739 (23.6%) with a BMI of 25-29.9. Regarding educational attainment, the majority of elderly individuals living alone had not completed elementary school, totaling 1,885 (60.1%). Additionally, 647 (20.6%) had graduated from middle school, 544 (17.3%) from high school, and only 61 (1.9%) had attained a college degree or higher. This data suggests that a lack of education is related to a high prevalence of living alone among the elderly. In examining the monthly income distribution to evaluate the economic status of older adults alone, 2,087 (66.5%) reported an income of less than 1 million won per month, while 628 (20.0%) earned around 1 million won per month. Furthermore, the unemployment rate among this group was significant, with 2,109 (67.2%) being jobless, which is more than double the 1,028 individuals (32.8%) who were employed.
It was analyzed whether there were differences in the distribution of gender, age, BMI, education level, marital status, monthly income, and occupational status based on the nutritional management status of elderly individuals living alone. Significant differences were observed in the distribution of age, BMI, education level, occupational status, and monthly income as the nutritional management status declined from good to normal and high risk (p < 0.01, p < 0.001).
Table 3: Respondent characteristics by nutritional status
|
Variables |
N (%) | Nutrition screening initiative | |||||
| Good | Moderate risk |
High risk |
|||||
|
Gender |
Male | 640(20.4)1) | 380(20.3) | 163(20.3) | 97(21.0) | ||
| Female | 2,497(79.6)1) | 1,492(79.7) | 639(79.7) |
366(79.0) |
|||
|
χ2-value2) = 0.101, p = 0.951 |
|||||||
|
Age |
65-69 | 793(25.3) | 536(28.6) (5.3)† | 176(21.9) (-2.5) | 81(17.5) (-4.2) | ||
|
70-74 |
695(22.2) | 432(23.1) | 163(20.3) | 100(21.6) | |||
| 75-79 | 695(22.2) | 410(21.9) | 179(22.3) |
106(22.9) |
|||
|
80-84 |
634(20.2) | 336(17.9) (-3.8) | 175(21.8) |
123(26.6) (3.7) |
|||
| ≥ 85 | 320(10.1) | 157(8.4) (-4.0) | 109(13.6) (3.7) |
53(11.4) |
|||
|
χ2-value = 55.577, p = 0.000*** |
|||||||
|
BMI3) |
≤18.4 | 73(2.3) | 34(1.8) (-2.5) | 18(2.2) | 21(4.5) (3.6) | ||
|
18.5-22.9 |
1,332(42.6) | 765(41.1) (-2.0) | 370(46.2) (2.3) | 197(42.5) | |||
| 23-24.9 | 932(29.8) | 591(31.8) (2.8) | 224(28.0) |
117(25.3) (-2.3) |
|||
|
25-29.9 |
739(23.6) | 450(24.2) | 170(21.2) |
119(25.7) |
|||
| ≥30 | 49(1.7) | 21(1.1) (-2.4) | 19(2.4) (2.1) |
9(2.0) |
|||
|
χ2-value = 30.612, p = 0.001** |
|||||||
|
Education level |
≤ Elementary school | 1,885(60.1) | 1,040(55.6) (-6.3) | 515(64.2) (2.8) | 330(71.3) (5.3) | ||
| Middle school | 647(20.6) | 418(22.3) (2.9) | 157(19.6) |
72(15.6) (-2.9) |
|||
|
High school |
544(17.3) | 370(19.8) (4.4) | 118(14.7) (-2.3) | 56(12.1) (-3.2) | |||
| ≥ College | 61(1.9) | 44(2.4) (2.0) | 12(1.5) |
5(1.1) |
|||
|
χ2-value = 48.237, p = 0.000*** |
|||||||
|
Marital status |
Single |
39(1.2) | 22(1.2) | 13(1.6) | 22(0.9) | ||
| Bereavement | 2,763(88.1) | 1,633(87.2) | 714(89.0) |
416(89.8) |
|||
|
Divorce |
287(9.1) | 189(10.1) | 64(8.0) | 34(7.3) | |||
| Separation | 48(1.5) | 28(1.5) | 11(1.4) |
9(1.9) |
|||
|
χ2-value = 7.272, p = 0.296 |
|||||||
|
Monthly income (won) |
<1 million |
628(20.0) | 372(19.8) | 150(18.7) | 106(22.9) | ||
| 1 million≤-<2 million | 322(10.3) | 227(12.1) (4.2) | 67(8.4) (-2.1) |
28(6.0) (-3.2) |
|||
| 2 million≤-<3 million | 100(3.2) | 78(4.2) (3.8) | 17(2.1) (-2.0) |
5(1.1) (-2.8) |
|||
|
≥3 million |
2,087(66.5) | 1,195(63.8) (-3.9) | 568(70.8) (3.0) |
324(70.0) |
|||
|
χ2-value = 39.861, p = 0.000*** |
|||||||
|
Occupational status |
Have a job | 1,028(32.8) | 665(35.5) (4.0) | 232(28.9) (-2.7) | 131(28.3) (-2.2) | ||
| No job | 2,109(67.2) | 1,207(65.4) (-4.0) | 570(71.1) (2.7) |
332(71.7) (2.7) |
|||
|
χ2-value = 16.027, p = 0.000*** |
|||||||
|
Total |
3,137(100.0) | 1,872(100.0) | 802(100.0) |
463(100.0) |
|||
1)Total is 100%, 2)Chi-square test, 3)Include missing data (no response), **p<0.01, ***p<0.001,
† Adjusted standardized residual ≥ ±1.96 (p < 0.05).
Health-related behaviors and health condition based on the elderly’s nutritional status.
Table 4 presents the results of a cross-analysis examining the relation between nutrition and exercise habits, smoking behavior, alcohol consumption, and subjective health status of older people living alone. A total of 1,637 participants (52.2%) reported that they do not engage in any exercise. This was followed by 930 individuals (29.6%) who exercise 5-7 times per week, 421 individuals (13.4%) who exercise 3-4 times per week, and 49 individuals (4.7%) who exercise 1-2 times per week. As a result of examining the drinking habits of elderly individuals living alone, 2,173 respondents (69.3%) indicated that they do not drink at all, while 428 individuals (13.6%) reported drinking less than once a month. Additionally, 379 people (12.1%) stated that they drink 2-4 times a month, and 157 individuals (5.0%) admitted to drinking more than twice a week. In terms of smoking, 2,901 respondents (92.5%) reported that they do not smoke, whereas 236 individuals (7.5%) identified as smokers. Regarding self-assessed health, 1,252 respondents (40.2%) rated their health as good, 1,082 individuals (34.7%) rated it as moderate, and 783 people (25.1%) reported that their health is poor.
This study examined the distribution of responses concerning health-related behaviors—including exercise, smoking, and alcohol consumption—and self-rated health status among older adults residing alone, categorized by their nutritional management status. Statistically significant differences were observed in the distributions of alcohol consumption and self-rated health status according to nutritional management status (p < 0.05 and p < 0.001).
Table 4: Health-related behaviors based on the elderly’s nutritional management status
| Variables | N (%) | Nutrition screening initiative | |||||
| Good | Moderate risk | High risk | |||||
| Exercise1) | Not at all | 1,637(52.2)2) | 944(50.4) | 445(55.5) | 248(53.6) | ||
|
1-2 time(s)/week |
149(4.7)2) | 89(4.8) | 41(5.1) | 19(4.1) | |||
|
3-4 times/week |
421(13.4)2) | 267(14.3) | 96(12.0) | 58(12.5) | |||
| 5-7
times/week |
930(29.6)2) | 572(30.6) | 220(27.4) | 138(29.8) | |||
| χ2-value3) = 7.956, p = 0.241 | |||||||
| Alcohol consumption | Not at all | 2,173(69.3) | 1,272(67.9) (-2.0)† | 562(70.1) | 339(73.2) (2.0) | ||
| 0<-≤1 time/month | 428(13.6) | 269(14.4) | 106(13.2) | 53(11.4) | |||
| 1<-≤4 time(s)/mth | 379(12.1) | 250(13.4) (2.7) | 84(10.5) | 45(9.7) | |||
| ≥2 times/week | 157(5.0) | 81(4.3) (-2.1) | 50(6.2) | 26(5.6) | |||
| χ2-value = 14.909, p = 0.021* | |||||||
| Smoking | No | 2,901(92.5) | 1,742(93.1) | 736(91.8) | 423(91.4) | ||
| Yes | 236(7.5) | 130(6.9) | 66(8.2) | 40(8.6) | |||
| χ2-value = 2.305, p = 0.316 | |||||||
| Self-perceived health1) | Good | 1,252(40.2) | 885(47.5) (10.2) | 930(37.5) (-4.6) | 115(4.6) (-8.5) | ||
| Moderate | 1,082(34.7) | 663(35.6) | 280(35.2) | 139(30.3) (-2.2) | |||
| Poor | 783(25.1) | 315(16.9) (-12.9) | 250(31.4) (4.8) | 218(47.5) (12.0) | |||
| χ2-value = 228.225, p = 0.000*** | |||||||
| Total | 3,137(100.0) | 1,872(100.0) | 802(100.0) | 463(100.0) | |||
1)Include missing data (no response), 2)Total is 100%, 3)Chi-square test, * p <0.05, ***p<0.001,
† Adjusted standardized residual ≥ ±1.96 (p < 0.05).
Satisfaction with living environment and life based on the elderly’s nutritional status.
Table 5 presents the differences in the distribution of health, living environment, and life satisfaction according to the nutritional status among older adults living alone. When asked about their satisfaction with health, 1,453 respondents (46.6%) expressed satisfaction, 981 (31.5%) were moderate, and 683 (21.9%) were dissatisfied. Regarding relationships with children, 1,952 individuals (67.4%) were satisfied, 744 (25.7%) were moderate, and 201 (6.9%) were dissatisfied. In terms of economic status, 1,019 respondents (32.7%) were satisfied, 1,292 (41.5%) were moderate, and 806 (25.9%) were dissatisfied. Concerning social, cultural, and leisure activities, 1,294 individuals (41.5%) expressed satisfaction, 1,234 (39.6%) were neutral, and 1,234 (39.6%) were dissatisfied. Regarding relationships with friends and the community, 1,790 respondents (57.4%) were satisfied, 1,080 (34.6%) were neutral, and 247 (7.9%) were dissatisfied. For overall life satisfaction, 1,412 individuals (45.3%) were satisfied, 1,364 (43.8%) were moderate, and 341 (10.9%) were dissatisfied.
An analysis of the differences in the distribution of satisfaction with living environment and life based on nutritional status revealed statistically significant differences in the distribution of health status, relationships with friends, relationships with children, economic status, social, cultural, and leisure activities, relationships with friends and the community, and overall life satisfaction (p < 0.001).
Table 5: Satisfaction with living environment and life based on the elderly’s nutritional status
| Variables1 | N (%) | Nutrition screening initiative | |||
| Good | Moderate risk | High risk | |||
| Health status | Satisfaction | 1,453(46.6)2) | 1,005(53.9) (10.0)† | 301(37.9) (-5.7) | 147(32.0) (-6.8) |
| Moderate | 981(31.5)2) | 604(32.4) | 253(31.8) | 124(27.0) (-2.2) | |
| Dissatisfaction | 683(21.9)2) | 254(13.6) (-13.6) | 241(30.3) | 188(41.0) | |
| χ2-value3) = 218.828, p = 0.000*** | |||||
| Relationships with children | Satisfaction | 1,952(67.4) | 1,251(71.6) (6.0) | 458(62.8) (-3.0) | 243(57.7) (-4.6) |
| Moderate | 744(25.7) | 409(23.4) (-3.4) | 214(29.4) (2.6) | 121(28.7) | |
| Dissatisfaction | 201(6.9) | 87(5.0) (-5.1) | 57(7.8) | 57(13.5) (5.8) | |
| χ2-value = 58.491, p = 0.000*** | |||||
| Economic condition | Satisfaction | 1,019(32.7) | 675(36.2) (5.1) | 210(26.4) (-4.4) | 134(29.2) |
| Moderate | 1,292(41.5) | 814(43.7) (3.1) | 344(43.3) | 134(29.2) (-5.8) | |
| Dissatisfaction | 806(25.9) | 374(20.1) (-9.0) | 241(30.3) (3.3) | 191(41.6) (8.3) | |
| χ2-value = 112.226, p = 0.000*** | |||||
| Social culture and leisure activities | Satisfaction | 1,294(41.5) | 896(48.1) (9.1) | 259(32.6) (-5.9) | 139(30.3) (-5.3) |
| Moderate | 1,234(39.6) | 710(38.1(-2.1)) | 338(42.5) (2.0) | 186(40.5) | |
| Dissatisfaction | 589(18.9) | 257(13.8) (-8.9) | 198(24.9) (5.0) | 134(29.2) (6.1) | |
| χ2-value = 118.125, p = 0.000*** | |||||
| Relationships with friends and community | Satisfaction | 1,790(57.4) | 1,157(62.1) (6.4) | 415(52.2) (-3.5) | 218(47.5) (-4.7) |
| Moderate | 1,080(34.6) | 614(33.0) (-2.4) | 296(37.2) | 170(37.0) | |
| Dissatisfaction | 247(7.9) | 92(4.9) (-7.5) | 84(10.6) (3.2) | 71(15.5) (6.5) | |
| χ2-value = 83.518, p = 0.000*** | |||||
| Overall life satisfaction | Satisfaction | 1,412(45.3) | 960(51.5) (8.5) | 309(38.9) (-4.2) | 143(31.2) (-6.6) |
| Moderate | 1,364(43.8) | 782(42.0) (-2.4) | 382(48.1) (2.8) | 200(43.6) | |
| Dissatisfaction | 341(10.9) | 121(6.5) (-9.7) | 104(13.1) (2.2) | 116(25.3) (10.7) | |
| χ2-value = 171.365, p = 0.000*** | |||||
| Total | 3,137(100.0) | 1,872(100.0) | 802(100.0) | 463(100.0) | |
1)Include missing data (no response) in all variables, 2)Total is 100%, 3)Chi-square test, ***p<0.001,
† Adjusted standardized residual ≥ ±1.96 (p < 0.05).
The effect of nutritional status and living environment on overall life satisfaction.
The results of a logistic regression examining the impact of nutritional management situation and living environment on overall life satisfaction among elderly individuals living alone are presented in Table 6. It was found that when elderly individuals had better nutritional status, their overall life satisfaction significantly increased by 1.277 times compared to when their nutritional status was poor (p< 0.001). Additionally, individuals who assessed their health status as good exhibited a 2.191 times significant increase in life satisfaction compared to those who assessed their health as not good (p < 0.001). Life satisfaction was 2.469 times higher for those with better relationships with their children compared to those with poor relationships. Those who were satisfied with their economic condition reported 3.250 times higher life satisfaction compared to those dissatisfied with their economic status. Furthermore, satisfaction with social, cultural, and leisure activities was associated with a 3.285 times higher life satisfaction compared to those dissatisfied with these activities. Finally, individuals who were satisfied with their relationships with friends and the community showed a 6.315 times higher life satisfaction compared to those dissatisfied with these relationships (p < 0.001).
Table 6: The Effects of nutritional status and living environment on overall life satisfaction (logistic regression analysis)
| Variables | Adjusted1
odds ratio |
95% CI | p-value | |
| Nutritional status | Not good | 1 | ||
| Good | 1.277 | 1.147-1.422 | 0.000*** | |
|
Health status (Self- perceived) |
Not healthy | 1 | ||
| Healthy | 2.191 | 1.846-2.600 | 0.000*** | |
| Child relationship | Not good | 1 | ||
| Good | 2.469 | 1.970-3.095 | 0.000*** | |
| Economic
conditions |
Not satisfaction | 1 | ||
| Satisfaction | 3.250 | 2.706-3.902 | 0.000*** | |
| Social culture and leisure activities | Not satisfaction | 1 | ||
| Satisfaction | 3.285 | 2.726-3.958 | 0.000*** | |
| Friend & community relations | Not good | 1 | ||
| Good | 6.315 | 4.991-7.990 | 0.000*** | |
1Adjusted: adjusted for sex, educational attainment, age, spousal situation, and monthly earnings. ***p<0.001.
Discussion
In this study, data from the elderly survey conducted by the Ministry of Health and Welfare in 2020 were utilized to investigate the living environment and life satisfaction among elderly individuals alone in the Republic of Korea, with a focus on their nutritional management status. The nutritional management status was analyzed for 3,137 older adults aged 65 and over that reside alone in the community. The Nutritional Screening Initiative (NSI) was employed to assess nutritional management status, and the reliability and validity of the NSI tool have been demonstrated in several studies.6-10 In this study, the Cronbach’s α value was calculated to be 0.691, indicating a reliable level of internal consistency.
The nutritional management challenges faced by elderly individuals living alone, which represented the highest frequency among the items in the Nutritional Screening Initiative (NSI) survey, included the statement, eat alone almost every time followed by the response, rarely eat fruits, vegetables, or dairy products (such as milk) (46.2%). In a previous study, elderly individuals living alone exhibited a higher frequency of skipping meals and significantly lower intakes of fruits and vegetables compared to their counterparts living with family members.13 Additionally, they demonstrated low intakes of nutrients, including vitamin A, folate, potassium, calcium, magnesium, omega-3 fatty acids, and dietary fiber, which placed them at risk for low body weight or high nutritional risk.13,22,23
In this study, 14.7% of the 3,137 elderly individuals living alone were identified as being at high nutritional risk, 25.6% were at moderate risk, and 59.7% were classified as having good nutritional status. A related nutritional study conducted at a family center in downtown Turkey revealed a significant correlation between NSI and the Mini Nutritional Assessment (MNA).24 According to the NSI, the rate of high nutritional risk was 22.1%, while the rate of normal risk was 38.6%, indicating a higher prevalence of nutritional risk compared to the current study, which focused on elderly individuals living alone in the community. In the same study, nutritional status among older adults was significantly associated with age and BMI. But in the present study, nutritional management status showed significant distributional differences not only with age and BMI, but also with educational level, income, and employment status. Elderly individuals who were older, had lower educational attainment, or lacked income or employment tended to have poorer nutritional management. These findings suggest that elderly individuals living alone face greater challenges in maintaining adequate nutrition due to differences in personal environmental conditions and lifestyle factors compared to those living with family. Therefore, they may require more attentive support and targeted intervention strategies.13,25
Among the elderly individuals living alone in this study, 46.6% reported being satisfied with their health, 32.7% were satisfied with their economic status, and 45.3% expressed overall life satisfaction. Furthermore, self-perceived health status, living environment, and overall life satisfaction were significantly more positive among those with better nutritional management. Community-dwelling older adults with better nutritional status were more likely to perceive their health positively, which may be linked not only to physical well-being but also to mental health outcomes.26 In other words, the social and cultural dimensions embedded in positive eating experiences may serve as psychological factors that contribute to greater life satisfaction.27 A Canadian study on the elderly revealed that those who consume fruits and vegetables daily report self-assessed health that is four times better than that of their peers who do not, and their life satisfaction is three times higher.26 Satisfaction with food can provide pleasure to the elderly, contributing to a sense of psychological stability that enhances their experience of a given environment and improves their ability to lead an independent life.27,28 Furthermore, sharing meals with others can foster social interaction, which may increase appetite and enhance nutritional status. In other words, the positive social and psychological aspects of eating can lead to improved nutritional outcomes, ultimately resulting in greater overall life satisfaction.26,28
As a result of this study, improved nutritional management was associated with stronger relationships with individuals in one’s social circle, including their children and friends, as well as greater satisfaction with social interactions, such as leisure activities. A reduction in relationships, activities, and social interactions with others may lead to feelings of social isolation, which may adversely impact the somatic and psychological state of the older person.29 Specifically, a higher degree of social isolation is correlated with reduced physical activity and irregular meal patterns, often resulting in undesirable dietary habits.29,30 Similarly, in this study, nutritional management status demonstrated a significant relationship with life satisfaction. It was found that economic satisfaction, along with a positive perception of friends, children, and social relationships, contributed to increased life satisfaction. Social support is essential for actively understanding and addressing the realities faced by elderly individuals living alone, particularly as they experience declines in both physical function and social engagement. For seniors residing in the community, there is a pressing need to expand institutional resources that facilitate both nutritional activities and social interactions through a variety of supportive programs.
Conclusion
In this study, data from the 2020 Elderly Survey, conducted by the Ministry of Health and Welfare, were utilized to assess the nutritional management status of elderly individuals living alone in the Korean community and to analyze the relationship between this status and their overall satisfaction.
As a result of the study, the nutritional management issues frequently encountered by elderly individuals living alone included factors such as, eat alone almost every time and rarely consume fruits, vegetables, or dairy products the 3,137 elderly participants living alone, 59.7% were classified as having ‘Good’ nutritional status, 25.6% as ‘Moderate risk,’ and 14.8% as ‘High risk.’ Significant differences were observed in the distribution of age, body mass index (BMI), education level, employment status, monthly income, and job status based on nutritional management status. Furthermore, the frequency of alcohol consumption and self-assessed health status also exhibited significant differences according to nutritional status. There were significant differences in health status, relationships with their children, economic status, social and cultural leisure activities, relationships with friends and local communities, and overall life satisfaction based on the nutritional management status of elderly individuals living alone. When their nutritional status was rated as good, overall life satisfaction increased by 1.277 times. Life satisfaction increased by 2.191 times when self-evaluated health was rated as good, 2.469 times when relationships with children were deemed positive, 3.250 times when individuals were satisfied with their economic conditions, 3.285 times when they were content with social and cultural leisure activities, and 6.315 times when they expressed satisfaction with their relationships with friends and communities.
This study has limitations as it is based solely on results obtained at a specific point in time. Conducting a longitudinal study that collects data on the temporal trends of nutrition and satisfaction among elderly individuals living alone, as well as patterns of social change, would allow for the incorporation of macro-level factors. From the results presented, it is evident that nutritional management issues, such as eating alone and insufficient consumption of vegetables, fruits, and dairy products among elderly individuals living in single-person households require improvement. Furthermore, to enhance well-being in later life, institutional measures that support various activities promoting both healthy eating habits and social interactions should be further expanded.
Acknowledgement
The author would like to thank Seowon University for granting this study. Additionally, the author expresses gratitude to the officials of the Ministry of Health and Welfare for conducting the survey on the elderly, as well as to all the individuals who participated in the survey.
Funding Sources
The author(s) received no financial support for the research, authorship, and/or publication of this article.
Conflict of Interest
The authors do not have any conflict of interest.
Data Availability Statement
The data used in this study and those not shown (statistically non-insignificant) are available from the corresponding author upon request.
Ethics Statement
The research protocol conformed to the 1975 Declaration of Helsinki and was approved by the Bioethics Review Committee of the Seowon university (1040820-202408-HR-004-02).
Informed Consent Statement
The data used in this study are part of the elderly survey conducted by the Ministry of Health and Welfare in 2020 of the Republic of Korea. Informed consent was obtained from all participants involved in this survey.
Clinical Trial Registration
This research does not involve any clinical trials.
Permission to Reproduce Material from Other Sources
Not Applicable.
Author Contributions
The sole author was responsible for the conceptualization, methodology, data collection, analysis, writing, and final approval of the manuscript
References
- Laguna L., Sarkar A., Chen J. Nutrition Functional Foods for Healthy Aging. Chap.10. Eating Capability Assessments in Elderly Populations. London: Academic Press. 2017
CrossRef - Hickson M. Malnutrition and ageing. Postgrad Med J. 2006;82(963):2–8. doi: 1136/pgmj.2005.037564
CrossRef - Poggiogalle E., Kiesswetter E, Romano M., et al. Psychosocial and cultural determinants of dietary intake in community-dwelling older adults: A Determinants of diet and physical activity systematic literature review. Nutr. 2021;85(1):111131. doi:10.1016/j.nut.2020.111131
CrossRef - Dent E., Wright O.R.L., Woo J., et al. Malnutrition in older adults. Lancet. 2023;401:951-966. https://doi.org/10.1016/S0140-6736(22)02612-5
CrossRef - Barrocas A.l., White J.V., Gomez C., et al. Assessing health status in the elderly: The Nutrition Screening Initiative. J Health Care Poor Underserved. 1996;7(3): 210-218. doi:1353/hpu.2010.0569
CrossRef - Sinnett S, Bengle R, Brown A, et al. The validity of nutrition screening initiative DETERMINE checklist responses in older Georgians. J Nutr Elder 2010;29(4):393–409. doi:10.1080/01639366.2010.521031.
CrossRef - Viera L. S., Formoso Assuncao M.C., Schafer A.A., et al. Validity assessment of the nutrition screening initiative checklist in older adults. Clin Nutr ESPEN. 2016;15:16–20. doi:1016/j.clnesp.2016.05.002.
CrossRef - Kim S.J, Kim I.G., Jung D.U., et al. Associations between Nutritional Risk and Mental Health in an Elderly Korean Population. J Korean Geriatr Psychiatry 2020;24 (1):28-36. doi:47825/jkgp.2020.24.1.28
CrossRef - Jang H.Y., Kim J.H. Factors Influencing Malnutrition in Elderly Men Living Alone. Journal of JKDAS 2020;22(3):1159-1172. doi:37727/jkdas.2020.22.3.1159
CrossRef - Eckert C., Gell N.M., Wingood M., et al. Malnutrition Risk, Rurality, And Falls Among Community-Dwelling Older Adults. J Nutr Health Aging 2021;25(5):624–627. doi:10.1007/s12603-021-1592-8.
CrossRef - Korean Statistical Information Service Population. Accessed April 1, 2025. https://kosis.kr/statHtml/statHtml.do?orgId=101&tblId=DT_1BPA002&checkFlag=N.
- Statistics Korea. 2024. Future Household Estimation, National Internet Indicators. Percentage of elderly living alone. Accessed April 1, 2025. https://www.index.go.kr/unity/potal/indicator/IndexInfo.do?idxCd=4233.
- Lee J.E. Comparison of Dietary Behaviors and Health-Related Quality of Life of the Elderly Based on Their Household Type in Korea. Nutr Food Sci 2024; 12(2). doi: 12944/CRNFSJ.12.2.10
CrossRef - Ishikawa M., Yokoyama T. The relationship between individual and environmental factors related to health, nutritional status, and diet in elderly people living alone in Japan. Nutr Rev 2023; 81(1):91–94. doi:1093/nutrit/nuac041.
CrossRef - de Labra C., Maseda A., Lorenzo-López L., et al. Social factors and quality of life aspects on frailty syndrome in community-dwelling older adults: The VERISAÚDE study. BMC geriatrics 2018;18(1):66-74, doi:1186/s12877-018-0757-8.
CrossRef - Tian H., Chen J. Study on Life Satisfaction of the elderly based on healthy aging. J Healthcare Eng 2022;22(1):8343452, doi:10.1155/2022/8343452
CrossRef - Park J.H., Kang S.W. Nutritional risk, depression, and physical function in older people living alone. Healthcare 2024;12(2): 164-175. doi:3390/healthcare12020164.
CrossRef - Jung Y.M., Kim J.H. Comparison of cognitive levels, nutritional status, depression in the elderly according to living situations. J Korean Acad Nurs 2004;34(30):495-503. https://www.kci.go.kr/kciportal/ci/sereArticleSearch/ciSereArtiView.kci?sereArticleSearchBean.artiId=ART001103711.
CrossRef - Korea Institute for Health and Social Affairs. 2025. Health and Welfare Data Portal. Accessed April 1, 2025. https://data.kihasa.re.kr/kihasa/kor/contents/ContentsList.html.
- Posner B.M., Jette A.M., Smith K.W., et al. Nutrition and health risks in the elderly: the nutrition screening initiative. Am J Public Health 1993;83(7):972-978. doi:2105/ajph.83.7.972.
CrossRef - WHO expert consultation. Appropriate body-mass index for Asian populations and its implications for policy and intervention strategies. Lancet 2004;363(9403): 157-163. doi:1016/S0140-6736(03)15268-3.
CrossRef - Takiguchi T, Nishijo M, Kaneko N, et al. Foods and nutrients at risk for insufficient intake by community-dwelling healthy older women eating alone and together in Japan: A preliminary finding. Nutrients 2023;15(10):2391. doi: 3390/nu15102391.
CrossRef - Quigley K.K., Hermann J.R., Warde W.D. Nutritional Risk among Oklahoma Congregate Meal Participants. J Nutr Educ Behav 2008;40(2):89-93. doi: 1016/j.jneb.2007.08.014.
CrossRef - Karahan Yilmaz S., Eskici G. Nutritional Screening and Physical Activity Status Assessment in Elderly: Comparison of Nutritional Screening Initiative (NSI), Short Nutritional Assessment Questionnaire (SNAQ), the Mini Nutritional Assessment (MNA). Aging Med Healthcare 2023;14(1):9-14. doi: 33879/AMH.141.2021.04027.
CrossRef - Kucukerdonmez O., Navruz Varli S., Koksal E. Comparison of nutritional status in the elderly according to living situations. J Nutr Health Aging 2017;21(1):25-30. doi:1007/s12603-016-0740-z.
CrossRef - Lengyel C.O., Tate R.B., Obirek Blatz A.K. The relationships between food group consumption, self-rated health, and life satisfaction of community-dwelling Canadian older men: the Manitoba follow-up study. J Nutr Elder 2009;28(2):158–173. doi:1080/01639360902950182.
CrossRef - Ghimire S., Baral B.K., Karmacharya I., et al. Life satisfaction among elderly patients in Nepal: Associations with nutritional and mental well-being. Health Qual Life Outcomes 2018;16(1):118-127. doi:1186/s12955-018-0947-2.
CrossRef - Amarantos E, Martinez A, Dwyer J. Nutrition and quality of life in older adults. J Gerontol 2001;56(2):54–64. doi:1093/gerona/56.suppl_2.54.
CrossRef - Delerue-Matos A, Barbosa F, Cunha C, et al. 2021. Social isolation, physical inactivity and inadequate diet among European middle-aged and older adults. BMC public health 2021;21(1):924-936. doi: 1186/s12889-021-10956-w.
CrossRef - Kalousova L. Social isolation as a risk factor for inadequate diet of older Eastern Europeans. Int J Public Health 2014;59(5):707–714. doi:1007/s00038-014-0582-6.
CrossRef
Accepted on: 17 Jul 2025
Second Review by: Eren CANBOLAT
Final Approval by: Dr Shih-Min Hsia


Web of Science Coverage
Emerging Sources Citation Index (ESCI)
2024 Journal Impact Factor: 1.1
Scopus Journal Metrics
CiteScore 2025: 2.6
CiteScore Details
Sustainable Nutrition: Food Systems, Nutrient Retention, and Public Health Impact
![]()
This journal is a member of, and subscribes to the principles of, the Committee on Publication Ethics (COPE)


