Copper Deficiency Anemia in Older Patients with Swallowing Disorders: A Case Report
1Department of Surgery, Graduate School of Medicine, Kyoto University, 54 Kawahara-cho, Shogoin, Sakyo-ku, Kyoto 6068507, Japan
2Department of Medical Life System, Faculty of Life and Medical Science, Doshisha University, 1-3 Tatara Miyakodani, Kyotanabe city, Kyoto 610-0394 Japan
Corresponding Author Email: kiwaisak@mail.doshisha.ac.jp
DOI : http://dx.doi.org/10.12944/CRNFSJ.7.3.04
Download this article as:
![]()
Background: Trace element deficiency is most commonly a result of long-term intravenous nutrition; however, it can also develop on rare occasions in people who are fed orally. The present study aimed to investigate the development of copper-deficiency anemia in older patients who were provided with dysphagia diets because of swallowing disorders. Methods: The study included 34 patients who were provided with dysphagia diet A for at least three months at Higashiyama Sanatorium for the Elderly in Kyoto, Japan. Results: Six patients had hemoglobin levels below 10.0 g/dL before being placed on a dysphagia diet; however, this number increased to 17 during this study. Univariate analysis showed the factors associated with anemia onset to be serum copper level and dysphagia diet administration duration, whereas multivariate analysis showed only serum copper level to be significant. Receiver operating characteristic analysis showed the serum copper level cut-off value to be 13 μg/dL with respect to development of anemia (sensitivity: 100%; specificity: 59%). In addition, oral copper supplementation for two months improved anemia in all 15 cases who were followed up. Conclusions: Patients receiving dysphagia diet are at risk of developing copper deficiency anemia. Copper supplementation is recommended for all older patients being prescribed this type of diet, and special attention is required in this respect.
KEYWORDS:Copper-Deficiency Anemia; Trace Element Deficiency; Dysphagia Diet; Dietary Supplement
Introduction
It is not uncommon for swallowing function to deteriorate due to causes such as old age, dementia, and cerebrovascular disease sequelae.1,2 Changing the consistency of food making them safer to swallow, such as introducing easy-to-swallow food, termed dysphagia diet, are recommended for such patients, in order to prevent aspiration.3,4 Dysphagia diet is a general term for food that has been developed with priority given to its physical properties and shape, making them safer to swallow for patients with swallowing disorders.3-5
With the aging society, the numbers of patients undergoing long-term intravenous nutrition or tube feeding due to difficulties with oral nutrition have increased in recent years.1-4 In connection with these methods of nutritional support, there has been a rise in the number of reports concerning deficiencies in trace elements such as zinc and copper, which were previously considered to be uncommon.6-8 In recent years, however, progress has been made with development of tube-feeding nutritional supplements that are fortified with trace elements.6-8
Copper plays important roles in bone and connective tissue metabolism, hematopoiesis, antioxidant action and neurological function, being an essential trace element for the human body.9-11 Copper a one of trace elements and present in various foods such as shellfish, crustaceans, animal liver, and beans.12 Its deficiency is very rare among people who are able to eat orally, and so it was previously known as a condition involving anemia, leukopenia, and bone malformation, observed in those with digestive tract nutrition absorption disorders, those with Menkes syndrome, which is a congenital copper absorption disorder, and infants with low birth weight and/or poor nutritional status.13,14 The adult human body contains approximately 80 mg of copper, of which approximately 50% is in the muscles and bone, and approximately 10% in the liver. Excessive levels of intracellular copper lead to toxicity, and copper homeostasis is therefore maintained rigorously by regulating absorption and excretion.15,16 In terms of the biological functions of copper in the human body, it binds to the active centers of approximately ten types of enzymes, and this is connected with energy generation, iron metabolism, extracellular matrix maturation, neurotransmitter production, and active oxygen elimination.17,18
Copper deficiency leads to iron-independent anemia and neutropenia, and in severe cases, it can lead to heart failure.9-11 Therefore, improvements in knowledge as well as awareness about prophylaxis, diagnosis, and treatment are essential. There has been a considerable number of reports of copper deficiency due to intravenous nutrition with high-calorie infusions, and tube feeding with low copper content19-21; however, it is essential to recognize that, depending on the diet contents, there is also a risk of this condition in people who mainly take dysphagia diet.
Dysphagia diet A was used to prevent aspiration and ensure caloric intake at this hospital for patients with swallowing disorders. A number of patients who were provided with this dysphagia diet developed severe anemia, and so the potential causes of this disorder were analyzed, and anemia alleviation was demonstrated. It is hoped that this report will contribute to a deeper understanding of copper-deficiency anemia in older patients with swallowing disorders We report cases of copper deficiency anemia with patients receiving dysphagia diet A, because there was only one previous case report in Japanese.22
Materials and Methods
Subject Population
The study included 34 patients provided with dysphagia diet A as staple food continuously for at least three months from November 2014 at Higashiyama Sanatorium for the Elderly in Kyoto. Depending on the amount required for each patient, four or five packets of this dysphagia diet was provided per day to ensure caloric intake. The nutritional component of dysphagia diet A is shown in Table 1. Patients who had been concomitantly provided with two or more types of dysphagia diet were excluded. None of the subjects were found to have underlying conditions that could lead to copper absorption disorders, such as gastrectomy or excessive zinc intake. A flow diagram to show the process of analysis is shown in Fig. 1.
Table 1: Nutrition information of Dysphagia Diet A and Japanese Recommended Nutrient Intake (RNI)
| Dysphagia Diet A | Japanese RNI | Percentage of RNI | |||
| 1 Pack | 5 Pack (1Day) | (woman 70 y.o. or older) | |||
| Mass [g] | 220 | 1100 | |||
| Energy [kcal] | 300 | 1500 | 1500 | 100 | |
| Protein [g] | 11.2 | 56 | 50 | 112 | |
| Lipid [g] | 8.4 | 42 | 42 | 100 | |
| Carbohydrate [g] | 45.5 | 227.5 | 216 | 105 | |
| Water [g] | 152.7 | 763.5 | 2400 | 32 | |
| Sodium [mg] | 150 | 750 | 600 | 125 | |
| Mineral | Potassium [mg] | 420 | 2100 | 2000 | 105 |
| Chlorine [mg] | 300 | 1500 | 600 | 250 | |
| Calcium [mg] | 300 | 1500 | 500 | 300 | |
| Magnesium [mg] | 30 | 150 | 220 | 68 | |
| Phosphorus [mg] | 240 | 1200 | 800 | 150 | |
| Iron [mg] | 3.0 | 15 | 5.0 | 300 | |
| Zinc [mg] | 1.2 | 6.0 | 6.0 | 100 | |
| Copper [mg] | 0.03 | 0.15 | 0.6 | 25 | |
| Manganese [mg] | 0.02 | 0.1 | 3.5 | 2.9 | |
| Vitamin | Vitamin D [µg] | 0.9 | 4.5 | 5.5 | 82 |
| Vitamin E [mg] | 3.4 | 17 | 6 | 283 | |
| Vitamin B1 [mg] | 0.36 | 1.8 | 0.8 | 225 | |
| Vitamin B2 [mg] | 0.4 | 2.0 | 0.9 | 222 | |
| Niacin [mg] | 5.4 | 27 | 8.0 | 338 | |
| Vitamin B6 [mg] | 0.54 | 2.7 | 1.0 | 270 | |
| Vitamin B12 [µg] | 0.8 | 4.0 | 2.0 | 200 | |
| Folate [µg] | 66 | 330 | 200 | 165 | |
| Pantothenic acid [mg] | 1.6 | 8.0 | 5.0 | 160 | |
| Vitamin C [mg] | 34 | 170 | 85 | 200 | |
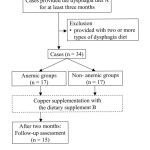 |
Figure 1: Flow diagram showing the process for analysis in this study. Click here to View figure |
Informed consent was obtained from each participant. This study was performed in accordance with the ethical guidelines for epidemiological research in Japan and was approved by the Ethics Committee of the Meisei Hospital (approval code: E2019003). All procedures performed in studies involving human participants were in accordance with the ethical standards of the institutional and/or national research committee and with the 1964 Helsinki declaration and its later amendments or comparable ethical standards.
Clinical factors
The following anemia-related factors were analyzed; age, sex, duration the patient received type A dysphagia diet as patient demographic factors; complete blood cell count and leukocyte fractions as hematological factors; and blood chemistry factors such as serum iron, total iron-binding capacity, unsaturated iron-binding capacity, ferritin, vitamin B12, folic acid, serum copper.23
Definition of Anemia
According to the WHO, the definition of moderate and severe anemia are as detailed below.24 Anemia is defined as hemoglobin levels <12.0 g/dL in women and <13.0 g/dL in men. In this study, patients were considered to be anemic if they had moderate or severe anemia.
- Moderate anemia: Hemoglobin levels 60 to 80% of the standard value.
- Severe anemia: Hemoglobin levels less than 60% of the standard value.
Copper Supplementation
As diagnostic treatment, dietary supplement B containing 0.9 mg of copper per pack (Table 2) was administered for 34 patients who had been provided with dysphagia diet A. Because of the marked decrease in serum copper level, one or two packs per day were additionally administered. For 15 anemia patients for whom longitudinal follow-up was possible, hematology tests were conducted over two months from initiation of type B dietary supplementation. In addition, a comparison was made between five patients whose hemoglobin levels decreased by 50% or more within two years after initiation of dysphagia diet A and ten patients whose hemoglobin levels decreased by less than 50%.
Table 2: Nutrition information of Dietary Supplement B
| Dietary Supplement | ||
| B | ||
| Mass [g] | 66 | |
| Energy [kcal] | 80 | |
| Protein [g] | 4 | |
| Lipid [g] | 1.2 | |
| Carbohydrate [g] | 13.3-13.7 | |
| Water [g] | 46 | |
| Sodium [mg] | 60 | |
| Mineral | Potassium [mg] | 7 |
| Calcium [mg] | 200 | |
| Magnesium [mg] | 2 | |
| Phosphorus [mg] | 200 | |
| Iron [mg] | 7 | |
| Zinc [mg] | 7 | |
| Copper [mg] | 0.9 | |
| Vitamin | Vitamin D [µg] | 12.5 |
| Niacin [mg] | 1.2 | |
| Vitamin B12 [µg] | 0.15-0.66 | |
Statistical Analysis
The results of each test were expressed as number (%) for categorical data and mean (± SD) for continuous data. Univariate analyses of categorical variables and continuous variables were performed using Fisher’s exact test and the Wilcoxon rank-sum test for comparing the anemic and non-anemic groups of subjects. For multivariate analysis, factors relating to anemia were selected based on the univariate analysis, and logistic regression analysis was performed. For single subjects, paired t-tests were used for continuous variables and longitudinal changes, with the significance level set at P < 0.05 in each analysis. The serum copper cut-off value for anemia onset, sensitivity, and specificity were calculated on the basis of receiver operating characteristic (ROC) analysis.
Results
A total of 34 patients who were provided with dysphagia diet A were included for analysis. 17 patients (2 males and 15 females) had anemia, and the mean age was 87.4 years. The other 17 patients (4 males and 13 females) had not become anemic, and the mean age was 87.6 years.
Time course of hemoglobin concentrations after initiation of dysphagia diet
The relationship between the duration of dysphagia diet administration and rate of hemoglobin change is shown in Fig. 2. The hemoglobin level tended to decrease after the initiation of dysphagia diet and continued to decline afterwards. In three , the decrease after several months of administration was 50% or greater.
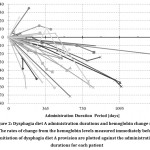 |
Figure 2: Dysphagia diet A administration durations and hemoglobin change rates Click here to View figure |
The rates of change from the hemoglobin levels measured immediately before initiation of dysphagia diet A provision are plotted against the administration durations for each patient
Comparison of clinical factors and univariate analysis between anemic and non-anemic groups
The comparison of patient factors and hematological data between the anemic and non-anemic groups, as well as the results of univariate analysis, are shown in Table 3. No significant differences in the patient factors of age and sex were found between the anemic and non-anemic groups, but the patients in the anemic group tended to be on the dysphagia diet for longer (P = 0.036).
Table 3: Clinical characteristics of the anemic and non-anemic groups and results of univariate analysis
| Variables | Normal Range: Female (Male) | Anemia(-) | Anemia(+) | P Value |
| (n = 17) | (n = 17) | |||
| Age (years), mean (range) | 87.6 (77-100) | 87.4 (79-96) | ||
| Sex (Male/Female) | 4/13 | 2/15 | 0.66 | |
| Feeding Period [days](mean ± SD) | 340 ± 275 | 548 ± 314 | 0.036 | |
| CBC (mean ± SD) | ||||
| WBC [102/μL] | 35-91(39-98) | 53.6 ± 17.0 | ↓24.2 ± 9.6 | < 0.0001 |
| Hb [g/dL] | 11.3-15.2 (13.5-17.6) | 11.7 ± 1.1 | ↓6.45 ± 2.3 | < 0.0001 |
| Ht [%] | 33.4-44.9 (39.8-51.8) | 35.2 ± 3.4 | ↓19.7 ± 6.4 | < 0.0001 |
| MCV [fL] | 79.0-100.0 (82.7-101.6) | 94.0 ± 7.9 | ↑106.7 ± 13.9 | 0.003 |
| MCH [pg] | 26.3-34.3 (28.0-34.6) | 31.2 ± 2.8 | 34.3 ± 3.8 | |
| MCHC [%] | 30.7-36.6 (31.6-36.6) | 33.1 ± 1.2 | 32.2 ± 1.5 | |
| Platelet [104/μL] | 13.0-36.9 (13.1-36.2) | 25.1 ± 7.0 | 19.7 ± 7.7 | |
| differential WBC count (mean ± SD) | ||||
| Neutrophil [%] | 44.0-72.0 | 53.9 ± 18.3 | ↓33.9 ± 14.8 | 0.002 |
| Eosinophil [%] | 0.0-10.0 | 4.3 ± 4.3 | 5.7 ± 4.8 | |
| Basophil [%] | 0.0-3.0 | 0.5 ± 0.4 | 0.7 ± 0.5 | |
| Lymphocyte [%] | 18.0-59.0 | 31.7 ± 14.9 | 43.1 ± 13.1 | |
| Monocyte [%] | 0.0-12.0 | 9.6 ± 4.2 | ↑16.7 ± 6.3 | 0.001 |
| Biochemical test (mean ± SD) | ||||
| serum iron [μg/dL] | 48-170 (58-188) | 66.5 ± 30.1 | 53 ± 37.7 | 0.095 |
| TIBC [μg/dL] | 235-432 (245-402) | 289 ± 45 | 245 ± 63 | |
| UIBC [μg/dL] | 108-316 (104-295) | 222 ± 59 | 191 ± 61 | |
| ferritin [ng/mL] | 5-152 (13-277) | ↑237 ± 144 | ↑634 ± 465 | 0.006 |
| vitamin B12 [pg/mL] | 233-914 | 665 ± 198 | 647 ± 224 | 0.21 |
| folic acid [ng/mL] | 2.4-9.8 | ↑25.4 ± 7.0 | ↑23.7 ± 9.5 | 0.25 |
| serum copper [μg/dL] | 78-131 | ↓20.2 ± 18.4 | ↓6.1 ± 2.1 | 0.0005 |
| SD, standard deviation; WBC, white blood cell; MCV, mean corpuscular volume; MCH, mean cell hemoglobin; MCHC, mean corpuscular hemoglobin concentration, TIBC, total iron binding capacity; UIBC, unsaturated iron binding capacity | ||||
The anemia tended to be macrocytic (15 patients) and normochromic (2 patients) and was associated with decrease in the number of leukocytes, especially neutrophils. No tendencies toward iron, vitamin B12, or folic acid deficiencies were found, with the serum levels of these substances remaining within or above the normal ranges, and with no significant differences between the anemic and non-anemic groups. The ferritin levels were markedly higher in the anemic group (P = 0.006). Serum copper levels were markedly below the normal ranges in both groups; however, the values were especially low in the anemic group, which were found to be statistically significant compared to those in the non-anemic group (P = 0.0005).
Multivariate analysis of clinical factors between anemic and non-anemic groups
Multivariate analysis was performed with serum iron, vitamin B12, folic acid, and copper levels, which are linked to anemia onset, and also with duration of administration, for which univariate analysis showed a significant difference between the anemic and non-anemic groups (Table 4). Serum copper level was the only variable that showed a significant difference between the anemic and non-anemic groups, for which the odds ratio was 0.74 (95% Confidence Interval of 0.45 to 0.97, P = 0.014).
Table 4: Results of multivariate analysis of patient factors and hematological data relating to anemia
| Variables | Odds ratio | 95% Confidence Interval | P Value |
| Feeding Period | 1 | 1.00-1.01 | 0.13 |
| serum iron | 1 | 0.97-1.03 | 0.9 |
| vitamin B12 | 1 | 0.99-1.00 | 0.51 |
| folic acid | 0.98 | 0.83-1.15 | 0.77 |
| serum copper | 0.74 | 0.45-0.97 | 0.014 |
Serum copper cut-off value for anemia onset
The area under the ROC was 0.85 (Fig. 3), and with serum copper level below 13 μg/dL, the sensitivity was 100%, and the specificity was 59%.
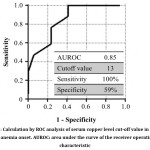 |
Figure 3: Calculation by ROC analysis of serum copper level cut-off value in relation to anemia onset. AUROC: area under the curve of the receiver operating characteristic Click here to View figure |
Time course of hematology data after oral copper supplementation
Significant improvements were found, with the hemoglobin level increasing from 6.29 ± 2.22 to 9.95 ± 1.71 g/dL (P < 0.0001). With respect to leukocyte count and serum copper level, significant improvements were also found to within normal ranges, with the leukocyte count increasing from 22.3 ± 9.1 to 59.5 ± 18.2 /μL (P < 0.0001), and serum copper level increasing from 6.1 ± 2.2 to 103.4 ± 31.3 μg/dL (P < 0.0001).
In addition, our findings suggest that five patients who showed rapid hemoglobin decreases by 50% or more within two years after initiation of dysphagia diet provision also showed higher rates for hemoglobin after two months of copper supplementation, compared to the ten patients who showed slower anemia progression (134 ± 92% vs. 51 ± 46%; P=0.055).
Discussion
Patients receiving some kind of dysphagia diet are at risk of developing copper deficiency. It is necessary to pay attention to the intake of copper for older patients receiving those dysphagia diet as staple food. According to Dietary Reference Intakes for Japanese, the estimated mean daily copper requirements for Japanese people aged 70 years or older are 0.7 and 0.6 mg for males and females, respectively.25 With respect to dysphagia diets, formulations are classified as either foods or pharmaceuticals, and vary considerably in trace element content.26,27 For example, the copper content of dysphagia diet A is 0.03 mg per pack. In Japan, dysphagia diet is provided for older patients who cannot eat normal meals in order to prevent aspiration, ensure caloric intake and restore or maintain pleasure of eating. Additionally, most Japanese older patients are physically small and their necessary calorie intakes are low, so they can live for many years on dysphagia diet alone. The subjects of the present study had impaired swallowing function, and their diets therefore consisted primarily of dysphagia diet A, which can more safely be taken orally compared to normal food. However, our results demonstrate that dysphagia diet A resulted in copper deficiency. At this hospital, body weight changes are monitored as indices of nutritional status; however, no body weight decreases were found after initiation of dysphagia diet A provision; therefore, nutrient intake was considered to be favorable, which resulted in their diets consisting mainly of dysphagia diet A for extended periods. It is therefore recommended that monitoring of nutrient intake should include periodic reassessment of each type of nutrient, in addition to total calories.
The normal range for serum copper level is 80 to 130 μg/dL, and anemia does not develop until the copper level is very low; however, it is thought that once anemia has developed, the hemoglobin level decreases rapidly.9,10,21 In this study, the serum copper levels in patients with long-term dysphagia diet A provision had in all cases decreased below the normal range, and, in particular, in cases who developed anemia, it decreased to approximately 10 μg/dL. Multivariate analysis of clinical factors between anemic and non-anemic groups showed that serum copper level was the only variable that showed a significant difference. Based on this finding, the possible cause of anemia associated with dysphagia diet provision could be copper deficiency. In addition, multivariate analysis of the time from provision initiation until deficiency onset clearly showed that this was not an independent risk factor, suggesting that anemia can develop even with only a brief period of dysphagia diet administration. In this study, three cases showed higher decrease rates for hemoglobin after several months of administration, so it is recommended that attention and care are necessary regardless of the intake period.
Copper is an essential trace metal that is required for the catalysis of several important cellular enzymes. Humans express about a dozen cuproenzymes that require copper to function. Anemia is true for one of the most common clinical features, but the precise molecular mechanisms are unknown for most of the salient features of human copper deficiency.28,29 Apart from anemia, no clear clinical findings suggesting copper deficiency have been observed in this study. The mechanisms of anemia onset from copper deficiency include the following, although numerous points remain to be elucidated:9-11,28,29
- Iron transport disorder: Ceruloplasmin is decreased, leading to lower activity of ferroxidase, which binds iron to transferrin.
- Heme synthesis disorder: The activity of the copper-containing enzyme cytochrome C oxidase is decreased, resulting in disorders of iron reduction.
- Decreased erythrocyte life span: The activity of the copper-containing enzyme superoxide dismutase is decreased, preventing removal of free radicals from the erythrocyte membrane.
The ferritin levels were markedly higher in the anemic group, suggesting disorders of iron utilization caused by copper deficiency. Individual differences in the activities of these enzymes may also affect the timing of anemia onset.9-11,28,29 It is necessary to bear in mind that, if certain symptoms such as primarily macrocytic anemia develop in patients provided with dysphagia diet for extended periods, they may have copper-deficiency anemia.
In terms of hematological characteristics, copper-deficiency anemia is macrocytic or normocytic, and normochromic, and is commonly associated with decreased leukocyte count but normal platelet count.9,10,21 In this study, this typical blood condition was observed in patients with anemic group. The syndromes that enable differential diagnosis of macrocytic anemia include megaloblastic anemia caused by vitamin B12 or folic acid deficiency), myelodysplastic syndrome, aplastic anemia, hypothyroidism-related anemia, liver-disease-related anemia, hemolytic anemia, and anemia involving continuous hemorrhage.30,31 Particularly in older people, numerous causative factors are involved, including drug-induced hematopoietic suppression, chronic wasting diseases such as latent malignancies and infections, and impaired renal function, making differential diagnosis of anemia difficult, and care is therefore needed in this respect.32,33
The current study has several limitations that must be acknowledged. Clinically, it is difficult to grasp the daily intake of the trace elements for every patient, because they can be taking small snacks sent by their families in between hospital meals. Biochemically, it is difficult to explain why anemia does not develop in all patients with low serum copper level. There could be a hereditary factor, but the details are unclear. Statistically, sample size of this study is small, so it is necessary to examine the generalizability of the finding of this study. From an ethical point of view, intervention study that puts a burden on older patients is difficult, and so studies that can utilize existing data is desirable. In Japan, it will become possible to link the anonymized national big data of medical and long-term care on an individual basis, and be made available for researchers to use and analyze.34 Studies using such a big data may be a future solution. In any case, further research is almost certainly necessary.
As the advantage of this study, the results of analysis brought one change in the corporate stance that produces dysphagia diet A. At the time of our investigation, the product catalog described the ingredients of dysphagia diet A as containing “a well-balanced mixture of vitamins and minerals”, and there were no warnings about trace element deficiency as precautions for use. After we contacted the company responsible about the copper deficiency anemia that we observed, the content of the catalog was revised as “a well-balanced mixture of proteins, lipids and carbohydrates”. Furthermore, it was stated how one should be careful about levels of trace elements such as copper and zinc in the precautions for use. In addition, anemia was improved rapidly by copper supplementation without change of the staple food in this study. Since copper-deficiency anemia caused by dysphagia diet is reversible, it is essential to be aware of the potential for copper deficiency and the resulting anemia in order to respond to copper-deficiency anemia. If it is not fully understood that not only patients undergoing long-term intravenous nutrition or tube feeding but also patients who can be fed orally have the potential to develop copper-deficiency anemia, it is difficult to identify the cause of this condition and treat it. Therefore, it is recommended that the personnel at medical institutions involved in long-term management of older patients need be aware that mere repetition of blood transfusions must be avoided with patients with anemia of unknown cause.
Conclusions
Not just the patients receiving intravenous nutrition but also those receiving dysphagia diet are at risk of developing copper deficiency anemia. Copper deficiency, in particular, is suspected in all older patients who are prescribed this type of diet. Therefore, copper supplementation might be recommended , and care is required in this respect.
Funding
The author(s) received no financial support for the research, authorship, and/or publication of this article.
Conflict of Interest
The authors do not have any conflict of interest.
References
- Warnecke T, Dziewas R, Wirth R, Bauer JM, Prell T. Dysphagia from a neurogeriatric point of view: Pathogenesis, diagnosis and management. Z Gerontol Geriatr. 2019;52(4):330-335.
- Sura L, Madhavan A, Carnaby G, Crary MA. Dysphagia in the elderly: management and nutritional considerations. Clin Interv Aging. 2012;7:287-98.
- Jardine M, Miles A, Allen JE. Swallowing function in advanced age. Curr Opin Otolaryngol Head Neck Surg. 2018;26(6):367-374.
- Nawaz S, Tulunay-Ugur OE. Dysphagia in the Older Patient. Otolaryngol Clin North Am. 2018;51(4):769-777.
- Christmas C, Rogus-Pulia N. Swallowing Disorders in the Older Population. J Am Geriatr Soc. 2019. (doi: 10.1111/jgs.16137. [Epub ahead of print])
- Harraki B, Guiraud P, Rochat MH, Alary J, Favier A. Interactions related to trace elements in parenteral nutrition. Pharm Acta Helv. 1995;70(4):269-78.
- Sriram K, Lonchyna VA. Micronutrient supplementation in adult nutrition therapy: practical considerations. JPEN J Parenter Enteral Nutr. 2009;33(5):548-62
- Chan LN, Mike LA. The science and practice of micronutrient supplementations in nutritional anemia: an evidence-based review. JPEN J Parenter Enteral Nutr. 2014;38(6):656-72.
- Myint ZW, Oo TH, Thein KZ, Tun AM, Saeed H. Copper deficiency anemia: review article. Ann Hematol. 2018;97(9):1527-1534.
- Kurasaki M, Saito T. Copper transport and metabolism. Nihon Rinsho. 2016;74(7):1103-10.
- Hordyjewska A, Popiołek Ł, Kocot J. The many “faces” of copper in medicine and treatment. Biometals. 2014;27(4):611-21.
- Collins JF, Klevay LM. Copper. Adv Nutr. 2011;2(6):520-2.
- Halfdanarson TR, Kumar N, Li CY, et al., Hematological manifestations of copper deficiency: a retrospective review. Eur J Haematol. 2008;80(6):523-531.
- Kumar N. Copper deficiency myelopathy (human swayback). Mayo Clin Proc. 2006;81(10):1371-1384.
- Desai V, Kaler SG. Role of copper in human neurological disorders. Am J Clin Nutr. 2008;88(3):855S-858S.
- Prohaska JR. Role of copper transporters in copper homeostasis. Am J Clin Nutr. 2008;88(3):826S-829S.
- da Silva FJ, Williams RJ. Copper: Extracytoplasmic oxidases and matrix formation. In: The biological chemistry of the elements: The inorganic chemistry of life (da Silva FJ, Williams RJ, eds), p388-399. Clarendon Press, Gloucester, 1991.
- Harris ED. Copper. In: Handbook of nutritionally essential mineral elements (O’Dell BL, Sunde RA, eds), p231-273. Marcel Dekker, New York, 1997.
- Livingstone C. Review of Copper Provision in the Parenteral Nutrition of Adults. Nutr Clin Pract. 2017;32(2):153-165.
- Forbes GM, Forbes A. Micronutrient status in patients receiving home parenteral nutrition. Nutrition. 1997;13(11-12):941-4.
- Chen CC, Takeshima F, Miyazaki T, et al., Clinicopathological analysis of hematological disorders in tube-fed patients with copper deficiency. Intern Med. 2007;46(12):839-44.
- Saito K, Tani R, Nakagaki M, et al., “Engeshōgai ni tomonau dōketsubōseihinketsu no 1 shōrei” [A case report of copper deficiency anemia associated with dysphagia]. Medical Journal of Nishio Municipal Hospital. 2013;24(1):6-7 (in Japanese).
- Balducci L. Anemia, fatigue and aging. Transfus Clin Biol. 2010;17(5-6):375-81.
- DeMaeyer EM, Dallman P, Gurney JM, et al., Preventing and controlling iron deficiency anaemia through primary health care. In: A guide for health administrators and programme managers, p26. World Health Organization, Geneva, 1989.
- The Ministry of Health, Labour and Welfare. Committee report for Dietary Reference Intakes for the Japanese version 2015. The Ministry of Health, Labour and Welfare. 2014. http://www.mhlw.go.jp/file/05-Shingikai-10901000-Kenkoukyoku-Soumuka/0000042638.pdf Accessed 23 Aug 2019
- Inoue M. Dysphagia Rehabilitation in Japan. J Nutr Sci Vitamino 2015;61 Suppl:S72-3.
- Watanabe E, Yamagata Y, Fujitani J, et al., The Criteria of Thickened Liquid for Dysphagia Management in Japan. Dysphagia. 2018;33(1):26-32.
- Prohaska JR. Impact of copper deficiency in humans. Ann N Y Acad Sci. 2014;1314:1-5.
- Scheiber I, Dringen R, Mercer JF. Copper: effects of deficiency and overload. Met Ions Life Sci. 2013;13:359-87.
- Green R, Dwyre DM. Evaluation of Macrocytic Anemias. Semin Hematol. 2015;52(4):279-86.
- Green R, Datta Mitra A. Megaloblastic Anemias: Nutritional and Other Cause. Med Clin North Am. 2017;101(2):297-317.
- Patel KV. Epidemiology of anemia in older adults. Semin Hematol. 2008;45(4):210-7.
- Berliner N. Anemia in the elderly. Trans Am Clin Climatol Assoc. 2013;124:230-7.
- Ministry of Health, Labour and Welfar [homepage on the Internet]. Tokyo: [updated 2018 November 16; cited 2018 May 16]. Available from: https://www.mhlw.go.jp/stf/shingi2/0000148301_00002.html. Accessed August 22, 2019.
Accepted on: 12/12/2019
Second Review by: Dr. LUZVIMINDA GABATO-RIVERA Phillippines
Final Approval by: Prof. Suhad Maatoug Bahijri


Web of Science Coverage
Emerging Sources Citation Index (ESCI)
2024 Journal Impact Factor: 1.1
Scopus Journal Metrics
CiteScore 2025: 2.6
CiteScore Details
Sustainable Nutrition: Food Systems, Nutrient Retention, and Public Health Impact
![]()
This journal is a member of, and subscribes to the principles of, the Committee on Publication Ethics (COPE)


