Profiling of Total Residual Contaminants Migrating from Philippine-based Polyethylene Packaging to Fermented and Alcoholic Foods
 , , 2, Elyson Keith Ponce Encarnacion1*, Agaseve Famanilay Del Rosario1, Josefino Antonio Tapang Mendoza1, Anne Cardoza Alcantara1, Winnie Pagaduan Alejandro1 and Rizel Marie San Miguel Ting1
 1Department of Science and Technology – Industrial Technology Development Institute (DOST-ITDI), Bicutan, Taguig City, Metro Manila, Philippines.
2Pamantasan ng Lungsod ng Maynila, Gen Luna Cor. Muralla St, Intramuros, Manila City, Metro Manila, Philippines.
Corresponding Author E-mail: psrtl@itdi.dost.gov.ph
DOI : http://dx.doi.org/10.12944/CRNFSJ.14.1.32
Download this article as:
![]()
Fermented and alcoholic foods in the Philippines were traditionally developed as naturally preserved products that are easily repackaged and sold in single-use polyethylene (PE) bags. However, these foods contain organic acids that enhance the migration of chemical constituents from the PE packaging. Although this is widely used throughout the country, local data on the migration of total residual contaminants (TRCs) from PE into fermented and alcoholic foods remain limited. This study is a modification of the Japan External Trade Organization (JETRO) method, as recommended by Food and Drug Administration (FDA) Philippines, to determine the TRCs migrating from monolayer PE samples into 20% (v/v) ethanol food simulant at 60 °C for 30 minutes. The validated method exhibited a detection limit of 0.96 mg/L (0.11 mg/dm²) and demonstrated acceptable repeatability and reproducibility, with precision values within the acceptable criteria (%RSD ≤ 11%) across low, mid, and high residue concentration levels. Furthermore, the profiling of fifteen commercially available PE samples revealed TRC concentrations ranging from 1.29 to 11.24 mg/L, which were all below the regulatory limit set by JETRO (30 mg/L) and Commission Regulation (EU) No 10/2011 (10 mg/dm2). Statistical analysis indicated no significant difference in TRC migration between low-density (LDPE) and high-density (HDPE) polyethylene samples, suggesting limited influence of polymer crystallinity under the conditions tested. While the findings provide scientific data for strengthening national policies, the effects of increasing alcohol concentrations, using other types of food products, and varying temperature and contact time conditions on TRC migration require follow through investigations.
KEYWORDS:Alcoholic Foods; Chemical Migration; Fermented Foods; Food Packaging; Polyethylene; Total Residual Contaminants
Introduction
Fermented foods in Asia are traditionally produced from rice, grains, vegetables, and fish as primary substrates. Consequently, the Philippines has a wide range of traditionally fermented foods that rely entirely on the microorganisms of its raw materials to enhance food preservation, quality, and functionality.1 These wide range products include, but are not limited to, tapuy (rice wine), sukang tuba (coconut vinegar), lambanog (fermented coconut sap), and fermented vegetable and fish products such as atchara and bagoong, respectively.2 Among these products, one of the most widely known and consumed across all regions of the Philippines is bagoong, a salty fermented fish paste that was made from small fishes like dilis (Stolephorous spp.) and tamban (Sardinella fimbriata). Its fermentation involves draining the fish, mixing with salt, and storing it under warm conditions (40°C) for several months or longer until the characteristic flavor and aroma develop.3 In addition, lactic acid bacteria (LAB) plays a role in natural biopreservation by controlling spoilage microorganisms through the production of peroxidases, organic acids, and ethanol as secondary fermentation by-products.4 Beyond fermented foods, European Food Safety Authority (EFSA), recommends 20% (v/v) ethanol as a food simulant for alcoholic beverages, soft drinks, coffee, tea, energy drinks, and foods with significant organic content, including chocolate-coated products to mimic foods containing organic constituents that makes the food more lipophilic. Several Filipino dishes that fall under this category are neutral-pH broths and sauces with dissolved fats and organic components like tinola (ginger-based chicken stew), bulalo (beef shank soup), lomi (thick egg noodle soup), and arroz caldo (chicken rice porridge) which are commonly prepared fresh and sold as ready-to-eat meals. These foods are frequently purchased from carinderyas (small eateries) and packed for takeaway in PE bags, resulting in direct contact between hot, aqueous–organic food matrices and plastic packaging. These foods are commonly repackaged for local consumption practices and sold in single-use packaging (SUP) like PE bags, reflecting the Filipino tingi (retail) system in which foods or viands are purchased in small quantities. This practice is prevalent in wet markets and small retail outlets, resulting in prolonged direct contact between ethanol-containing fermented food products and their plastic packaging.5
Food packaging is essential for preserving food quality, prolonging shelf life, and ensuring consumer safety as it protects the food from external contaminants such as dust and insects prior to consumption.6,7 Among the various polymeric materials, PE remains one of the most extensively produced and utilized plastics worldwide. The global demand for PE has increased substantially over recent decades, with worldwide production reaching approximately 105 million tons by 2019.8 This widespread use is largely attributed to PE’s mechanical strength, durability, flexibility, chemical resistance, barrier properties, low cost, and ease of processing, which collectively support its application in food packaging systems.9
Polyethylene can be classified into four: cross-linked polyethylene (XLPE), high-density polyethylene (HDPE), low-density polyethylene (LDPE), and linear low-density polyethylene (LLDPE). Despite its general classification as a chemically inert material due to its low polarity and absence of highly reactive functional groups that limit strong chemical interactions,10-12 PE-based materials contain various additives intentionally incorporated during manufacture. It also undergoes degradation over time, leading to the formation of microplastics that can contaminate food and potentially pose risks to human health. Plastics may contain intentionally added substances (IAS), including antioxidants, stabilizers, and lubricants, which are essential for improving polymer performance, durability, and thermal stability. However, these substances may migrate from the polymer into food during use.13 Moreover, non-intentionally added substances (NIAS) are the degradation products, impurities, or reaction by-products formed during polymer synthesis, processing, or recycling, such that under certain circumstances, these substances may also migrate into food.14
The transfer of chemical substances from packaging materials into food is referred to as overall migration. The process represents the cumulative transfer of all non-volatile substances under defined testing conditions.15 While PE is often regarded as a low-migration polymer, its behavior is influenced by factors such as contact time, temperature, surface area-to-volume ratio, and the chemical nature of the fermented and alcoholic foods.16 Foreign studies on the overall migration of chemical substances from PE and other food contact materials (FCMs) into food simulants revealed that factors such as type of product (e.g., fatty/oily, watery, alcoholic, etc.) and temperature significantly influence the amount of residues often quantified through gravimetric methods.17 Although there were local studies on overall migration, these studies focused more on evaluating the total UV-absorbing contaminants (TACs) that transfer from PE and polypropylene (PP) FCMs to oily and aqueous foods.18-20 Despite these locally available materials, there are currently no published studies that specifically address the migration of TRCs from PE packaging materials into fermented and alcoholic foods under controlled experimental conditions. This lack of localized data represents a significant knowledge gap, particularly considering the common practice of storing fermented and alcoholic foods in PE bags and potential health implications associated with exposure to chemical migrants, including compounds with suspected endocrine-disrupting properties.21,22
TRCs refer to the sum of the masses of non-volatile and semi-volatile substances that migrate from FCM to a product and are collectively quantified using gravimetric methods. Instead of specific contaminants, TRCs represent all possible migrating contaminants, including plastic additives, degradation products, and low molecular weight polymer constituents that remain after solvent evaporation. International regulatory frameworks governing FCMs are guided by JETRO, which sets a regulatory limit of 30 mg/L, and by Article 12 of Commission Regulation (EU) No. 10/2011, which stipulates that FCMs must not release substances into food simulants exceeding 10 mg of total constituents per dm² of food-contact surface (10 mg/dm²).23 In contrast, the Philippines is still developing comprehensive policies and specific regulatory limits for FCMs. Even though the FDA Philippines Circular No. 2022-011 recommends the use of JETRO testing methods, these guidelines are implemented primarily for voluntary certifications rather than as mandatory regulatory requirements.24 Moreover, its enforcement and routine monitoring remain limited, particularly in small-scale retail outlets and wet markets where most FCMs are rarely assessed. Because of this, there is definitely a need for locally generated scientific data to strengthen regulatory frameworks and craft better policies for implementation.
To address these gaps, the study aims to validate the FDA Philippines’s recommended method for determining TRCs migrating from PE to 20% ethanol food simulant under laboratory-based conditions, profile locally and commercially available PE bags used as packaging for alcoholic or fermented food products, and provide scientific evidence and recommendations for the improvement of the existing national guideline on plastic food packaging in the Philippines.
Materials and Methods
Sample Collection and Identification
Commercially available plastic bags, colloquially known as plastic labo (hazy) or plastic yelo (ice), were purchased from various retail outlets, wet markets, and other suppliers across Mega Manila. Sampling was conducted in fifteen (15) cities and one (1) municipality within the National Capital Region (NCR), as well as one (1) municipality in the province of Bulacan, to represent commonly used plastic FCMs across different locations. All samples were assigned with unique codes based on brand and collection location to ensure confidentiality among the retailers and manufacturers.
All collected samples were stored in clean and dry containers under controlled conditions within the Packaging Safety Laboratory (PSL) of the Department of Science and Technology Industrial Technology Development Institute (DOST-ITDI) Packaging Technology Division (PTD) to prevent external contamination prior to the analysis. Furthermore, polymer identification and confirmation of the plastic materials were performed using the Shimadzu IR-Prestige-21 Fourier Transform Infrared Spectroscopy with Attenuated Total Reflectance (FTIR-ATR). The obtained spectra were compared with reference spectra from a library database to verify the polymer composition of each sample prior to extraction and gravimetric determination. Moreover, the samples confirmed as polyethylene only were supported by existing literature to be further classified as either LDPE or HDPE based on the intensity of their peaks at specific regions in the FTIR-ATR spectra.
Method Selection
The experimental method used in this study was the evaporation residue test based on JETRO (2009) method. This was selected because preliminary findings found that the extraction conditions prescribed in JETRO (2009) and the United States Code of Federal Regulations (US CFR), specifically 21 Code of Federal Regulations (CFR) Part 177, yield significantly different results.25 Although both methods are recommended and cited by the FDA Philippines, the observed discrepancies highlight that different extraction conditions are required for the determination of TRCs and TACs. A single extraction method cannot be applied to both tests without compromising analytical relevance because it was found that the US CFR method is more appropriate for TACs determination, while the JETRO 2009 method is specifically suited for assessing TRCs.25,26 Therefore, validation of the JETRO 2009 method is necessary to ensure its applicability and reliability for quantifying and profiling TRCs migrating from FCMs to fermented and alcoholic foods.
Preliminary Screening of Selected Samples
A total of twenty-three (23) plastic bag samples, representing fourteen (14) distinct brands obtained from seventeen (17) different collection locations, were subjected to initial assessment of residue content. Both the measured residue concentrations (mg/L) and the relative standard deviations (% RSD) were considered to ensure reliability and repeatability of the data.27 Based on the range of the amounts of residues obtained, samples were selected to represent the low, mid, and high-level concentrations for the subsequent method validation process.
Sample Preparation
The plastic samples, cut into 5 cm × 10 cm, were wiped with lint-free tissue to remove surface contaminants. Each sample was weighed in an analytical balance (Mettler Toledo) prior to being placed in a 250 mL beaker. Meanwhile, an aluminum foil was used as an inert cover to prevent physical contaminants from settling and contributing to the recorded mass during the course of the experiment.
A 100 mL of 20% (v/v) ethanol solution, freshly prepared from Dae-Jung absolute ethanol (99.9%) and distilled water, was measured and added to the beakers to fully immerse the plastic samples. The aluminum-covered beakers were then placed in an incubator (Memmert) and subjected to extraction at 60°C for 30 minutes. After heating, the plastic films were immediately removed using tweezers, and the remaining extracts were allowed to cool to room temperature in a fume hood prior to evaporation. A 50 mL aliquot was transferred into corresponding pre-weighed 50 mL beakers. These new set of beakers were initially dried in a laboratory oven (Labtech LDO-150N) at 105 °C for two (2) hours and subsequently cooled for one (1) hour, a process that was repeated until a constant weight (0.00050 g.) was obtained. The 50 mL beakers containing the aliquots were then placed on a hotplate to allow complete volatilization of ethanol. After evaporation, the beakers with possible residues were re-weighed to a constant weight following the same procedure of drying, and the results were recorded and analyzed. Each sample was analyzed in triplicates.
Method Validation
Limit of Detection (LOD) and Limit of Quantification (LOQ)
The limit of blank (LOB) was not performed due to the expected near-zero responses and the dominance of instrumental noise and environmental factors at these signal levels. Instead, the sample exhibiting the lowest residue concentration from the preliminary screening results was used to determine the limit of detection (LOD) is the lowest concentration of migrating residue that can be accurately differentiated from analytical noise, and the limit of quantification (LOQ), the lowest concentration that can be measured with acceptable accuracy and precision.28,29 A total of eight (8) replicate measurements, along with two (2) reagent blanks, were analyzed to ensure consistency. The average concentrations of the duplicate blanks were subtracted to each replicate measurement as a form of correction. Based on the Eurachem guidelines, equation 1 was used to calculate and the LOD and LOQ were calculated using equations 2 and 3, respectively:
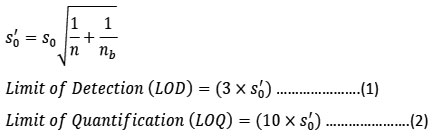
where is the corrected standard deviation obtained from the formula, is the standard deviation, n is the number of replicates used in routine analysis, and nb is the number of blank samples used during regular testing.
Repeatability and Intermediate Precision
At each concentration level, variability of measurements was evaluated using seven (7) replicates of the sample chosen from the screening and accompanied by two (2) reagent blanks. For repeatability, the average residue concentration, standard deviation, and relative standard deviation (%RSD) were calculated to assess the method’s ability to yield consistent results under defined experimental conditions.30 On the other hand, a second analyst, operating within the same laboratory, performed the same procedure on a different set of days to determine the intermediate precision. The analysts’ pooled mean residue concentration, pooled standard deviation, and pooled %RSD were computed to check the laboratory’s capability to demonstrate consistency of results despite variations in technical personnel, dates of analyses, and to some extent, instruments.31 These parameters were further used to establish the acceptable criteria and assess the acceptability of the method with respect to between-laboratory precision or reproducibility using the Horwitz ratio (HorRat) as shown in equations 4 and 5,

where C is the concentration, expressed as mass fraction, RSDR in percent was the variation calculated from the data, and PRSDR, as the variation predicted from the Horwitz equation, which determines whether results at the low, mid, and high concentration levels are acceptable and reproducible at the 95% confidence level.32
Sample Profiling and Statistical Analysis
A total of fifteen (15) samples representing different brands of plastic samples collected from various locations within Mega Manila were analyzed using the validated method. The results obtained from the sample profiling were compared and evaluated against the limits set by JETRO, as followed by the FDA Philippines and other pertinent international regulations. Furthermore, the influence of crystallinity (as dictated by polymer classification) on the obtained residue concentration was evaluated using appropriate statistical tools such as Shapiro-Wilk test for normality, F test for equal variance, and independent two sample t-test.
Results
Sample Collection and Identification
The FTIR-ATR analysis confirmed that all samples collected within Mega Manila were predominantly PE (as in Figures 1 and 2). Of the fifteen (15) commercial brands, 60% were classified as HDPE. Meanwhile, the remaining samples (40%) were compared with existing literatures and were verified to be LDPE.
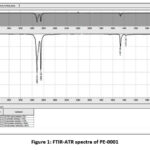 |
Figure 1: FTIR-ATR spectra of PE-0001 |
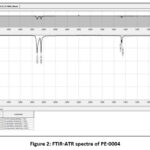 |
Figure 2: FTIR-ATR spectra of PE-0004 |
Both HDPE and LDPE spectra exhibited peaks at approximately 2914 cm⁻¹ and 2847 cm⁻¹ (asymmetric and symmetric CH₂ stretching vibrations) along with bands at 1470 cm⁻¹ (CH₂ bending) and 718 cm⁻¹ (CH₂ rocking), which are consistent with the fingerprint region of polyethylene.33 The primary distinction between HDPE and LDPE lies in the variation in absorption intensities within the regions 1450–1480 cm⁻¹ and 2875–2980 cm⁻¹, as well as the presence or absence of bands in the 1349–1390 cm⁻¹ range.34
Based on the FTIR-ATR results (Figures 1 and 2), a significant difference was observed in the CH symmetric region. PE-0001 displayed a distinct peak at approximately 1370 cm⁻¹, which was absent in PE-0004. This band corresponds to the bending vibration of the –CH₃ terminal group, indicating the presence of short- and long-chain branching, which classifies the sample in Figure 1 as LDPE. In contrast, the absence of this peak in Figure 2 suggests a more linear polymer structure with minimal branching like HDPE.35
Preliminary Screening
The preliminary screening of the twenty-three (23) PE samples revealed an average TRC concentration range of 1.20 to 17.1 mg/L, with %RSD values that fall between 1.81 to 79.3% (Table 1).
Table 1: Preliminary Screening Results of PE Samples from Different Brands and Locations
|
Sample Code |
Polymer Composition | Location | Average Residue, mg/L (n=2) |
%RSD |
|
PE-0001 |
LDPE | San Ildefonso, Bulacan | 3.60 | 66.8 |
| Taguig City | 4.90 |
17.3 |
||
|
PE-0002 |
LDPE | Pasig City | 4.00 | 17.7 |
| PE-0004 | HDPE | Manila City | 4.90 |
46.2 |
|
PE-0005 |
LDPE | Makati City | 1.20 | 35.4 |
| PE-0006 | LDPE | Quezon City | 5.50 |
25.7 |
|
Municipality of Pateros |
2.10 |
26.9 |
||
|
PE-0007 |
HDPE | Malabon City | 2.40 | 29.5 |
| PE-0008 | LDPE | Paranaque City | 8.50 |
3.3 |
|
Mandaluyong City |
7.00 |
26.3 |
||
|
PE-0009 |
HDPE | Valenzuela City | 3.20 |
57.5 |
|
PE-0010
|
HDPE | Valenzuela City | 7.80 | 1.81 |
|
Caloocan City |
4.40 | 6.40 | ||
| San Ildefonso, Bulacan | 7.20 |
47.1 |
||
|
Marikina City |
2.90 | 14.6 | ||
| Las Piñas City | 17.1 |
11.6 |
||
|
Navotas City |
7.80 |
12.7 |
||
| PE-0011 | HDPE | Muntinlupa City | 2.40 |
35.4 |
|
PE-0012 |
HDPE | Pasig City | 12.2 | 6.40 |
| PE-0013 | HDPE | Caloocan City | 11.4 |
47.1 |
|
Pasay City |
4.10 | 79.3 | ||
| PE-0014 | HDPE | Valenzuela City | 9.70 |
33.5 |
|
PE-0015 |
HDPE | Makati City | 4.90 |
2.90 |
Among the four samples that had the lowest TRC concentrations: PE-0005 (1.20 mg/L, 35.4%), PE-0006 (2.10 mg/L, 26.9%), PE-0007 (2.40 mg/L, 29.5%), and PE-0011 (2.40 mg/L, 35.4%), PE-0006 from the Municipality of Pateros was selected for method validation at the low concentration level because it demonstrated the lowest variability in measurements.
Meanwhile, among those that exhibited the highest average residue concentrations: PE-0010 (17.1 mg/L, 11.6%), PE-0012 (12.2 mg/L, 6.40%), and PE-0013 (11.4 mg/L, 47.1%), PE-0012 from Pasig City was selected for the same reason.
Moreover, to ensure adequate representation across the concentration range, PE-0010 from San Ildefonso, Bulacan, with an average residue concentration of 7.20 mg/L (47.1%), was selected to represent the mid-level concentration range.
Overall, the results imply that while the method is capable of detecting residue migration across a broad concentration range, the large dispersion in %RSD values highlight the need to determine the optimum environmental conditions and assess its fitness-for-purpose.
Method Validation
Limit of Detection and Quantification
PE-0006 from the Municipality of Pateros was used to calculate the LOD and LOQ values (Table 2). The was computed using equation 1, where n was decided to be 3, being acceptable and sufficient in most experiments,36,37 and as 2.
Table 2: LOD and LOQ Results
|
Result, mg/L |
Average Residue, mg/L | SD |
% RSD |
||
|
LOD |
0.96 | 3.50 | 0.35 | 0.32 |
10.1 |
|
LOQ |
3.20 |
The maximum allowable limit (MAL) set by the European Commission for overall migration is 10 mg/dm², with the acceptable LOD required to be no greater than 10% of the MAL (i.e., 1 mg/dm²).23 Applying the same criteria for the JETRO regulatory limit of 30 mg/L, the acceptable LOD should be no greater than 3 mg/L. The established LOD of 0.96 mg/L (0.11 mg/dm²) did not exceed the abovementioned regulatory criteria.
Repeatability and intermediate precision
The results of the repeatability assessment conducted by two analysts on different days are summarized in Table 3. While the %RSDs of both analysts are relatively close, a slightly higher variability was observed from the results obtained by Analyst B compared with Analyst A for all levels. This confirms that Analyst A, having trained longer, was able to demonstrate more repeatable results as compared to Analyst B. Also, the method is easy to follow for other analysts such as Analyst B, having been taught by Analyst A. Moreover, this suggests that other analysts and laboratories may be capacitated with this service to strengthen food and packaging safety in the Philippines.
Table 3: Repeatability results of two analysts at three levels
|
Analyst |
Temperature
range, oC |
%RH
range |
Days of analysis | Level | Average Residue, mg/L | SD |
%RSD |
|
|
Analyst A |
23.2 – 25.2 | 50.9 – 59.7 | 3 | Low | 4.90 | 0.49 | 10.0 | |
|
22.4 – 24.6 |
48.0 – 54.0 | 3 | Mid | 6.76 | 0.63 |
9.32 |
||
| 22.6 – 26.5 | 49.0 – 63.7 | 3 | High | 10.7 | 0.59 |
5.45 |
||
|
Analyst B |
23.7 – 26.5 | 51.4 – 58.6 | 5 | Low | 2.49 | 0.25 | 10.2 | |
|
23.7 – 26.4 |
42.4 – 61.0 | 3 | Mid | 6.46 | 0.63 |
9.75 |
||
| 23.7 – 25.9 | 49.4 – 59.0 | 3 | High | 12.8 | 0.74 |
5.76 |
||
The %RSDs show a consistent trend for both analysts, where increasing variability was observed as concentration decreases and vice versa. This trend is consistent with the general behavior described by the Horwitz curve, which states that the RSD decreases as the analyte concentration increases, reflecting the inherent challenge of achieving precise measurements at trace levels.32 Differences in analyst handling, environmental factors such as temperature and humidity, and days of conduct of experiments, may further amplify variability at low concentrations, whereas their impact is less pronounced at higher levels.38
To verify the method’s precision that accounts for technical skill, environmental effects, and time, the data from both analysts were pooled, with the combined average residue concentrations and %RSD values presented in Table 4.
Table 4: Results of Intermediate Precision
| Level | Average Residue, mg/L | Pooled average, mg/L | Pooled SD | Pooled % RSD | |
| Analyst A | Analyst B | ||||
| Low | 4.90 | 2.49 | 3.70 | 0.39 | 10.1 % |
| Mid | 6.76 | 6.46 | 6.61 | 0.63 | 9.53 % |
| High | 10.7 | 12.8 | 11.8 | 0.67 | 5.61 % |
The results shows that the pooled %RSD increased as the average residue concentration decreases, indicating consistent method performance across the working range. In addition, the values prove that despite variations in room temperatures and relative humidity values which likely influenced the mass,39 and days of conduct of experiments (i.e., spanning 3 to 5 days to complete a set of ten replicates), the method proves to be resilient with respect to environmental conditions and time. Nevertheless, the results fell within the expected precision criteria established by AOAC International (2016), which recommend %RSD values of up to approximately 7.3% for the high level, and 11% for the low analyte concentrations levels.30
Table 5: Result of Horwitz Ratio Assessment
| Level | Experimental % RSD | Predicted % RSD | Horwitz Ratio (HorRat) | Remarks |
| Low | 10.1 % | 13.1 % | 0.77 | Repeatable |
| Mid | 9.53 % | 12.0 % | 0.79 | Repeatable |
| High | 5.61 % | 10.7 % | 0.52 | Repeatable |
All computed HorRat values (Table 5) were found to be within the range of 0.5 to 2.0 for Single-Laboratory Validation (SLV), as described in AOAC International Appendix K.40 These results indicate that repeatability and reproducibility of the method is acceptable across all tested concentration levels. Moreover, the values were found to be below 1, suggesting relatively good precision regardless of replicate, analyst, or date of conduct of the experiment.32 Accounting for all contributions to the method’s precision, the acceptance criteria to be used in profiling are summarized in Table 6.
Table 6: Established acceptance criteria for single extraction using 20% (v/v) ethanol simulant
| Average Residue Concentration, mg/L | % RSD |
| 0.96 Cx 3.70 | 10.1 |
| 3.70 Cx 6.61 | 10.1 |
| 6.61 Cx 11.78 | 9.53 |
| 11.78 Cx | 5.61 |
Sample Profiling and Statistical Analysis
The profiling of fifteen (15) PE samples from different brands using the validated method are summarized in Table 7. The TRC values ranged from 1.29 to 11.24 mg/L, where the descriptive statics shows that the mean residue concentration was 5.80 mg/L across all samples, median value was 4.64 mg/L, and the interquartile range was 5.45 mg/L (3.33–8.78 mg/L).
Table 7: Results of Profiling using Established Acceptable Criteria
| Brand | Location | Average Residue, mg/L | SD | %RSD |
| 0001 | Taguig City | 7.58 | 0.63 | 8.32 |
| 0002 | Pasig City | 4.64 | 0.20 | 4.39 |
| 0003 | Manila City | 3.33 | 0.42 | 12.5 |
| 0004 | Manila City | 4.60 | 0.42 | 9.10 |
| 0005 | Valenzuela City | 1.29 | 0.21 | 16.6 |
| 0006 | Quezon City | 4.18 | 0.44 | 10.6 |
| 0007 | Malabon City | 8.78 | 0.69 | 7.90 |
| 0008 | Mandaluyong City | 9.38 | 0.74 | 7.86 |
| 0009 | Valenzuela City | 4.18 | 0.47 | 11.3 |
| 0010 | Navotas City | 7.29 | 0.67 | 9.20 |
| 0011 | Muntinlupa City | 2.22 | 0.38 | 17.1 |
| 0012 | Pasig City | 10.5 | 0.14 | 1.30 |
| 0013 | Caloocan City | 11.2 | 0.73 | 6.50 |
| 0014 | Valenzuela City | 5.29 | 0.71 | 13.4 |
| 0015 | Makati City | 2.42 | 0.44 | 18.3 |
| Mean, mg/L | 5.80 | |||
| Median, mg/L | 4.64 | |||
| Interquartile Range, mg/L | 3.33–8.78 | |||
Compared to the pooled low average concentration (3.70 mg/L), four samples (26.7%) were below this value, while the remaining eleven samples (73.3%) were within the validated low, mid, and high concentration ranges, and none exceeded the upper limit of 11.78 mg/L. Among the samples profiled, the lowest residue level was observed in PE-0005 from Valenzuela City at 1.29 mg/L, consistent with its rank in the preliminary screening results. Whereas the highest was PE-0013 from Caloocan City at 11.24 mg/L, which is in close agreement with the preliminary screening result for the same brand and location (11.40 mg/L).
Among the profiled PE samples, 40% were not within the range of the established %RSD criteria. This deviation may be attributed to sample heterogeneity during the analytical process, which can significantly influence the variability observed between replicate measurements. The differences in analyte concentration, extractable components, or matrix characteristics may arise between replicates, leading to increased dispersion and variability.41 Importantly, all analyzed samples exhibited TRC concentrations above the LOD of 0.96 mg/L, confirming the method’s detectability relative to the samples used for fermented and alcoholic foods.
Discussion
Comparison with International Regulatory Limits
All analyzed samples were below the JETRO maximum allowable evaporation residue limit of 30 mg/L for polyethylene, as specified in the Specifications and Standards for Foods, Food Additives, etc. Under the Food Sanitation Act (Abstract) 2010.42 Similarly, none of the samples also exceeded the internationally recognized OML of 10 mg/dm² established under Commission Regulation (EU) No. 10/2011 by the EU standards. However, even though the profiling results indicated that most samples comply with established criteria, the data represent only a single-exposure scenario and does not account for cumulative human exposure arising from repeated consumption of fermented and alcoholic foods. A previous study notes that conventional migration testing may not adequately represent repeated-use applications since testing is typically performed over three consecutive cycles under worst-case time and temperature conditions.43 Additionally, diffusion-controlled systems suggests that chemical migration often decreases with repeated use due to depletion of mobile substances in the polymer matrix. However, elevated temperatures from hot filling, reheating, or washing, along with thermal and mechanical stress, may alter polymer structure and potentially increase the release of certain substances over time.43 Moreover, in Fick’s diffusion principles, molecules may move from higher concentration (packaging) to lower concentration (food). Since diffusion rates increase exponentially with temperature, and migration is correlated with the square root of time, longer contact results in greater cumulative migrant transfer.44 Experimental studies on BPA migration from polyethylene terephthalate (PET) bottles into alcoholic drinks such as beer was found to increase significantly when storage temperature was raised from refrigeration conditions (~4 °C) to elevated temperatures (~45 °C).45 Similarly, investigations on PET bottles of fermented products such as yogurt drinks reported higher BPA concentrations when temperature were increased from 60 °C to sterilization temperatures (~121 °C).46 In addition, phthalate esters have shown substantially greater migration at 40–60 °C in packaged cooking oil and mineral water compared with ambient or lower temperatures.47 Furthermore, when food undergoes temperature changes such as refrigeration followed by warming during distribution, migration does not stop at low temperatures and restart at high ones. Rather, each period of elevated temperature increases the diffusion rate and builds upon the previous migration that occurred at lower temperature, cumulatively enhancing overall migrant transfer. This is consistent with mechanistic migration modeling where time of exposure and thermal conditions are integrated to estimate total migrant uptake under real-world storage and processing conditions.48 Even though all samples were below the regulatory limits from both JETRO and EU standards, it would be a good area of study to investigate when extended contact time and temperature exposure can push migration towards or beyond such thresholds. Therefore, assessing the behavior of TRCs in local PE bags used for fermented and alcoholic foods under repeated heating and cooling cycles, as well as increasing temperatures and prolonged contact time, would provide information whether contaminant concentrations decrease or increase due to polymer degradation in chemical migration.
Variation of Results of Samples with the Same Brand from Different Locations and Vice Versa
In the preliminary screening, five (5) PE-0010 samples from Caloocan City, Marikina City, Navotas City, Bulacan, and Valenzuela City exhibited average residue concentrations between 2.90 and 7.80 mg/L. Whereas the sample from the same brand obtained from Las Piñas City showed a notably higher concentration of 17.1 mg/L. Additionally, from the profiling results, three different brands (PE-0005, PE-0009, and PE-0014) collected from the same location (Valenzuela City), also showed varying results of 1.29, 4.18, 5.29 mg/L respectively.
This deviation in results highlights the variability among samples of the same brand obtained from different locations, as well as differences observed between various brands within a single location. However, taking into account the observed data dispersion and varied contributions of interferences, average residue concentrations alone are not adequate to fully represent the migratory behavior of a given brand. Differences in residue levels among samples may be attributed to multiple factors, including thermodynamic and kinetic influences.49 The presence of organic compounds in fermented and alcoholic foods enhances the diffusion and solubility of the potential migrants. The transfer of these substances across the polymer–food interface is governed by their molecular properties, particularly size and volatility. Diffusion kinetics are strongly influenced by molecular size, with smaller molecules migrating more rapidly than larger ones due to lower steric resistance.50
Variation may be influenced by raw material differences, including polymer grade, additives, residual monomers, and impurities, which can alter migration behavior. Different polymer grades possess varying molecular weight distributions and degrees of branching, which affect crystallinity and free volume within the matrix. These structural differences can influence the diffusion coefficient of low-molecular-weight substances and consequently affect the extent of TRC migration. Additives such as plasticizers, antioxidants, stabilizers, slip agents, and processing aids may also vary in concentration depending on formulation. Residual monomers and unintended impurities originating from polymerization or compounding processes can further contribute to variability in extractable substances. Differences in these compositional factors can lead to measurable differences in migration performance between samples.
Variation of results may also be due to environmental conditions during transport, storage, and distribution, particularly temperature fluctuations that enhance molecular mobility and diffusion. Elevated temperatures increase chain mobility in polymer matrices, especially in amorphous regions, which facilitates the diffusion of substances toward the material’s surface. Repeated exposure to fluctuating temperatures may also induce microstructural changes such as partial relaxation of crystalline regions or oxidative processes, which can modify barrier properties and migration rates.51 Additionally, production methods and quality control practices can affect material structure and consequently influence migration, which depends on temperature, contact time, material properties, and food characteristics.52 Differences in extrusion parameters, cooling rates, and molding conditions can alter crystallinity, density, and internal morphology. Inconsistent quality control may also result in batch-to-batch variation in additive dispersion or residual content.51
Moreover, differences in the amount of residue transferred can also be affected by the polymer’s physical characteristics such as permeability, thickness, and surface area, which all influence diffusion pathways and barrier behavior.53 Thinner materials or those with higher permeability provide shorter diffusion paths and reduced resistance to mass transfer, potentially increasing migration levels under identical test conditions.
Assessment of TRC Migration in Polyethylene: LDPE Vs. HDPE
The various types of PE differ in molecular structure and degree of crystallinity. HDPE is more crystalline and has tightly packed polymer chains that results to slower diffusion of migrants. Meanwhile, the amorphous LDPE has branches that hinder close packing and affects faster migrant transfer.54 The FTIR-ATR spectra also reveal clear differences between LDPE and HDPE. At approximately 1460 cm⁻¹ (CH₂ scissoring) and 720 cm⁻¹ (CH₂ rocking), HDPE displays stronger peaks on the higher wavenumber side compared with LDPE, reflecting its higher crystallinity.55 This aligns with the results obtained during the confirmation of polymer composition for the analyzed samples using FTIR-ATR. More crystalline polymers tend to reduce diffusivity and enhance barrier properties because the ordered crystalline regions act as impermeable domains that restrict molecular transport, whereas amorphous regions provide continuous pathways with greater free volume that facilitate molecular mobility and increase the potential for contaminant migration.56 Previous studies have shown that migration of additives and other constituents from polymer films varies by polymer type. LDPE generally exhibits higher transfer than HDPE under similar conditions, consistent with the influence of structural differences and crystallinity on diffusivity.57
Furthermore, to evaluate whether crystallinity significantly affects TRC migration in this study, the samples were assessed using a Shapiro-Wilk test for normality (Table 8). The results indicate that both datasets were normally distributed (p > 0.05), justifying the use of parametric tests.
Table 8: Shapiro-Wilk Test For Normality Results
| Classification | n | Mean SD | w | p value ( = 0.05) | Remarks |
| LDPE | 6 | 5.06 2.94 | 0.959 | 0.935 | Normally distributed |
| HDPE | 9 | 6.28 3.34 | 0.927 | 0.484 | Normally distributed |
Since both datasets are normally distributed, the equality of variance between LDPE and HDPE datasets were subsequently assessed using the F test for equality of variances. The results indicated that there is no significant difference between the variance of LDPE and HDPE (p > 0.05) as summarized in Table 9.
Table 9: F Test For Equality Of Variance Results
| Classification | df | SD | F | p value ( = 0.05) | Remarks |
| LDPE | 5 | 2.94 | 0.800 | 0.812 | Equal Variance |
| HDPE | 8 | 3.34 |
Consequently, an independent two-sample t-test assuming equal variances was applied to compare the TRC concentrations of LDPE and HDPE samples, as the equal variances are considered acceptable. The results indicated no statistically significant difference between the TRC concentrations of the two polymer types (t = −0.720, p = 0.484), as summarized in Table 10.
Table 10: Independent Two-Sample T-Test Assuming Equal Variances Results
| Polymer Classification | Variance | Pooled variance | t stat |
p value (two-tailed) |
|
| LDPE | 8.63 | 10.2 | -0.720 | 0.484 | |
| HDPE | 11.1 | ||||
The findings indicate that, under experimental conditions, HDPE and LDPE did not produce significant differences in the overall migration of TRCs into 20% ethanol simulant. This outcome is not entirely unexpected, as other factors can outweigh the effect of crystallinity under certain conditions. Variables such as simulant composition and concentration, temperature, and contact time all influence migration kinetics and could mask the differences attributable to polymer morphology.58 It is also possible that environmental conditions prior to testing affected the polymer structure, where samples exposed to higher temperatures or longer storage periods may experience slight changes in their internal crystalline regions. Additionally, the alcohol itself could interact with the polymer surface or penetrate slightly into amorphous regions. Either one of these surface interactions can potentially alter crystallinity during the contact period, although the effect is generally limited at moderate ethanol concentrations.59 To better isolate the effect of polymer crystallinity, future experiments could use fresh samples directly from the manufacturer, minimizing pre-exposure to variable temperatures or humidity. Moreover, adjusting the ethanol concentration, exploring different simulants, and varying contact times could amplify differences in migration behavior associated with polymer structure, providing a clearer assessment of how morphology and crystallinity influence overall migration.
Conclusion
This study successfully validated the modified JETRO method for determining TRCs migrating from PE into 20% (v/v) ethanol food simulant at 60 oC for 30 minutes, establishing a detection limit of 0.96 mg/L, and validation results within the acceptable precision criteria. The profiling of PE samples revealed that only 60% of the samples were within the established validation criteria. All samples, however, remained below the regulatory limits set by JETRO and EU, exhibiting compatibility with fermented and alcoholic foods and ensuring public safety from single exposure migration. Furthermore, the assessment of crystallinity revealed that no statistically significant difference was observed between the LDPE and HDPE samples, indicating that polymer crystallinity had no measurable influence under the conditions tested. While the method demonstrated fitness-for-purpose, its performance characteristics could be further improved through trueness evaluation using an appropriate certified reference material (CRM). In the absence of an appropriate CRM, recovery experiments with appropriately selected spiking compounds are also recommended. The use of other food simulants, such as extracting solvents that resemble oily or fatty food products, can help provide a better profile of the existing PE packaging available in the market. Meanwhile, higher ethanol concentrations, longer contact times, and temperature variations are also suggested to distinguish crystallinity between different types of PE and study real-life migration behavior of TRCs to fermented and alcoholic food products under different experimental conditions. Ultimately, such endeavors will support the development of regulatory policies regarding food packaging in the Philippines.
Acknowledgement
The authors would like to express their sincere gratitude to the Department of Science and Technology (DOST), particularly the Central Office, Philippine Council for Industry, Energy and Emerging Technology Research and Development (DOST–PCIEERD) and the Industrial Technology Development Institute (DOST–ITDI), for funding, monitoring, and implementing this research, respectively.
Funding Sources
This study was funded by the DOST-ITDI General Appropriations Act (GAA) under the project: “Development of Predictive and Anomaly Detection Machine Learning Models for Overall Chemical Migration from Selected Plastic Packaging Bags and Pouches to Food Simulants (RDR-PTD-2026-04)”
Conflict of Interest
The authors do not have any conflict of interest.
Data Availability Statement
This statement does not apply to this article.
Ethics Statement
This research did not involve human participants, animal subjects, or any material that requires ethical approval.
Informed Consent Statement
This study did not involve human participants, and therefore, informed consent was not required.
Clinical Trial Registration
This research does not involve any clinical trials.
Permission to Reproduce Material from Other Sources
Not applicable.
Author Contributions
- Andrea Kyla Mateo Carlos: Methodology, Writing, Analysis, Data Collection – Original Draft, Review and Editing
- Gabriel John Macapagal Manalo: Analysis and Data Collection
- Elyson Keith Ponce Encarnacion: Conceptualization, Supervision, Funding Acquisition, Review and Editing
- Agaseve Famanilay Del Rosario: Supervision, Analysis, Review and Editing
- Josefino Antonio T. Mendoza: Review and Editing
- Anne Cardoza Alcantara: Project Administration, Review and Editing
- Winnie Pagaduan Alejandro: Review and Editing
- Rizel Marie San Miguel Ting: Review and Editing
References
- Tamang JP, Cotter PD, Endo A, et al. Fermented foods in a global age: East meets West. Compr Rev Food Sci Food Saf. 2020;19(1):184-217.
CrossRef - Sanchez PC. Microbial Interactions in Philippine Fermented Foods. FAO AGRIS. 1989;1989:1-20.
- Sanchez PC. Microorganisms and Technology of Philippine Fermented Foods. J Lactic Acid Bact. 1999;10(1):19-28.
CrossRef - Banaay B, Garcia C, Marilen P, et al. Lactic Acid Bacteria in Philippine Traditional Fermented Foods. In: Kongo JM, ed. Lactic Acid Bacteria – R & D for Food, Health and Livestock Purposes. InTech;
CrossRef - Fuentes H, Flores JP, Bacaltos DG, et al. A comprehensive assessment of plastic pollution inland, on riverbanks, along the coastline, and at the sea surface in Southern Mindanao, Philippines. Mar Pollut Bull. 2024;209:117134.
CrossRef - Tajeddin B, Arabkhedri M. Polymers and food packaging. In: Polymer Science and Innovative Applications. Elsevier; 2020:525-543.
CrossRef - Onyeaka HN, Nwabor OF. Natural active components in smart food packaging system. In: Food Preservation and Safety of Natural Products. Elsevier; 2022:119-131.
CrossRef - Chen L, Lin Z. Polyethylene: Properties, Production and Applications. In: 2021 3rd International Academic Exchange Conference on Science and Technology Innovation (IAECST). IEEE; 2021:1191-1196.
CrossRef - Kim YT, Min B, Kim KW. General characteristics of packaging materials for food systems. In: Innovations in Food Packaging. Elsevier; 2014:13-35.
CrossRef - Tuteja J, Vyas A, Sand A. Introductory chapter: polyethylene—its properties and applications in industry and households. In: Sand A, Tuteja J, eds. Polyethylene: New Developments and Applications. IntechOpen; 2024.
CrossRef - Gupta RK, Pipliya S, Karunanithi S, et al. Migration of chemical compounds from packaging materials into packaged foods: interaction, mechanism, assessment, and regulations. Foods. 2024;13(19):3125.
CrossRef - Kowalczyk P, Kadac-Czapska K, Grembecka M. Polyethylene Packaging as a Source of Microplastics: Current Knowledge and Future Directions on Food Contamination. Foods. 2025;14(14):2408.
CrossRef - Carraher CE, Seymour RB. Structure—Property Relationships in Polymers. Springer US;
- Hahladakis JN, Velis CA, Weber R, et al. An overview of chemical additives present in plastics: Migration, release, fate and environmental impact during their use, disposal and recycling. J Hazard Mater. 2018;344:179-199.
CrossRef - Dumitru O, Ungureanu E, Iorga C, et al. Overall migration aspects for plastic food contact materials with food simulants using SPSS statistics. J Hyg Eng Des. 2020;2020:1-12.
- Schmid P, Welle F. Chemical Migration from Beverage Packaging Materials—A Review. Beverages. 2020;6(2):37.
CrossRef - Chapke K, Gandhi K, Lata K, et al. Migration study of chemical additives from low density polyethylene (LDPE) into dahi. J Food Sci Technol. 2022;59(8):3283-3295.
CrossRef - Alejandro WP, Encarnacion EKP, Alcantara AC, et al. Assessment of total UV-absorbing contaminants in LDPE food packaging from Philippine markets. Curr Res Nutr Food Sci. 2025;13(2):913-925.
CrossRef - Encarnacion EKP, Alcantara AC, Armario HE, et al. Preliminary Screening of Per- and Polyfluoroalkyl Substances (PFAS) in Philippine Fast Food Packaging Using Liquid Chromatography–Mass Spectrometry (LC-MS). Curr Res Nutr Food Sci. 2024;12(1):423-436.
CrossRef - Ting RM, Encarnacion EK, Alcantara AC, et al. Method validation and profiling of total UV-absorbing contaminants migrating from monolayered low-density polyethylene used for aqueous foods in the Philippines. Polyolefins J. 2025;
- Ong HT, Samsudin H, Soto-Valdez H. Migration of endocrine-disrupting chemicals into food from plastic packaging materials: an overview of chemical risk assessment, techniques to monitor migration, and international regulations. Crit Rev Food Sci Nutr. 2022;62(4):957-979.
CrossRef - Batra T. Endocrine-disrupting carcinogenic plastic contamination in the food chain: a review. Biosci Biotechnol Res Asia. 2011;8:597-601.
CrossRef - European Commission. Commission Regulation (EU) No 10/2011 of 14 January 2011 on plastic materials and articles intended to come into contact with food. Off J Eur Union. 2011;L12:1-89.
- Food and Drug Administration. FDA Circular No. 2022-011: Guidelines on the Application and Issuance of Voluntary Certification of Food Contact Articles Used for Prepackaged Processed Food Products. Manila, Philippines: FDA; 2022.
- Armario H, Encarnacion EK, Alcarde DJ Jr, et al. Preliminary screening and method comparison of total residual contaminants migrating to fatty and oily foods from low-density polyethylene food contact articles sold in the Philippines. Int J Food Stud. 2025;14(1):1-12.
CrossRef - Japan External Trade Organization. Specifications and Standards for Food, Food Additives, etc. JETRO; 2009:529.
- Resnik DB, Shamoo AE. Reproducibility and research integrity. Account Res. 2017;24(2):116-123.
CrossRef - Shrivastava A, Gupta V. Methods for the determination of limit of detection and limit of quantitation of the analytical methods. Chron Young Sci. 2011;2(1):21-25.
CrossRef - Armbruster DA, Pry T. Limit of blank, limit of detection, and limit of quantitation. Clin Biochem Rev. 2008;29(Suppl 1):S49-S52.
- AOAC International. Official Methods of Analysis of AOAC International. 22nd ed. Oxford University Press; 2023.
- Magnusson B, Örnemark U, eds. Eurachem Guide: The Fitness for Purpose of Analytical Methods—A Laboratory Guide to Method Validation and Related Topics. 2nd ed. Eurachem;
- Horwitz W, Albert R. The Horwitz Ratio (HorRat): A Useful Index of Method Performance with Respect to Precision. J AOAC Int. 2006;89(4):1095-1109.
CrossRef - D’Amelia RP, Gentile S, Nirode WF, et al. Quantitative Analysis of Copolymers and Blends of Polyvinyl Acetate (PVAc) Using Fourier Transform Infrared Spectroscopy (FTIR) and Elemental Analysis (EA). World J Chem Educ. 2016;4(2):25-31.
- Da Silva DJ, Wiebeck H. ATR-FTIR Spectroscopy Combined with Chemometric Methods for the Classification of Polyethylene Residues Containing Different Contaminants. J Polym Environ. 2022;30(7):3031-3044.
CrossRef - Peltzer MA, Simoneau C, European Commission, eds. Report of an Inter-Laboratory Comparison from the European Reference Laboratory for Food Contact Materials: ILC 002 2013: Identification of Polymeric Materials. Publications Office;
- Frykberg GE, Grip H, Alt Murphy M. How many trials are needed in kinematic analysis of reach-to-grasp?—A study of the drinking task in persons with stroke and non-disabled controls. J NeuroEng Rehabil. 2021;18(1):101.
CrossRef - Forrester SE. Selecting the number of trials in experimental biomechanics studies. Int Biomech. 2015;2(1):62-72.
CrossRef - International Council for Harmonisation of Technical Requirements for Pharmaceuticals for Human Use. ICH Q2(R1): Validation of Analytical Procedures: Text and Methodology. Geneva, Switzerland: ICH; 2005.
- Su WJ, Wang LM, Weng SF, et al. [Effect of humidity and temperature on filter and gravimetric measurement of ambient particulate matter in a balance room. Zhonghua Lao Dong Wei Sheng Zhi Ye Bing Za Zhi. 2008;26(4):198-202.
- AOAC International. Official Methods of Analysis of AOAC International. 21st ed. Rockville, MD: AOAC International; 2019. Appendix K.
- Crivilari VAV, Dos Santos JB, Lourenço FR. Impact of sample heterogeneity on the evaluation of uncertainty from sampling and analytical steps in pharmaceutical analysis. J Pharm Biomed Anal. 2025;255:116660.
CrossRef - Japan External Trade Organization. Specifications and Standards for Foods, Food Additives, etc. Under the Food Sanitation Act (Abstracts) 2010. Tokyo, Japan: JETRO; 2011.
- Brandsch R, Schuster D. Repeated use food contact materials: A categorisation approach in support of risk assessment. Food Addit Contam A. 2020;37(12):2184-2203.
CrossRef - Paul A, Laurila T, Vuorinen V, et al. Fick’s Laws of Diffusion. In: Thermodynamics, Diffusion and the Kirkendall Effect in Solids. Springer International Publishing; 2014:115-139.
CrossRef - Mastanjević K, Kartalović B, Kovačević D, et al. Migration of Phthalates and Bisphenol A from Polyethylene Terephthalate Bottles into Beer During Storage at Controlled Temperatures. 2025;14(15):2689.
CrossRef - Massahi T, Mirshafiee A, Parastouei K. Bisphenol A migration and associated health risk in polyethylene terephthalate-bottled yogurt drinks (Doogh) under different storage scenarios. Sci Rep. 2025;15(1):31135.
CrossRef - Xu Q, Yin X, Wang M, et al. Analysis of Phthalate Migration from Plastic Containers to Packaged Cooking Oil and Mineral Water. J Agric Food Chem. 2010;58(21):11311-11317.
CrossRef - Muzeza C, Ngole-Jeme V, Msagati TAM. The Mechanisms of Plastic Food-Packaging Monomers’ Migration into Food Matrix and the Implications on Human Health. 2023;12(18):3364.
CrossRef - Kato LS, Conte-Junior CA. Safety of Plastic Food Packaging: The Challenges about Non-Intentionally Added Substances (NIAS) Discovery, Identification and Risk Assessment. Polymers. 2021;13:2077.
CrossRef - Seref N, Cufaoglu G. Food Packaging and Chemical Migration: A Food Safety Perspective. J Food Sci. 2025;90(5):e70265.
CrossRef - Piringer OG, Baner AL. Plastic Packaging: Interactions with Food and Pharmaceuticals. 2nd completely revised edition. Wiley-VCH; 2008.
CrossRef - Khokhar P, Pawar K. Chemical migration from packaging materials into consumable food matrices: A mini review. Int J Agric Food Sci. 2025;7(1):21-25.
CrossRef - Jasse B, Seuvre AM, Mathlouthi M. Permeability and structure in polymeric packaging materials. In: Mathlouthi M, ed. Food Packaging and Preservation. Springer US; 1994:1-22.
CrossRef - Li D, Zhou L, Wang X, et al. Effect of Crystallinity of Polyethylene with Different Densities on Breakdown Strength and Conductance Property. 2019;12(11):1746.
CrossRef - Shimadzu Corporation. Distinction of Polyethylene and Polypropylene by Infrared Spectrum (Application Note 01 00710 EN). Kyoto, Japan: Shimadzu; 2024.
- Safandowska M, Makarewicz C, Rozanski A, et al. Barrier Properties of Semicrystalline Polylactide: The Role of the Density of the Amorphous Regions. 2022;55(22):10077-10089.
CrossRef - Petrovics N, Kirchkeszner C, Patkó A, et al. Effect of crystallinity on the migration of plastic additives from polylactic acid-based food contact plastics. Food Packag Shelf Life. 2023;36:101054.
CrossRef - Arvanitoyannis IS, Bosnea L. Migration of Substances from Food Packaging Materials to Foods. Crit Rev Food Sci Nutr. 2004;44(2):63-76.
CrossRef - Lopes JA, Tsochatzis ED, Robouch P, et al. Influence of pre-heating of food contact polypropylene cups on its physical structure and on the migration of additives. Food Packag Shelf Life. 2019;20:100305.
CrossRef
Abbreviations
CFR – Code of Federal Regulations
CRM – Certified Reference Material
DOST – Department of Science and Technology
EFSA – European Food Safety Authority
FCMs – Food Contact Materials
FDA – Food and Drug Administration
FTIR-ATR – Fourier Transform Infrared Spectroscopy with Attenuated Total Reflectance
GAA – General Appropriations Act
HorRat – Horwitz Ratio
IAS – Intentionally Added Substances
ITDI – Industrial Technology Development Institute
JETRO – Japan External Trade Organization
LAB – Lactic Acid Bacteria
LDPE – Low-Density Polyethylene
LLDPE – Linear Low-Density Polyethylene
LOD – Limit of Detection
LOQ – Limit of Quantification
NCR – National Capital Region
NIAS – Non-Intentionally Added Substances
PCIEERD – Philippine Council for Industry, Energy and Emerging Technology Research and Development
PE – Polyethylene
PET – Polyethylene Terephthalate
PP – Polypropylene
PSL – Packaging Safety Laboratory
PTD – Packaging Technology Division
RSD – Relative Standard Deviation
SD – Standard Deviation
SLV – Single-Laboratory Validation
SUP – Single-Use Packaging
TACs – Total UV-Absorbing Contaminants
TRCs – Total Residual Contaminants
US CFR – United States Code of Federal Regulations
XLPE – Cross-Linked Polyethylene
Accepted on: 19 Mar 2026
Second Review by: Khritish Swargiary
Final Approval by: Dr. Aly El. Sheikha


Web of Science Coverage
Emerging Sources Citation Index (ESCI)
2024 Journal Impact Factor: 1.1
Scopus Journal Metrics
CiteScore 2025: 2.6
CiteScore Details
Sustainable Nutrition: Food Systems, Nutrient Retention, and Public Health Impact
![]()
This journal is a member of, and subscribes to the principles of, the Committee on Publication Ethics (COPE)


