Effect of Different Processing Methods on the Nutritional Value of Rice
Tarali Kalita*
, and Jimpi Hazarika Department of Zoology, Cotton University, Guwahati, Assam, India.
Corresponding Author Email: taralikalita.tihu@gmail.com
DOI : http://dx.doi.org/10.12944/CRNFSJ.9.2.31
Download this article as:
![]()
Rice, the mostly used cereal grain, is composed of three layers-husk, bran and endosperm, each contains various specific components. These layers can be lost or retained depending on the different processing methods used. The objective of the present study was to know the nutritional value of raw and parboiled Ranjit rice obtained by de-husking method using both modern milling and a traditional de-husking method by “Dhenki”. After preparing the rice flour, estimation of carbohydrate, protein, crude lipid, crude fiber, Minerals: Fe, Zn, Ca, vitamins thiamin and niacin were carried out for all the rice samples following standard methods. The milled rice grains showed greater losses in the fat, protein and fiber contents compared to the rice grains de-husked by Dhenki. On the other hand, the parboiling of the paddy prior to de-husking enhanced the nutritional quality of the rice compared to the un parboiled raw rice as parboiling - allows some nutrients like Iron and vitamins to transfer from the hull into the grain. Parboiled rice also showed less carbohydrate content compared to the raw rice. Further study with animal model revealed that parboiled rice de husked by Dhenki showed slow rate of digestion indicating it as a source of good carbohydrate.The findings may be useful in helping the people to choose the right processing methods for rice to obtain maximum yield in nutrition.
KEYWORDS:Milling; Nutritional Value; Parboiling; Processing Methods; Rice
Introduction
Rice is most widely consumed as staple food by a large group of human population, especially in Asia. It is one of the most important cereal grains with regard to human nutrition and caloric intake 1.The health benefits of rice are it provides instant energy, regulates digestion, improves bowel movement and boost metabolism, maintains blood sugar level and reduce high blood pressure, slows down the aging process and provides protection against dysentery and chronic diseases 2.
Different studies on nutrient content of rice showed that the nutritional value of the rice is based on a number of factors like strain of rice, such as white, brown, red, and black (or purple), nutrient quality of the soil where the rice is grown in, how the rice is processed and how it is prepared before consumption3. The rice grain consists of hull, the outer protective covering and the rice caryopsis or fruit. After de-husking the rice contains outermost pericarp followed by seed coat, nucellus and aleurone layer while the embryo and the endosperm are lying inside 4. Each of the layers is characterized by the presence of some specific components such as the endosperm contains carbohydrates, protein and Vit B; embryo and aleurone cells contain higher amount of protein and lipid while pigment is present only in the pericarp 4. These layers can be lost or retained depending on the different processing methods used. Thus the rice obtained from different processing methods results in rice with different nutrient values. For example, the brown rice has all its part intact—the bran, germ, and the endosperm—only taking off the outer hull of the rice and the kernel is rich in proteins, vitamins, minerals, fiber as well as it is considered as a low “glycemic index” food. The brown rice is converted into white rice by 100% milling and it is revealed that polishing destroys vitamin B3 (67%) , vitamin B1 (80%), vitamin B6 (90%) , minerals like manganese, phosphorus, iron and all of the dietary fiber and essential fatty acids5.
Parboiling involves partial boiling of the paddy before de-husking in order to increase its nutritional value, and reduce the breakage in milling. Different traditional as well as modern techniques are used for parboiling of rice, keeping the main steps like Soaking, Steaming and drying unchanged. Followed by parboiling, de-husking is done to obtain the rice grain which is ready to cook. For de-husking also, along with modern milling techniques some traditional methods are also used which may influence the nutritional value of the rice sample. The Dhenki is an age old traditional lever used for de-husking of rice in places like Bangladesh and Indian states of Assam, West Bengal and Odisha. It is foot operated, made of hard wood and has a fulcrum to support weight. The force of the weight on the rice in the pods results the separation of golden color husk from the rice grain. However, less information is available regarding the nutritive value of de husked rice by this traditional method 6. In this study an attempt has been made to compare the nutritional values of rice obtained from modern milling and traditional Dhenki. Before dehusking, partial boiling of the paddy was carried out following the traditional method followed in Assam, as it is suggested that parboiling increases its nutrition value 7. The nutritional value of the parboiled rice was compared to the un parboiled rice grain obtained by the same modern milling method and traditional method.
Materials and Methods
A single variety of rice paddy (Oryza sativa)-Ranjit was collected from Sivasagar, Assam, India by random sampling method from the local farmers. One set of sample was parboiled and then de – husked by modern milling and using traditional Dhenki (Fig1). Parboiling was done by boiling the dry rice paddy followed by sun drying using traditional method. Another set of sample was de – husked by modern milling and using traditional Dhenki without boiling.
Rice samples were then washed, sun dried, grinded with mortar grinder RM 200 and sieved (60 US Mesh 250 µm). The samples were then kept in air tight container for further study.
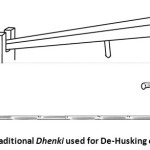 |
Figure 1: Traditional Dhenki used for De-Husking of Rice Grain. |
Before grinding the color differences of the rice grain samples were observed with the help of a stereo zoom microscope. The carbohydrate content of the samples was estimated following Anthrone method 8. The protein content of the rice samples was determined by the Kjeldahl method 9.Crude lipid was estimated as crude petroleum ether extract of the dry material and lipid content was calculated as per A.O.A.C (1970) (Association of Official Analytical Chemists) guidelines 10.Crude fiber content was determined using the method described in IS: 10226-1 (Bureau of Indian standards 1982) 11. Procedure was carried out in food quality control laboratory, Department of food engineering and technology, Tezpur University, Assam, India. The mineral analysis was done by Atomic Absorption Spectrophotometer (AAS) (Model- Thermo Fisher Scientific AASIce 3500) using Flame Technique in the same department only. For estimation of thiamin (Vitamin B1) and Niacin (Vitamin B3) the method of Okwu and Josiah (2006) was followed 12.
To study the digestion rate of the rice samples, Swiss albino mice of strain C3H/J of both the sexes of three months old and weight 25-30g were collected from the Pasteur Institute, Shillong, and Meghalaya, India. The approval of Institutional Ethical Committee was taken prior to set up the experiment (Reference Letter No. CU/ZOO/AEC233/2018/10).The animals were maintained under standard conditions of temperature 20-25°C and relative humidity of 50-65% with an alternating 12 hour light-dark cycle for 15 days prior to the start of the experiment to acclimatize them. The mice were fed with commercially available mice pellet diet 13.These conditions were continued throughout the whole experiment period. A total of 15 mice were divided into five groups each containing three mice irrespective of sex: Control group (mice feed+water), Group 1 (unboiled milled rice+water), group 2 (parboiled milled rice+water), group 3 (Unboiled rice de-husked by Dhenki+water), Group 4 (Parboiled rice de-husked by Dhenki+water). The dose for each group of mice were 15 g/100gbody weight of mice depending on the daily requirement of normal food in each day. Two times in a day, the mice were feed with the above mentioned diet and then blood glucose level was measured before and after one hour of the food intake by glucometer taking blood from tail. The experiment was continued for 7 days.
For statistical analysis mean, standard Error of mean and One-way ANOVA were calculated in MS Excel (2010) considering differences statistically significant at p<0.05. Post Hoc Tukey HSD was performed and samples belonging to the different subset were represented by different alphabets and it indicates more variation among them and vice versa.
Result
Physical observation of the rice grains showed variation in color from yellowish to creamy off white (Fig 2 A-D). The rice grains obtained by parboiling and then de-husking by Dhenki were observed yellowish in color while dirty creamy white color of the rice grain was found in Parboiled and milled rice. The un parboiled rice de-husked by Dhenki showed dirty white coloration and the un Parboiled and milled rice showed off white coloration of the rice grain.
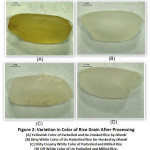 |
Figure 2: Variation in Color of Rice Grain After Processing. |
Biochemical estimation recorded significant differences among the rice samples prepared by different processing methods (Table 1). Protein content was highest (4.9±0.87d g/100g) in parboiled Ranjit rice de-husked by Dhenki whether lowest (3.0 ± 0.77ag/100g) in un parboiled rice sample de-husked by milling. The other two samples like Sample 1 (Un Parboiled/Dhenki) and sample 4 (Parboiled/Milled) recorded protein content 3.9 ± 0.98c g/100g and 3.5 ± 0.89b g/100g respectively. The carbohydrate content was recorded highest (46.5 ± 0.88c g/100g) in un parboiled and Milled rice sample as well as lowest (28.5 ± 0.87a g/100g) in parboiled and de-husked by Dhenki rice sample. From the results, it was observed that the parboiled rice contains more fat content (1.0± 0.88a g/100g and 0.89 ± 0.11b g/100g) compared to the un parboiled rice (0.80±0.6c g/100g and 0.52±0.14d g/100g). The fiber content analysis revealed that both the parboiled and un parboiled rice samples but de-husked by Dhenki (0.86± 0.5a g/100g and 0.60± 0.6b g/100g) contain more fiber than the others (0.40± 0.5d g/100g and 0.53 ± 0.5c g/100g).
Table 1: Macro Molecule and Crude Fiber Content (g/100g) of the Rice Samples (n=6, Values are Mean±SE). Means were Considered Statistically Different at p < 0.05. Different Letters within the Same Column Indicate significant Differences Between Analyses within each Sample.
| Rice Sample | Protein (g/100g)Kjeldahl Conversion Factor 6.25 | Carbohydrate (g/100g) | Crude lipid (g/100g) | Crude Fiber(g/100g) |
| 1. Un Parboiled/Dhenki | 3.9 ± 0.98c | 43 ± 0.97 d | 0.80 ±0.6c | 0.60± 0.6b |
| 2. Parboiled/ Dhenki | 4.9±0.87d | 28.5 ± 0.87a | 1.0 ± 0.88a | 0.86± 0.5a |
| 3. Un Parboiled/Milled | 3.0 ± 0.77a | 46.5 ± 0.88c | 0.52 ±0.14d | 0.40± 0.5d |
| 4. Parboiled/Milled | 3.5 ± 0.89b | 39.4 ± 0.89b | 0.89 ± 0.11b | 0.53 ± 0.5c |
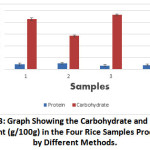 |
Figure 3: Graph Showing the Carbohydrate and Protein Content (g/100g) in the Four Rice Samples Processed by Different Methods. |
The minerals iron (Fe), zinc (Zn) and calcium (Ca) showed significant variation in the rice samples processed by different methods (Table 2).Iron content was found higher in parboiled rice (1.1 ± 0.12a mg/100g and 0.86 ± 0.13b mg/100g) compared to un parboiled rice (0.55 ± 0.18c mg/100g and 0.47 ± 0.17d mg/100g). The un parboiled rice recorded higher Zinc content (2.62 ± 0.19b mg/100g and 2.86 ± 0.17a mg/100g). Ca content was found highest (6.13 ± 0.11a mg/100g) in un parboiled/milled rice. The amount of Thiamin content was more (0.52±0.11a mg/100g and 0.44±0.13b mg/100g) in parboiled rice whereas Niacin content was more in both parboiled (5.01±0.13a mg/100g) and un parboiled rice (4.71±0.09b mg/100g) but de-husked by Dhenki (Table 3).
Table 2: Mineral (Fe, Zn, Ca) Content (mg/100g) of Rice Samples (n=6, Values are Mean ± SE). Means were Considered Statistically Different at p < 0.05. Different Letters within the Same Column Indicate Significant Differences Between Analyses Within Each Sample.
| Rice Sample | Iron (Fe) | Zinc (Zn) | Calcium (Ca) |
| 1. Un parboiled/Dhenki | 0.55 ± 0.18c | 2.62 ± 0.19b | 5.02 ± 0.11b |
| 2. Parboiled/ Dhenki | 1.1 ± 0.12a | 2.39 ± 0.12c | 3.9 ± 0.18d |
| 3. Un Parboiled/Milled | 0.47 ± 0.17d | 2.86 ± 0.17a | 6.13 ± 0.11a |
| 4. Parboiled/Milled | 0.86 ± 0.13b | 2.35 ± 0.22c | 4.34 ± 0.11c |
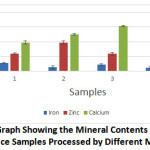 |
Figure 4: Graph Showing the Mineral Contents (mg/100g) in the Rice Samples Processed by Different Methods. |
Table 3: Thiamine (Vit B1) and Niacin (B3) content (mg/100g) of rice samples (n=6, values are Mean ± SE). Means were considered statistically different at p < 0.05. Different letters within the same column indicate significant differences between analyses within each sample.
| Rice sample | Thiamine | Niacin |
| 1. Un parboiled/Dhenki | 0.34±0.06c | 4.71±0.09b |
| 2. Parboiled/ Dhenki | 0.52±0.11a | 5.01±0.13a |
| 3. Un Parboiled/Milled | 0.07±0.13d | 1.62±0.14d |
| 4. Parboiled/Milled | 0.44±0.13b | 3.52±0.11c |
The blood glucose level estimation in mice after feeding of rice processed by different methods showed that the feeding of parboiled rice and de-husked by traditional Dhenki showed less increase in blood glucose level followed by the parboiled/milled rice (Table 4).
Table 4: Blood Glucose Level (mg/dL) after One Hour of Feeding of Different Rice Samples for Seven (7) Days. The Values are Mean ± SE and Means were Considered Statistically Different at p < 0.05. Different Letters within the Same Column Indicate Significant Differences Between Analyses Within Each Sample.
| Group | Blood glucose level (mg/dL)After one hour of feeding |
| Control | 85.1±0.45e |
| Group 1 (un Parboiled milled rice+water) | 152.4±0.26a |
| Group 2 (parboiled milled rice+water) | 110.2±0.34c |
| Group 3 (Un Parboiled rice de-husked by Dhenki+water) | 142.6±0.87b |
| Group 4 (Parboiled rice de-husked by Dhenki+water) | 104.5±0.64d |
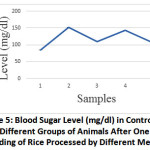 |
Figure 5: Blood Sugar Level (mg/dl) in Control and Four Different Groups of Animals After One Hour of Feeding of Rice Processed by Different Methods. |
Discussion
Different layers of rice contain various amounts of carbohydrate, protein, lipid and fiber. The removal of different layers during the de–husking process changes the nutritional quality of rice 14. The milling of brown rice removes the outer bran layer (pericarp), seed-coat and aleurone layer. Thus the milling process removes a considerable amount of vitamins, minerals, fiber, essential fatty acids and some protein 15 which supports the result of the present study. Hence, milled rice is mainly a source of carbohydrates and protein. However, the rice de-husked by traditional Dhenki does not completely remove the pericarp and therefore, the protein content is found more than the same unboiled rice but de-husked by milling where pericarp is removed finely. According to Saleh et al., 16 the difference in protein content between brown and white rice is because of bran protein. In brown rice the bran layer is intact thereby protein content is significantly higher than white rice where bran layer is removed during processing.
Parboiling is the method of soaking, steaming and drying of paddy before de-husking. The present study showed that the rice samples obtained from parboiling prior to milling as well as de-husking by a Dhenki consisted of less carbohydrate. The result also showed significantly lesser value of carbohydrate content in the rice sample processed by Dhenki than milling. During parboiling the complex starch present in the endosperm goes for starch retro gradation that increase the amylopectin and amylose crystallization and thus reduce the starch digestibility and glycemic responses as observed in the present study both in vivo and in vitro 17 . It is also suggested that the further cooking of rice again reduces the carbohydrate content and one cup of cooked brown rice contains 32 g of carbohydrate against the 52 g in one cup of uncooked rice grain 18. It is also observed that parboiling improves the kernel strengthening and prevents the nutrients loss as a result of milling. It may be due to the fact that parboiling fills the empty spaces and cement the cracks inside the endosperm. It makes the grain harder and minimizes the internal fissuring and thus prevents the breakages during milling 19. Thus due to slow digestion rate and low carbohydrate content the parboiled rice before de-husking by Dhenki may be a good choice for diabetic patients followed by the parboiled rice and de-husked by milling. On the other hand, carbohydrate content in unboiled rice was found to be the highest. The unboiled white rice is rich in simple carbohydrates as simple carbohydrates are like quick-burning fuels. They break down fast into sugar as observed in the present study in animal model. Unlike complex carbohydrates, simple carbohydrates are quickly converted into energy by the body. Thus the carbohydrate rich rice may help to energize the body and boosts the organs’ metabolic activities. But Simple carbohydrates are also linked to obesity.
Crude lipid is localized in bran, embryo and endosperm fraction. Rice bran is mostly used for extraction of oil. According to Tong et al., 20 storage, processing, and cooking technique mainly influence the quantity of lipid in rice grain. In the present study, the crude lipid content varies between 0.52-1 Wt % which is almost similar to the report by Godber and Juliano 21. Parboiling inactivates the enzyme lipase in bran layer which mediates the oxidation of most of the lipids in bran layer 22. This may be a possible cause why crude lipid content is more in parboiled rice before de-husking compared to un boiled rice. Although lipid content in rice is not higher as the carbohydrate and protein, but it plays an important role as a component of various essential fatty acids 23.
Rice is an excellent source of crude fiber, however the removal of various layers of rice grain during processing method greatly influence the quantity of crude fiber in the rice sample. Fernando 24 reported that the crude fiber content in brown rice is 0.6-1 g/100g and 0.2-0.5 g/100g in white rice which are almost similar to the present findings. It is because rice bran is the rich source of crude fiber and after de husking when the bran is removed by milling then the crude fiber content becomes less. The de-husking of rice by using traditional Dhenki does not remove the bran layer; hence, the fiber content is more in them. Again in the parboiled rice which was further de-husked by Dhenki recorded highest fiber content. The milled parboiled rice showed greater fiber content than un parboiled milled rice. This is due to the parboiling process, during which some nutrients transfer from the bran into the starchy endosperm 25. The fiber present in rice is the insoluble type of fiber and plays a major role to add bulk to faeces and thus prevent constipation. Due to higher amount of insoluble fiber in parboiled rice, it increases the time a person feels his stomach ‘full’. Thus, it allows slow release of insulin for glucose metabolism and thereby decreasing the risk of diabetes. Parboiled rice de-husked by Dhenki may be also protective against weight gain 26.
Although rice is everyday diet for more than half of the world’s population but it contains very little amounts of micronutrients 27. Further, during processing to obtain consumable rice grain from paddy, while the layers of the rice grain such as hull, bran and aleuronic layers are again removed, micronutrient contents become very low. However, the loss of micronutrients depends on the processing method. In the present study parboiled rice recorded higher amount of iron (1.1 ± 0.5a and 0.86 ± 0.5b) than the un parboiled rice. Again Rice sample de-husked by Dhenki showed more iron content than the rice grain processed by milling, it is because de-husking by Dhenki does not remove the pericarp which is rich in iron but in polished rice by milling all the layers are removed leaving only a trace amount of micronutrients. Prom-u-Thai et al. 28 stated that during parboiling, iron may deposit in regions of the rice kernel (bran, germ, and pericarp) that is removed when brown rice is milled. Thus, it can be concluded that limiting removal of kernel layers after parboiling may be useful to maintain the iron in rice after parboiling. The Zn and Ca content was found more in un parboiled rice than the parboiled rice which has a close consortium with the findings of Tamanna et al., 29 in four popular rice varieties in Bangladesh. Zinc is a part of more than 300 enzymes in human body that plays an important role in repairing cell damage, maintenance of fertility, and synthesis of proteins as well as in immunity boosting. Calcium makes up much of our bones and teeth and plays a role in maintaining heart health, muscle function as well as nerve signaling. Therefore, both are very essential for growth and development especially in children. However, adults those are diabetic can choose other food for obtaining the necessary amount of Zn and Ca. It is also reported that during parboiling the antioxidant property of rice grain is lost due to thermal exposure 30.
The niacin and thiamin content in the rice sample of present study were almost similar to the report by Verma 31. It is stated that average 2.145 mg of niacin per 100g rice is obtained, which corresponds to 11% of the niacin RDA (Recommended Daily Allowance) 32. Chaudhari et al., 33 stated that the out of B-complex vitamins, thiamin, riboflavin and niacin are present in rice that promote nourishment to skin, blood vessels and lowers the LDL cholesterol.
Thus from the above analysis it is observed that the nutritional properties of rice vary according to the processing methods employed. Although, parboiling of the rice prior to de-husking can help to reduce the carbohydrate content and retain many of the nutritive properties of rice such as protein, crude lipid, the crude fiber, iron and Vitamin B, however, in other cases, the un parboiled rice exhibit more mineral rich rice grains. On the other hand de-husking by Dhenki showed better nutritional property of rice compared to milling as the bran layer is retained in the traditional de-husking method.
Conclusion
The present study suggests that processing methods have profound impact on nutritive value of rice. Thus depending upon the health conditions and the nutritional needs of the consumers, the rice grain obtained by proper processing techniques can be recommended.
Acknowledgement
The authors are thankful to the Head, Department of Zoology, Cotton University, Guwahati, Assam for providing us necessary laboratory facilities to carry out the experimental works. We also express our gratefulness to the Food quality control laboratory, Department of food engineering and technology, Tezpur University, Assam, India for helping us in performing the estimation of crude fiber and mineral analysis in the studied rice samples.
Conflict of Interest
There is no conflict of interest among the authors for submission of the paper to this journal.
Funding Source
The authors carried out the present work at their own expenditure. No financial support was obtained from any funding agencies.
References
- Awika J.M.Major Cereal Grains Production and Use around the World. ACS Symposium Series 1089. 2011; 1-13. DOI: 10.1021/bk-2011-1089.ch001.
CrossRef - Kolahdouzan M. et al., The association between dietary intake of white rice and central obesity in obese adults. ARYA Atherosclerosis. 2013; 9 (2):140-4.
- Dunna V. and Roy B. (2013) Rice (Oryza sativa L.). In book: Breeding, Biotechnology and seed production of Field crops. New India Publishing Agency, India. 2013. Pp 52.
- Juliano B.O. and Bechtel D.B. The rice grain and its gross composition in book: Rice. 1985. DOI: 10.1016/B978-0-12-811508-4.00002-2.
CrossRef - Upadhyay A. and Karn S.K. Brown rice: Nutritional composition and health benefits. J. of Food Sc. and Tech. Nepal.2018; 10: 48-54 doi: https://doi.org/10.3126/jfstn.v10i0.19711.
CrossRef - Alwar S.K., Arabhosseini A., Kianmeher M.H. and Kermani A.M. The effect of hulling and whitening on quality of rice cultivar Daillman Mazandarani. The J. of Agr. Sc.2016; 49 (3): 71-83.
- Kyritsi A., Tzia C., Karathanos V.T. Vitamin fortified rice grain using spraying and soaking methods. LWT-Food Sc. and Tech. 2011. 44 (1): 312–320 doi:10.1016/j.lwt.2010.06.001.
CrossRef - Ludwig T.G. and Goldberg J.V. The anthrone method for the determination of carbohydrates in foods and in oral rinsing. J. Dental. Res.1956; 35(1):90-4 PMID:13286391 DOI: 10.1177/00220345560350012301.
CrossRef - Latimer G.W. Official Methods of Analysis of AOAC International. AOAC International; Gaithersburg, MD, USA: 2016.
- 2000. Official Methods of Analysis. Association of Official. Analytical Chemists. Washington, D.C. USA.
- https://details/gov.in.is.10226.2.1982/page/n3/mode/2up
- Okwu D. and Josiah C. Evaluation of the chemical composition of two Nigerian medicinal plants. African J. of Biotech. 2006; 5 (4): 357.
- Nutrient Requirements of Laboratory Animals: Fourth Revised Edition, 1995. National Research Council (US) Subcommittee on Laboratory Animal Nutrition. Washington (DC): National Academies Press (US); 1995.
- Gul K., Yousuf B., Singh A.K. and Singh P. Rice bran: Nutritional values and its engineering potential for development of functional food-A review. Bioactive Carbohydrates and Dietary Fibre. 2015; 6 (1): 24-30.
CrossRef - Kulp K. & Ponte J.G. Handbook of Cereal Science and Technology, Marcel Dekker, New York.2000.
CrossRef - Saleh A., Wang P. and Yong L. Brown rice versus white rice: Nutritional quality, potential, health benefits, development of food products and prevention technologies. Comprehensive Reviews in Food Science and Food Safety.2019; doi: 101111/1541-4337.12449.
- Derycke V., Vandeputte G.E., Vermeylen R., De M.W., Goderis B., Koch M.H.J., Delcour J. A. Starch gelatinization and amylose-lipid interactions during rice parboiling investigated by temperature resolved wide angle X-ray scattering and differential scanning calorimetry. J. Cereal Sci. 2005; 42(3): 334-343.
CrossRef - https://www.healthline.com/health/carbs-in-rice.
- Kumar V., Singh J., Chauhan N., Chandra S. and Yadav M.K. Process of paddy parboiling and their effects on rice-A review. J. Pharmacognosy and Phytochem.2018; 1727-1734.
- Tong C., Gao H., Luo S., Liu L. and Bao J. Impact of Post harvest operations on rice grain quality: A review. Comprehensive reviews in food Sc. and food safety. 2019; 18: 626-640 doi 10.1111/1541-4337.12439.
CrossRef - Godber J.S. and Juliano B.O. Rice lipids in book: Rice Chemistry and Technology. Am Assoc. Cereal Chemists. 2004; 163-190.
CrossRef - Borrensen E.C. and Ryan E.P. Rice Bran: A food ingredient with global public health opportunities in book: Wheat and Rice in disease prevention and health. 2014; 301-310Pp. Available at: https://doi.org/101016/B978-0-12-401716-0.00022-2.
CrossRef - Hemavathy J. and Prabhakar J.V. Lipid composition of rice (Oryza sativa L.) bran. J. of American Oil Chemists’ Society. 1987; 64:1016-1019.
CrossRef - Fernando B. Rice as a source of Fibre. J. of Rice Res.2013; 1(2): 100e101 Available at: http://dx.doi.org./10.4172/jrr1000e101.
CrossRef - https://www.healthline.com/nutrition/parboiled-rice.
- Lovergrove A., Bandonill E., Kosik O., Sreenivasulu N. Improving rice dietary fibre content and composition for human health. J. of Nutritional Sc. and Vitaminology. 2019; 65: s48.
CrossRef - Boonyaves K., Wu T.Y. et al., Enhanced grain iron levels in rice expressing on iron regulated metal transporter, Nicotinamine synthetase and Ferritin Gene Cassette. Frontiers in plant Sci.2017; 8:130 Available at: Available at: http://doi.org/10.3389/fpls.2017.00130.
CrossRef - Prom U.T.C., Huang L., Fukai S. and Rerkasem B.Iron fortification in parboiled rice-A rapid and effective tool for delivering iron nutrition to rice consumers. Food and nutrition Sciences. 2011; 2:323-328.
CrossRef - Tamanna S., Parvin S. et al., Content of some minerals and their bioavailability in selected popular rice varieties from Bangladesh. Int. J. of current Microbiol. and appl. Sc.2013; 2(7):35-43.
- Walter M., Marchesan E. et al., 2013. Antioxidant properties of rice grains with light brown, red and black pericarp colours and effect of processing. Food Res. Int.2013; 50 (2):698-703.
CrossRef - Verma D.K. Nutritional value of rice and their importance. Farmers’ Digest.2011; 44(1):21.
- http://www.dietandfitnesstoday.com/niacin-in-rice.php.
- Chaudhari P.R., Tamrakar N., Singh L., Tandon A. and Sharma D. Nutritional and Medicinal properties: A review article. J. of Phamacognosy and Phytochemistry.2018; 7(2):150-156.
Accepted on: 22 Feb 2021
Second Review by: Dr. Priti Gupta India
Final Approval by: Dr. Ardiansyah


Web of Science Coverage
Emerging Sources Citation Index (ESCI)
2024 Journal Impact Factor: 1.1
Scopus Journal Metrics
CiteScore 2025: 2.6
CiteScore Details
Sustainable Nutrition: Food Systems, Nutrient Retention, and Public Health Impact
![]()
This journal is a member of, and subscribes to the principles of, the Committee on Publication Ethics (COPE)


