Development and Validation of a Cultural-based Food Frequency Questionnaire (FFQ) against 7-day Food Diary (7d FD) to Assess Fish Intake among Elementary School Children
Setyaningrum Rahmawaty1* and Prof. Barbara J Meyer2
1Department of Nutrition Science, Faculty of Health Science, Universitas Muhammadiyah Surakarta, Indonesia. Jl. A. Yani Tromol Pos 1 Pabelan Kartasura, Surakarta, Jawa Tengah, Indonesia.
2School of Medicine, Lipid Research Centre, Faculty of Science, Medicine and Health, University of Wollongong, NSW, Australia.
3Illawarra Health and Medical Research Institute. Northfields Ave, Wollongong NSW, Australia.
Corresponding Author Email: setyaningrum_r@ums.ac.id
DOI : http://dx.doi.org/10.12944/CRNFSJ.9.2.25
Download this article as:
![]()
An accurate dietary fish questionnaire can be used to predict dietary intake status of omega-3 long chain polyunsaturated fatty acids (n-3 LCPUFA). The aim of this study was to design and validate a food frequency questionnaire (FFQ) to predict fish consumption of primary school children against a 7-day food diary (7d FD). A cross-sectional study was performed in elementary school in Surakarta, Indonesia. A total of 164 children aged 8 to 12 yo which were recruited using multi-stage random sampling were participated in this study. The FFQ consisted of 38 species of fish including 27 species of fresh fish and 11 species of processed fish. Total median (interquartile range) fish intake determined from the FFQ vs 7d FD was similar of 60 (36-114) g/d and 59 (37-108) g/d, respectively. A very good correlation was found between the FFQ and 7d FD by Spearman’s correlation coefficient test (r=0.965, p=0.0001) with an acceptable of the two methods using non-parametric limit of agreement (95% LoA=-10.907-34.619, median difference=0.011, 95% CI for median difference=-2.408-1.193). The FFQ is acceptable a valid tool to determine fish intake in this group.
KEYWORDS:Development; Fish Intake; Food Diary; Food-Frequency Questionnaire; Measurement; Validation
Introduction
Fish rich in omega-3 long chain polyunsaturated fatty acids (n-3 LCPUFA), especially docosahexaenoic acid (DHA, 22:6-n-3). DHA is a crucial element in the nervous system for development of the sensory, perceptual, cognitive and motor neural system during the brain growth spurt1 and also has been shown protective against cardiovascular disease (CVD). DHA is a conditionally essential nutrient, due to the low fractional conversion rate of the shorter chain n-3, α-linolenic acid (ALA) in human beings,2,3,4,5 therefore, it is recommended 6,7 to obtain preformed directly through dietary sources including fish.
Fish consumption is significantly correlated with the of n-3 LCPUFA profile in human tissues including erythrocyte,8 serum,9,10,11,12 and plasma.13,14 A recently randomized controlled trial (RCT) in healthy children age 8-9 years old by consuming high oily fish (300 g/week) for 12-week resulted in improvement of eicosapentaenoic acid (EPA)+DHA levels15 and modulated cardiometabolic markers by improving serum triacylglycerol and HDL-cholesterol.16 A number of epidemiological studies also have been reported that fish consumption in school children is associated with better school performance.17,18,19,20
It has been reported that the use of food frequency questionnaire (FFQ) in calculating episodically food intake showed better results than the commonly method used in food survey, which is 24-h recall.21 The use of the 24-h dietary recall in estimating habitual infrequently consumed food such as fish intake may introduce inherent errors, leading to potential reporting bias. Otherwise, FFQ has a number of superiors for this purpose, because it provides options relating to the frequency of consumption of each food listed over a specified time period. However, FFQ is very sensitive to cultural and dietary practice22 and only appropriate for certain population and particular nutrients, hence it might be invalid when applied to other groups. Therefore, it is crucial to design and validate the FFQ in relation to reference method in a specific population to provide accurate and actual intakes data.
Indonesia is an archipelago country with a diverse cultural background in each island or region, including the diversity of food as well as fish/seafood that is available in the market and at the household level in each region. Based on our preliminary survey on family food consumption in Surakarta, a city in Central Java showed that seafood contributes a variety of family protein sources, from frequent to very rare consumption (unpublished data). For this reason, the collection of fish consumption data based on a day food recall may result in inaccurate fish intake data. In addition, currently there is no specific dietary instrument including an FFQ to predict fish intake for both Indonesian and children in Surakarta. The aim of this study was to develop and validate an FFQ to assess fish intake of primary school children in Surakarta Indonesia against a 7-day food diary (7d FD).
Methods
Ethical Approvals
An ethical approval of this study was obtained from the Ethical Commission of Medical Research, Faculty of Medicine Universitas Muhammadiyah Surakarta (No. 713/B.1/KEPK-FKUMS/VI/2017). A permision to conduct the research was also obtained from the Education Agency of Surakarta City Government (No. 070/654/Set/2017 extended No. 070/1618/Set/2017). All the respondents provided their informed consent by signing consent forms prior to data collections. No monetary and material rewards were given for their participation.
Study Design
There were two design in this study namely 1) development and pilot test of an FFQ with its aid called a fish model image book and 2) validation of the FFQ (Diagram 1). The first study was conducted in October to November 2016 and included literature review and survey followed by designing the FFQ and pilot test. The next step was performed in July to September 2017. The FFQ together with the fish picture book were given to children after obtaining their informed consents approved by their parents. The children were asked to complete the FFQ and 7d-FD at home under mother supervision. The food picture book was used to assist children in estimating food portion size they eaten.
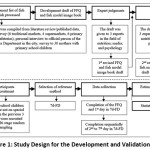 |
Figure 1: Study Design for the Development and Validation of FFQ. |
FFQ, Food Frequency Questionnaire; 7d-FD, 7-Day Food Diary. For detail see Section 2.4. and 2.5.
Study Participants
There were 2 subject groups in this study, including participants for the development of the FFQ and pilot study; and participants for the validation study. Subjects for the first study were recruited in November 2016 and consisted of experts (in the fields of nutrition; media; and psychology) and children on grade 3 to 6 which were invited through invitations distributed to parents or primary caregivers who were attending public playground areas in Pajang and Pabelan. A total of 3 experts and 10 children completed a questionnaire of content validity and pilot testing of the FFQ draft, respectively. All participants provided commentaries to the FFQ draft.
Participants for the validation study were recruited between July and September 2017. Multi-stage random sampling was applied to select the children which started by selecting a district from 5 districts in the city, followed by selection of 8 schools from 21 public primary schools and the last was random selection of children in each grade 3 to 6 of the selected school. The list of schools was obtained from web of the Ministry of Education and Culture Republic of Indonesia (http://data.kemendikbud.go.id/index11 .php?level=3&kode=036105&id5, downloaded on 13/8/2016). The 8 selected schools were public elementary school or Sekolah Dasar Negeri (SDN, Indonesian name) Sampangan, SDN Yosodipuran 130, SDN Mojo, SDN Lojiwetan, SDN Gurawan, SDN Sawahan and SDN Gading. A total of 451 randomly selected child with her/his parent were invited to participate in this study through an invitation letter was given to each child in class. Children who were on a diet that limited certain foods in the previous 3 months before the data collection were excluded in this study. A total of 164 children completed both the FFQ and 7d FD (Diagram 2).
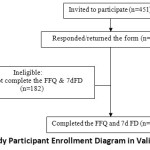 |
Figure 2: Study Participant Enrollment Diagram in Validation Study. |
Development of Food Frequency Questionnaire
The FFQ designed in this study was accompanied with a fish model image book to help children in filling the FFQ. Both the FFQ and the fish model image book were developed through 4 steps. In the first stage, list of fish species/processed-fish products were developed based on literature review or published data, market survey in 6 traditional markets and 4 supermarkets, cafeteria survey in 6 primary schools in Surakarta to obtain processed-fish products may consumed by children during school time, and interview to an official person of the Fisheries Department of Surakarta to get information about fish supply in the city. The list of fish/processed fish product name then was given to 30 mothers with primary school children to get any additional information fish consumed by their children. These activities were conducted during October 2016, and found 38 fish species consisted of 27 types of fresh fish and 11 processed-fish products. The next stage was drafting the FFQ and the fish model image book. Portion size adjustments were made to simplify the use of the fish model image book by presenting fish pictures in a commonly plate used by primary school children (diameter=21 cm). Expert judgments by 3 experts in the field of nutrition; media; and psychology were performed to review and assess each item/construct in the drafts. Expert’s comments in this step were used to re-design the FFQ and fish model image book drafts. Finally, the revised-FFQ and fish model image book drafts were tested in a pilot study involving 15 children with their mother who have similarity characteristics to the real study. The aim of the test was to measure the relevance, clarity, simplicity and ambiguity of the instruments. The participants also were asked to provide comments in each item of the drafts. Results of the pilot test were used to revise the FFQ and the fish model image book (final version).
Validation of Food Frequency Questionnaire
Final versions of the FFQ and fish model image book were used in the validation study, and a 7d-FD was used as a reference standard.23 The 7d-FD in this study was a blank 7-d FD with a half quarto (A4) size completed by instructions on how to document foods and dietary supplements consumed daily in the first page of the book. Each participant was asked to record all types of food and drink consumed including name/brand and portion size for 7 consecutive days. Parental verification was undertaken for incomplete FFQ.
Estimation of Fish Consumption
The daily amounts of each foods consumed by each child were calculated by multiplying the serving size (e.g. small, medium, large) with the daily equivalent frequency.24 For the processed-fish products, we interviewed the local sellers about amount of fish added in processing the products. The food frequency data were entered into NutriSurvey for Windows copyright © 2007 Dr. Juergen Erhardt SEAMEO-Tropmed RCCN-University of Indonesia (only for non-commercial use) to determine the types and quantities of fish consumed by each child. Similar method was applied to calculate fish consumption from the 7d-FD, which was divided by 7 and expressed in grams per day (g/d).
Statistical Analysis
Statistical analysis was carried out using Statistical Package for the Social Sciences (SPSS) software version 21.0, Chicago IL, USA. Intakes of fish were presented as mean, standard deviation (SD), median and inter quartile range (IQR). Fish consumption data were not normally distributed, the Wilcoxon Signed-Ranks test was used to assess differences in fish consumption between the FFQ and 7d FD. The Spearman’s correlation coefficient was used to assess the linier proximity relation25 between the FFQ and 7d FD. The correlation coefficients (r) were interpreted as follows: r≤0.35 indicate weak correlation, r=0.36 to 0.67 indicate moderate correlation, r=0.68 to 1 indicate good correlation with r ≥ 0.9 indicate very good correlation26,27. Bias value or 95% confidence of interval (CI) was obtained from bootstrap based on 1000 bootstrap samples.
Estimating non-parametric limits of agreement (LoA) for non-normally distributed data using Analyse-it Method Validation edition for Microsoft Excel 5.40 (copyright 1997-2019 Analyse-it Software, Ltd.) was used to quantify LoA between the FFQ and 7d-FD. The LoA was estimated using the 2.5th and 97.5th percentiles and the bias was estimated as the median of the differences (95% CI for median difference). If 95% of the differences are within ±1.96 the median of the difference, this indicates good agreement between both measurements. We expect differences in the results of fish intake measurements on the same subject in the future will be in the same limits.28
Results
The FFQ consisted of 38 species of fish including 27 species of fresh fish and 11 species of processed fish (Table 1). Mean age of total children participated in the validation study was 9.9 (SD ± 1.20) years, with sex distribution nearly same in boys (47.6%) and girls (52.4%). The characteristics of children in this study are in Table 2.
Table 1: Fish Items Assessed in the FFQ.
| Group 1: Fresh Fish | Group 2: Processed Fish Products | ||
| 1 | Bandeng (Milkfish) | 1 | Ikan wader |
| 2 | Bawal hitam | 2 | Abon ikan (Shredded fish) |
| 3 | Belanak (Mullet) | 3 | Bakso ikan (Fish ball) |
| 4 | Eel (Belut) | 4 | Bakso Tuna (Tuna ball) |
| 5 | Cakalang | 5 | Bakso udang (Shrimp ball) |
| 6 | Cucut | 6 | Bakwan udang (Fried wheat with veggie and shrimp) |
| 7 | Cumi-cumi (Squid) | 7 | Crab stik |
| 8 | Ekor kuning | 8 | Fish roll |
| 9 | Gurame | 9 | Kerupuk udang (Shrimp cracker) |
| 10 | Ikan mas (Goldfish) | 10 | Scallop |
| 11 | Jambal (Crabfish) | 11 | Tempura |
| 12 | Kakap (Snapper) | ||
| 13 | Kembung (Cat fish) | ||
| 14 | Kerapu | ||
| 15 | Lele (Catfish) | ||
| 16 | Marlin | ||
| 17 | Mujair (Tilapia) | ||
| 18 | Nila | ||
| 19 | Patin | ||
| 20 | Pindang | ||
| 21 | Salmon | ||
| 22 | Salem | ||
| 23 | Sepat (Sepat fish) | ||
| 24 | Tengiri (Macherel) | ||
| 25 | Tongkol (Cob) | ||
| 26 | Tuna | ||
| 27 | Udang (Shrimp) | ||
The fish name is local (Indonesian) name and in the bracket is English name of the fish
Table 2: Characteristics of Children Studied (n=164)
| Variables | n | % |
| Class (year) | ||
| 3 | 26 | 15.9 |
| 4 | 50 | 30.5 |
| 5 | 49 | 29.8 |
| 6 | 39 | 23.8 |
| Sex | ||
| Boy | 78 | 47.6 |
| Girls | 86 | 52.4 |
| Age (yo) | ||
| 8 | 28 | 17.2 |
| 9 | 35 | 21.3 |
| 10 | 49 | 29.9 |
| 11 | 38 | 23.1 |
| 12 | 14 | 8.5 |
Median total fish intakes determined from FFQ vs 7d-FD was 59.7 g/d vs 59.3 g/d, respectively (Table 3). There is no difference median intake of fish obtained from the FFQ and 7d-FD (Table 3).
Table 3: Comparison of Fish (g/d) Obtained from FFQ and the 7d-FD (n=164)
| Group | n (%) | FFQ | 7d-FD† | ||||
| Mean | SD | Median (IQR) | mean | SD | Median (IQR) | ||
| Sex | |||||||
| Boys | 78 | 94.1 | 72.6 | 71.9(41.5-130.1) | 88.3 | 67.5 | 67.7(37.4-117.5) |
| Girls | 86 | 77.4 | 62.9 | 56.0(34.2-107.9) | 77.8 | 59.7 | 55.2(36.0-102.4) |
| Age (y) | |||||||
| 8 | 28 | 68.9 | 58.1 | 49.4(29.9-92.1) | 65.3 | 52.6 | 48.2(29.1-89.1) |
| 9 | 35 | 86.5 | 81.7 | 48.9(29.8-145.1) | 82.4 | 78.3 | 43.4(31.8-145.3) |
| 10 | 49 | 84.8 | 62.9 | 64.6(35.9-130.2) | 83.7 | 59.1 | 63.4(35.2-119.3) |
| 11 | 38 | 95.9 | 68.6 | 77.0(45.5-117.6) | 93.8 | 61.9 | 77.8(48.9-109.1) |
| 12 | 14 | 88.8 | 68.8 | 64.6(47.4-113.9) | 86.0 | 63.4 | 63.8(49.6-108.7) |
| Total | 164 | 85.4 | 68.0 | 59.7(35.7-114.5) | 82.8 | 63.5 | 59.3*(36.9-108.3) |
FFQ, food frequency questionnaire; 7d-FD, 7-day food diary; SD, standard deviation; IQR, inter quartile range; †Average of 7d-FD; * Wilcoxon Signed-Ranks test: mean rank for FFQ and 7d-FD were 86.13 g/d and 78.87 g/d, respectively, Z=-0.489, p=0.625.
Very good correlations were found between the FFQ and the 7d-FD were observed for fish (r=0.965, p=0.001) with an acceptable 95% LoA of the two methods (95% LoA=-10.907-34.619, median difference=0.011, 95% CI for median difference=-2.408-1.193) (Table 4). The median difference between methods falls within the 95% CI for median of difference (Table 4).
Table 4: Correlation and Limit of Agreement of Fish Intake Between FFQ and the Average 7d FD.
| Analysis | Value | |
| Correlation | ||
| Spearman’s correlation coefficient | 0.965 | |
| 95% CIa | 0.973 – 0.991 | |
| p value | 0.001 | |
| Limit of agreement | ||
| 95% LoA | -10.907-34.619 | |
| Median difference | 0.011 | |
| 95% CI for median difference | -2.408-1.193 | |
| Coefficient reproducibility (%) | ||
CI, confidence interval; LoA, limit of agreement
aBias factor is the proportional bias in a univariate regression with the value intakes obtained from the FFQ were considered as the independent variable. The values obtained from bootstrap based on 1000 bootstrap samples.
Discussion
Individual’s food intake is influenced by various factors, including culture,29 availability of food at the regional level30 and family level31 which is correlated with social economic status, personal or family eating habits32 and health status or presence of disease.33 Therefore, the development of any dietary questionnaire to assess food intake should pay attention to these factors. In addition, the questionnaire also needs to be validated for certain age groups,34 and this is especially related to the ability in understanding and completing the questionnaire at different life stages. Hence, the validated questionnaire will generate reliable results of the actual individual’s dietary intake.
Median intake of fish consumption that was calculated using the FFQ developed for children in this study was similar to the estimates obtained from the 7d-FD as reference method in children.35 This could be explained due to cultural factor related to fish consumption habit and geographical position of Indonesia36 as oceanic country which influence the availability of fish in community. It has been reported that fish contibutes 53.7% of animal protein consumed by Indonesian compared to meat and eggs/milk of 23.2% and 23.1%, respectively. In 2015, seafood consumption in Indonesia is roughly 32 kg per capita per year, which is nearly double the global average suggested by FAO. According to the National Individual Food Consumption Survey of Indonesian in 2014, it has been reported that protein consumption rate of children aged 5-12 years was 134.5% with fish contributed the highest protein intake (78.4 g/d) then meat (42.8 g/d) as well as egg and their processed (19.7 g/d).37 Studies in school children showed that dietary intake data obtained from FFQ tend to overestimate true intake than from repeated dietary food record such as 7d FD,23 3d dietary record (3DR),38 as well as 7d weighed records.39
Measurement of food intake using a questionnaire mostly relies on the individual’s cognitive aspects which then is considered as the actual intake value or latent variable.28 This is likely to cause various errors, given the individual’s ability in remembering foods that has been consumed and interpreting portion size of the foods are rely on cognitive aspects, especially in children. Children’s self-reporting about food intake is a complex task, involving many aspects of children’s cognitive related to memory, perception and conception.40 It has been reported that cognitive aspects of children in completing food records can be improved through the use of assisted tool in determining food types and portions, for example using pictures, models and food photographs.41 Therefore, activities in designing FFQ for children are encouraged to involve various strategies in order to improve children’s memories in recalling their food eaten,42 so that their food records are approaching their actual food intake. Research shows that the use of food photos specifically designed to predict children’s portion sizes is more accurate (1% average estimate) than using photos designed for adults (over 45% mean).43 In our study, a fish model image book was developed specifically to help children in completing the FFQ especially in remembering the food they have consumed as well as the portion size.
The limitation of this study is the lack of a dietary biomarker (e.g. erythrocyte fatty acids analysis) and hence the lack of using the method of triads to triangulate the “true dietary intake”,44,45,46,47 however, it is difficult to obtain blood samples from children. Although a study in the USA managed to measure children’s erythrocyte membrane levels of n-3 LCPUFA and validate their FFQ. In this study the parents completed the FFQ as the children’s ages ranged from 1-11 years old and their total n-3 PUFA and marine PUFA (i.e. n-3 LCPUFA), expressed as percentage of total dietary fat, were associated with the percent total n-3 PUFA and marine n-3 LCPUFA in erythrocyte membranes.47 Similar results have also been reported in children aged 2-8 years old in Montreal, where red blood cell DHA and EPA positively associated with mean n-3 LCPUFA-rich fish intake from FFQ.48
In conclusion, the FFQ developed in this study demonstrates a valid tool to assess fish intakes in primary school children aged 8-12 years in Surakarta Indonesia. This study can be used as an example of how to design a FFQ based on cultural habit of specific age group which is important to obtain an accurate dietary food intake data.
Acknowledgements
This work was supported by the Universitas Muhammadiyah Surakarta through Doctorate Research Grant (Contract Number: 132.25/A.3-III/LPPM/IV/2018) for data analysis and the Ministry of Research, Technology and Higher Education of the Republic of Indonesia through World Class Professor Program (Contract Number T/76/D2.3/KK.04.05/2019) for publication of this article.
Conflict of Interest
No competing interests were identified.
Funding Source
The Ministry of Research, Technology and Higher Education of the Republic of Indonesia through World Class Professor Program (Contract Number T/76/D2.3/KK.04.05/2019)
References
- McCann JC, Ames BN. Is docosahexaenoic acid (DHA), an n-3 long chain polyunsaturated fatty acid, required for normal brain function? An overview of evidence from cognitive and behavioral tests in humans and animals: a review. Am J Clin Nutr. 2005;82:281-295.
CrossRef - Emken EA, Adlof RO, Gulley RM. Dietary linoleic acid influences desaturation and acylation of deuterium-labeled linoleic and linolenic acids in young adult males. Biochim Biophys Acta. 1994;1213:277- 288.
CrossRef - Pawlosky RJ, Hibbeln, Novotny JA et al. Physiological compartmental analysis of α-linolenic acid metabolism in adult humans. J Lipid Res. 2001;42:1257-1265.
CrossRef - Burdge GC, Finnegan YE, Minihane AM et al. Effect of altered dietary n-3 fatty acid intake upon plasma lipid fatty acid composition, conversion of [13 C]α-linolenic acid to longer-chain fatty acids and partitioning towards β-oxidation in older men. Br J Nutr. 2003;90:311-321.
CrossRef - Vlaardingerbroek H, Hornstra G, de Koning TJ et al. Essential polyunsaturated fatty acids in plasma and erythrocytes of children with inborn errors of amino acid metabolism. Mol Genet Metab. 2006;88:159-165.
CrossRef - Brenna JT, Salem N Jr, Sinclair AJ et al. Alpha-Linolenic acid supplementation and conversion to n-3 long-chain polyunsaturated fatty acids in humans. Prostaglandins Leukot Essent Fatty Acids. 2009;80(2-3):85-91.
CrossRef - McNamara RK, Carlson SE. Role of omega-3 fatty acids in brain development and function: potential implications for the pathogenesis and prevention of psychopathology. Prostaglandins Leukot Essent Fatty Acids. 2006;75(4-5):329-349.
CrossRef - Murphy K, Meyer BJ, Mori TA et al. Impact of foods enriched with omega-3 long chain polyunsaturated fatty acids on erythrocyte omega-3 levels and cardiovascular risk factors. Br J Nutr. 2007;97:749-757.
CrossRef - Amiano P, Dorronsoro M, M de Renobales et al. Very-long-chain ω-3 fatty acids as markers for habitual fish intake in a population consuming mainly lean fish: the EPIC cohort of Gipuzkoa. Eur J Clin Nutr. 2001;55:827-832.
CrossRef - Oddy WH, Sherriff JL, Kendall GE et al. Patterns of fish consumption and level of serum phospholipid very-long-chain omega-3 fatty acids in children with and without asthma, living in Perth, Western Australia. Nutr Diet. 2004;61:30-37.
- Yep YL, Li D, Mann NJ et al. Bread enriched with microencapsulated tuna oil increases plasma docosahexaenoic acid and total omega-3 fatty acids in humans. Asia Pac J Clin Nutr. 2002;11:285-291.
CrossRef - Gillingham LG, Caston L, Leeson S et al. The effects of consuming docosahexaenoic acid (DHA)-enriched eggs on serum lipids and fatty acid composition in statin-treated hypercholesterolemic male patients. Food Res International. 2005;38:1117-1123.
CrossRef - Baró L, Fonallá J, Peña JL et al. n-3 fatty acids plus oleic acid supplemented milk reduces total and LDL cholesterol, homocysteine and levels of endothelial adhesion molecules in healthy humans. Clin Nutr. 2003;22:175-182.
CrossRef - Garg ML, Blake RJ, Clayton E et al. Consumption of an n-3 polyunsaturated fatty acid-enriched dip modulates plasma lipid profile in subjects with diabetes type II. Eur J Clin Nutr. 2007;61:1312-1317.
CrossRef - Vuholm S, Teisen MN, Buch NG et al. Is high oily fish intake achievable and how does it affect nutrient status in 8-9 year old children?: the FISK Junior trial. Eur J Nutr. https://doi.org/10.1007/s00394-019-01981-y.
CrossRef - Vuholm S, Rantanen JM, Teisen MN et al. Effect of oily fish intake on cardiometabolic markers in healthy 8-to 9-y-old children: the FiSK Junior randomized trial. Am J Clin Nutr. 2019. doi: 10.1093/ajcn/nqz233.
CrossRef - Kim JL, Winkvist A, Åberg MA et al. Fish consumption and school grades in Swedish adolescents, a study of the large general population. Acta Paediatrica. 2010;99:72-77.
CrossRef - Åberg MA, Åberg N, Brisman J et al. Fish intake of Swedish male adolescents is a predictor of cognitive performance. Acta Paediatr. 2009;98:555-560.
CrossRef - Theodore RF, Thompson JMD, Waldie KE et al. Dietary patterns and intelligence in early and middle childhood. Intelligence. 2009;37:506-513.
CrossRef - Birberg-Thornberg U, Karlsson T, Gustafsson PA et al. Nutrition and theory of mind-The role of polyunsaturated fatty acids (PUFA) in the development of theory of mind. Prostaglandins Leukot Essent Fatty Acids. 2006;75:33-41.
CrossRef - Thompson FE, Subar AF. Dietary assessment methodology. In: Coulston A, Boushey C, Ferruzzi M, Delahanty L. Nutrition in the prevention and treatment of disease (4th Edition). 2017:5-48. Elsevier Inc. doi: http://dx.doi.org/10.1016/B978-0-12-802928-2.00001-1.
CrossRef - Sharma S, Cade J, Jackson M et al. Development of food frequency questionnaires in three population samples of African origin from Cameroon, Jamaica and Caribbean migrants to the UK. Eur J Clin Nutr. 1996;50:479-486.
- Rahmawaty S, Charlton K, Lyons-Wall P et al. Development and validation of a food frequency questionnaire to assess omega-3 long chain polyunsaturated fatty acid intake in Australian children aged 9-13 years. J Hum Nutr Diet. doi: 10.1111/jhn.12439.
CrossRef - Cancer Council Victoria. Dietary questionnaire for epidemiological studies version 2 (DQES v2), User information guide. 2012. Available at: http://www.cancervic. org.au\dges: accessed on September 2012.
- Taylor BN, Kuyatt E. Guidelines for evaluating and expressing the uncertainty of NIST measurement results. National Institute for Standards and Technology. 1994. Available at: http://physics.nist.gov/Pubs/guidelines/TN1297/tn1297s.pdf: accessed on April 2013.
- Weber JC,Lamb DR. Statistics and Research in Physical Education. St. Louis: CV Mosby Co. 1970:59-64.
- Mason RO, Lind DA, Marchal WG. Statistics: An Introduction. New York: Harcourt Brace Jovanovich, Inc. 1983;368-383.
- Bartlett JW, Frost C. Reliability, repeatability and reproducibility: analysis of measurement errors in continuous variables. Utrasound Obstet Gynecol. 2008;31:466-475.
CrossRef - James, DCS. Factors influencing food choices, dietary intake, and nutrition-related attitudes among African Americans: Application of a culturally sensitive model. Ethnicity and Health. 2004;9(4):349-67.
CrossRef - Kearney J. Food consumption trends and drivers. Philos Trans R Soc Lond B Biol Sci. 2010;365(1554):2793-2807.
CrossRef - Santiago-Torres M, Adams AK, Carrel AL et al. Home food availability, parental dietary intake, and familial eating habits influence the diet quality of urban Hispanic children. Child Obes. 2014;10(5):408-15.
CrossRef - Scaglioni S, De Cosmi V, Ciappolino V et al. Factors influencing children’s eating behaviours. Nutrients. 2018;10(6):706. doi: 10.3390/nu10060706.
CrossRef - Katona P, Katona-Apte J. The interaction between nutrition and infection. Clin Infect Dis. 2008; 46:1582-1588.
CrossRef - Kaaks R, Ferrari P. Dietary intake assessments in epidemiology: can we know what we are measuring? Ann Epidemiol. 2006;16:377-380.
CrossRef - Persson LÅ, Carlgren G. Measuring children’s diet: Evaluation of dietary assessment techniques in infancy and childhood. Int J Epidemol. 1984;13:506-517.
CrossRef - Dirjen PDSPKP (Director General of Strengthening Competitiveness of Marine and Fishery Products). Gerakan memasyarakkan makan ikan; 2017 [cited 2018 September 5]. Available from: http://gizi.depkes.go.id/peringatan-hari-gizi-nasional-ke-57-tahun2017/ gemarikan -kemenkes-250117.
- Health Research and Development Agency. Buku Studi diet total: Survey konsumsi makanan individu (The total diet study book: Survey of individual food consumption) 2014.
- Koo HC, Lim GP, Kaur S et al. Development, validity and reproducibility of a whole grain food frequency questionnaire in Malaysian children. Nutr J. 2020; 19 (73). https://doi.org/10.1186/s12937-020-00588-y.
CrossRef - Pampaloni B, Bartolini E, Barbieri M et al.Validation of a food-frequency questionnaire for the assessment of calcium intake in schoolchildren aged 9–10 years. Calcif Tissue Int. 2013;93:23-38.
CrossRef - Nelson M, Atkinson M, Darbyshire S. Food photography I: The perception of food portion size from photographs. Br J 1994;72:649-663.
CrossRef - Subar AF, Crafts J, Zimmerman TP et al. Assessment of the accuracy of portion size reports using computer-based food photographs aids in the development of an automated self-administered 24-hour recall. J Am Diet Assoc. 2010;110:55-64.
CrossRef - Baranowski T, Domel SB. A cognitive model of children’s reporting of food intake. Am J Clin Nutr. 1994;59(suppl):212S-217S.
CrossRef - Foster E, Matthews JN, Nelson M et al. Accuracy of estimates of food portion size using food photographs – the importance of using age-appropriate tools. Public Health Nutr. 2006;9:509-14.
CrossRef - Zhang B, Wang P, Chen C et al. Validation of an FFQ to estimate the intake of fatty acids using erythrocyte membrane fatty acids and multiple 3d dietary records. Public Health Nutr. 2010;13:1546-1552.
CrossRef - Bandini LG, Cyr H, Must A et al. Validity of reported energy in preadolescent girls. Am J Clin Nutr. 1997;65:1138S-1141S.
CrossRef - Vereecken CA, Maes L. A Belgian study on the reliability and relative validity of the Health Behaviour in School-Aged Children food-frequency questionnaire. Public Health Nutr. 2003;6:581-588.
CrossRef - Orton HD, Szabo NJ, Clare-Salzler M et al. Comparison between omega-3 and omega-6 polyunsaturated fatty acid intakes as assessed by a food frequency questionnaire and erythrocyte membrane fatty acid composition in young children. Eur J Clin Nutr. 2008;62:733-738.
CrossRef - Parks CA, Brett NR, Agellon S et al. DHA and EPA in red blood cell membranes are associated with dietary intakes of omega-3-rich fish in healthy children. Prostaglandins Leukot Essent Fatty Acids. 2017;124:11-16. doi: 10.1016/j.plefa.2017.08.003.
CrossRef
Accepted on: 26 Feb 2021
Second Review by: Levent Bat Turkey
Final Approval by: Dr. Krešimir Mastanjević


Web of Science Coverage
Emerging Sources Citation Index (ESCI)
2024 Journal Impact Factor: 1.1
Scopus Journal Metrics
CiteScore 2025: 2.6
CiteScore Details
Sustainable Nutrition: Food Systems, Nutrient Retention, and Public Health Impact
![]()
This journal is a member of, and subscribes to the principles of, the Committee on Publication Ethics (COPE)


