Mathematical Approach for Estimation of Alginate-Iron Salt Solutions Viscosity at Various Solid Concentrations and Temperatures
Indrasukma Permanadewi
, Dyah Hesti Wardhani and Nita Aryanti Department of Chemical Engineering, Faculty of Engineering, Universitas Diponegoro Jl. Prof Soedarto, SH, Tembalang, Semarang– Indonesia.
Corresponding Author Email: andrewkomoro@che.undip.ac.id
DOI : http://dx.doi.org/10.12944/CRNFSJ.9.1.08
Download this article as:
![]()
Alginate has been widely used in the pharmaceutical industries as tablet binder and disintegrant, release agent and controlled release drug delivery system. Whereas in the food industries, alginate is generally employed as thickener, emulsifier, stabilizer, texturizer, formulation aid, firming agent, flavor adjuvant, and surface-active agent. As one of the important raw materials in the functional food preparation, iron is hard to manage due to its vulnerability to oxidization, degradation and possesses a strong unique aroma. Considering its superior coating and release properties, alginate gel can be the best choice to preserve iron from various undesirable effects. Unfortunately, there has been lack information in the published literature to estimate the effect of temperature, concentration, and stirring time on the mechanical properties of alginate. Although many mathematical models have been developed based on these factors to predict the viscosity of the alginate-Fe solutions used as feed in spray drying application, no clear information have been reported for their accuracy. This study aims to examine four physical models for their suitability in estimating alginate-Fe solution viscosity, namely the Walther, Mark Houwink, Vogel – Tamman – Fulcher (VTF), and Intrinsic models. Prior to model validation, alginate-Fe solutions containing alginate: Fe (2:1) mass ratio were prepared. They were heated to desirable temperatures (30°, 45°, 60°, and 75°C), stirred for various stirring times (0 to 60 minutes), and subjected to viscosity measurement. The results exhibited that the viscosity of alginate-Fe solution with 5% alginate concentration stirred for 15 minutes at 30°C reached 320 cP. Whereas the viscosity of Alginate-Fe solution with 1% (m/m) concentration at the same temperature and stirring time was only 250 cP. This observation suggested that a higher alginate solution concentration leads to a higher the viscosity. As expected, a higher temperature and longer stirring time resulted in the decline of the Alginate-Fe solution viscosity. Although the proposed models demonstrated the similar trend, it can be concluded that the Walther model was proven to be the most accurate model used for the prediction of the Alginate-Fe solution viscosity compared to the other models as shown by its highest R2 value, which was 0.987.
KEYWORDS:Alginate-Fe Solution; Concentrations; Physical Model; Stirring Time; Temperatures; Viscosity
Introduction
Alginate is a kind of polycarbohydrate that is generally utilized in various industrial applications, such as pharmaceutical, biomedicine, food and agricultural industries.1 Even though the types of the alginates used are also diverse, i.e. alginic acid, calcium alginate, ammonium alginate and sodium alginate, sodium alginate being the most popular alginate used in the industries. Alginic acid is insoluble in aqueous media, whereas sodium alginate is easily soluble in water containing alkali metals, ammonia, low molecular weight amines and quaternary ammonium compounds.2 During storage, alginate can undergo degradation due to the presence of oxygen, especially when exposed to air with the increase in humidity. The order (from highest to lowest) of stability capacity of alginate during storage is sodium alginate, ammonium alginate and by alginic acid.3
Alginates originated from brown algae (Phaeophyceae) bears block (1,4) -linked β-residue d-mannuronate and α-l-guluronate. Depending on the time of harvest and the anatomy of the plants, every species of brown algae brings distinctive kinds of alginate with guluronic acid (G) to mannuronic acid (M) ratio.4 Alginates which contain high guluronic acid (G) exhibit a stiffer structure and larger porosity, while those contain high mannuronic acid (M) demonstrate a less rigid structure. Therefore, alginates with higher G content can provide a stronger gel.5 It has been reported in the literature that the solubility and water-binding ability of alginates are strongly affected by the number of carboxylic ions, molecular weight, and pH. The ability of alginate to bind water increases with the increase of the number of carboxylic ions, and the amount of calcium alginate residue is lower than 500. Sodium alginate solution is stable at a wide pH range from 4 to 10. Accordingly, gel formation or precipitation of alginate should happen at pH below 4 along with the conversion of sodium alginate to insoluble alginic acid.2
The ability of alginate to form gels can be either advantages and disadvantages for some specific industries. Fertilizer industries will certainly consider this a weakness because they do not require alginate sol6ution viscosity as an important variable in their manufacturing process.6 However, for some industries, such as the food, textile and pharmaceutical industries, which require a specific value of alginate solution viscosity will regard this characteristic as an advantage. Pharmaceutical industries use of alginate gels to encapsulate their raw materials and products that are vulnerable to degradation or alteration of specific taste and aroma.1 Calcium alginate and xanthan gum have been successfully applied to encapsulate Aspergillus oryzae and lipase.7 Sodium alginate has also been utilized to encapsulate ascorbic acid and iron with spray drying to protect them from oxidation.8,9 As one of the important raw materials in the functional food preparation, iron is hard to manage due to its vulnerability to oxidization or degradation, which results in an unpleasant taste and odor. Based on their excellent coating properties, alginates are regarded as the appropriate choices to protect iron from oxidization or degradation by undesirable environments. However, the selection of alginate concentration is one of the key parameters of the successful encapsulation method. This is because alginate concentrations above 1% (m/m) possesses a high viscosity value, which can induce the formation of thick capsule walls leading to serious release difficult of the active substances trapped by encapsulation material. In contrast, alginate solution at concentrations below 1% (m/m) has a lower viscosity, which produce weak capsule walls in trapping the active substance.8Furthermore, temperature also strongly influence alginate viscosity and gel strength. The alginates treated by heating up to 120°C exhibited low value of gel strength.10 At higher temperatures, alginates can undergo depolymerization leading to widely open the gel structure and increase in particle size and gel porosity. Finally, the alginate gels structure will be less rigid.11 Considering these influential factors, it is clear that to prepare appropriate solution for encapsulation process an accurate solution viscosity prediction is required by which solution viscosity prediction modeling will definitely simplify the task.The modeling of solution viscosity can be categorized into two, namely the dynamic modeling and kinematic modeling. Although both approaches have the similar function to predict the solution viscosity, but the tools utilized to measure the viscosity are different.12 Dynamic viscosity modeling includes the Arrhenius, Vogel – Tamman – Fulcher (VTF), Urbain, Iida and National Physical Laboratory (NPL) models.13 Whereas the kinematic viscosity modeling includes the Walther, Wright, Mark Houwink and Seeton models. This study aims to investigate the effect of alginate-Fe concentration, temperature and stirring time on the viscosity of Alginate-Fe solution; and to find the most suitable physical model for the prediction of the viscosity of Alginate-Fe solution.
Materials and Methods
Materials
The materials used in this study were food grade alginate with a glass transition temperature (Tg) value of 95.3°C and Iron (II) Sulfate Heptahydrate, which had water solubility 48.6 g/100 ml at 50°C (Merck kGaA, Germany)
Preparation of Alginate-Fe solution
Alginate-Fe solution containing 1% solid alginate and 0.5% Fe mass concentration was prepared by dissolving 5 grams of alginate and 2.5 grams of Fe in 500 ml of aquadest in a 1000 ml beaker glass. The alginate-Fe mixture was stirred using a magnetic stirrer at 600 rpm for 15 minutes at 30oC in an automatically controlled water bath heater. The same procedure was used for the preparation of solutions containing solid alginate and Fe with alginate:Fe pair mass concentrations of (2%:1%, 3%:1.5%, 4%:2%, and 5%: 2.5%) at various stirring times (30, 45, and 60 minutes) and temperatures (30oC, 45oC, 60oC, and 75°C).
Kinematic Viscosity Determination
The Alginate-Fe solution viscosities were determined by measuring the viscosity of 10 ml solution using a Cannon Fenske viscometer. The solution was carefully introduced into the capillary tube and sucked using a rubber hose until the solution surface was slightly higher than the upper limit. The liquid was then let to flow freely from the upper boundary to precisely reached the lower boundary line and the required time was recorded. Finally, the viscosity of the Alginate-Fe solution was calculated using the equation:
![]()
where vs, ts and ρs are respectively the kinematic viscosity (m2/s), flow time of solution from upper boundary (S1) to lower boundary (S2) (s) and density of the solution (kg/m3). The tw, ρw and vw are the flow time from S1 to S2 (s), density (kg/m3) and viscosity of water (m2/s) at reference condition (25oC and 1 atm).
Dynamic Viscosity Determination
The viscosity of 750 ml of Alginate-Fe solution was determined using a Brookfield DV-II + Pro rotational viscometer. The solution was introduced into a 1000 ml beaker glass just right below the spindle. The spindle was then gently dipped into the solution to the specified limit. Upon selecting the rotation speed at 100 rpm, then the ON button was activated allowing the spindle to rotate and smoothly stir the solution. The viscosity that appeared in the screen according to the spindle used was recorded.
Surface Tension Analysis
Surface tension of the Alginate-Fe solution was examined by the capillary tube method. For such surface tension determination, approximately 40 ml sample of the solution was withdrawn from the stock solution and placed in a beaker glass. Capillary tubes were then dipped into the beaker glass and the liquid was let to flow upward until it reached a static equilibrium condition. The end of the capillary tube was closed with a finger and the height was recorded. The surface tension (s) was then calculated using the equation:
![]()
where r, h, ρ and g are the capillary radius (m), height increase (m), density (kg/m3) and gravity acceleration (m/s2), respectively.
Statistical Analysis
Five different groups of experiment were performed in triplicates. The differences identified from the statistical analysis were reported as p value. Data obtained by the difference in viscosity for each concentration, temperature and time of stirring of the alginate-Fe solution were evaluated using the one-way analysis of the variance with p value = 0.05.
Modelling of Viscosity
Kinematic Viscosity
Walther Model
The Walther model has shown its superior performance for the estimation of kinematic viscosity of various liquids, which accurately describes of the temperature effect on viscosity for liquids at ambient pressure.14
![]()
where a, b, c and, d are the Walther equation constants. Accordingly, ν and T are respectively the kinematic viscosity (m2/s) and absolute temperature of the solution (K).
Mark Houwink Model
This model illustrates that kinematic viscosity (v) (m2/s) is the flow of a substance that is influenced by the gravitational force of the earth. Following that definition, the kinematic viscosity can be simply calculated by dividing the dynamic viscosity (ƞ) (mPa.s) of the liquid with its density (ρ) (kg/m3).15
![]()
Dynamic Viscosity
Vogel–Tamman–Fulcher (VTF) Model
The VTF model describes a powerful correlation between dynamic viscosity and temperature of a food system using its glass transition temperature (Tg) as a specific parameter.16
![]()
where ƞ is dynamic viscosity (Pa.s), T is temperature (°C), Tg is glass transition temperature (°C). In addition, two constants, A and B are used as adjustable parameters.
Intrinsic Viscosity model
Intrinsic viscosity (ƞ) can be calculated by utilizing data obtained from various solution concentrations through the extrapolation of intrinsic viscosity to zero concentration. 17
![]()
The relative viscosity values (ƞr), specific viscosity (ƞsp) and reduced viscosity (ƞz) are obtained from experimental absolute viscosity values. Where ƞ0 is the absolute viscosity of water (mPa.s) and C is the solution concentration (g/ml). Intrinsic viscosity (ƞ) is calculated by extrapolation to zero concentration.
Results and Discussion
Viscosity testing can be utilized as a pre-identification in the determination of the quality, consistency, and stability of a food product. This study helps to estimate the values of viscosity of Alginate-Fe solutions at various temperatures and concentrations using some viscosity estimation models, namely the Walther model, Mark Houwink model, VTF model and Intrinsic model. The experimental data and modelling results of the Alginate-Fe solutions at various experimental conditions are presented in Fig. 1 to Fig. 5 for kinematic viscosity, Fig. 6 to Fig. 10 for dynamic viscosity and Fig. 11 for the intrinsic viscosity. In addition, the surface tension of the Alginate-Fe solutions at various experimental conditions and modelling results are depicted in Fig. 12 to Fig. 16. The constants and R2 of the models evaluated in this study are presented in Table 1 and Table 2 for kinematic and dynamic viscosities, respectively.
Effect of Temperature
In this study, the Alginate-Fe solution was heated at 30°C, 45°C, 60°C and 75°C. When heated at 30°C to 45°C, no significant change in viscosity of Alginate-Fe solution was observed (see Fig. 1 to Fig. 5). However, more pronounced changes in viscosity were obvious as the solutions were heated at 60°C and 75°C. As seen in Fig. 2, the kinematic viscosity values of Alginate-Fe solutions containing 2% (m/m) alginate with mixing time of 60 minutes were 1.50 × 10⁻⁴ m2/s and 1.00 × 10⁻⁴ m2/s at a temperature 30°C and 60°C, respectively. This decrease was also observed for their dynamic viscosity values (Fig. 7). At 30°C the dynamic viscosity was 239 mPa.s, while at 60°C its decreased to 232 mPa.s. As expected, this decrease in viscosity applies to all Alginate-Fe solutions concentrations used in this study. This finding agrees well previous report on alginate solutions where the viscosity decreased by 2.5% (m/m) as its temperature was risen by one-degree Celsius. Furthermore, the alginate solution may undergo depolymerization if it is kept above 50°C for several hours, which lead to permanent loss of its viscosity.18 Water evaporation also potentially affected sodium alginate solution when it was heated above 30°C.19 As expected, at temperature beyond 45°C the viscosity of sodium alginate solution decreased with increasing temperature. This observation confirmed that sodium alginate solutions underwent mesophase under these conditions and differences in temperature can trigger differences in molecular mobility and phase transition kinetics. Moreover, the rise in Fe-alginate solution temperature induced the degradation of the alginate polymer chain during the heating process and resulted in molecular destruction. Finally, the long-chain backbone components of the alginate polymer damaged due to chain cutting and reacted with each other to alter the nature of the polymer.20 The higher the temperature, the larger the number of alginate polymer chains degraded, causing a breakdown of glycoside bonds. As a result, the molecular weight of the alginate leading to significant decrease in its viscosity.
This viscosity data was then modeled based on the types of viscosity. Dynamic viscosity is represented by the VTF and intrinsic models, while the kinematic viscosity is estimated using the Walther model and the Mark Houwink model. The four models showed similar trend in describing the relationship between viscosity and temperature, i.e. as the temperature increases, the viscosity of the solution substantially declines. As depicted in Fig. 2, the Walther and Mark Houwink models show kinematic viscosity estimation results that are which are very close with the experimental results for Alginate-Fe solution with alginate concentration of 2% (m/m) at 30°C with 15 minutes stirring time (1.09 × 10⁻⁴ m2/s). In the case of Mark Houwink’s model, the dynamic viscosity calculated using the VTF model divided by solution density. Although the results of the calculation of the Walther model and Mark Houwink’s model are not entirely the same as the results of the experiment, they were not significantly different (p < 0.05). However, the Walther model shows a higher R2 value than that of the Mark Houwink model (Table 2), which indicates that the Walther model is more precise for viscosity estimation compared to the Mark Houwink model.
Similar viscosity profile is also shown by the VTF model. Fig. 6 presents that the experimental dynamic viscosity of Alginate-Fe solution with 2% (m/m) alginate concentration at 30°C with 15 minutes stirring time of is 253 mPa.s, while the viscosity value calculated using the VTF model is 251.29 mPa.s. Indeed, the VTF model provides excellent viscosity prediction results. As for the intrinsic viscosity estimation, the proposed model calculates the specific viscosity value, which is then divided by the viscosity at zero concentration and further extrapolated using equation 6. As expected, the intrinsic viscosity decreases as the solution temperature increases (Fig. 11). However, basically the VTF and the Intrinsic models cannot be compared with the Walther and the Mark Houwink models, because the types of the estimated viscosity are different. Of course, their accuracy in predicting the dynamic viscosity can be confirmed from the R2 value. Of the two models, VTF model demonstrates a higher R2 value than the Intrinsic model (Table 1) indicating that the VTF model is more accurate than the Intrinsic model and the estimation results were not significantly different (p <0.05) with the experimental data.
Effect of Alginate Concentration
Alginate-Fe solution at a concentration of 1% (m/m) exhibited significant difference in both dynamic and kinematic viscosities with that of with 5% (Fig. 1 and Fig. 6). The kinematic viscosity of Alginate-Fe solution with 1% (m/m) alginate heated at 60°C with 15 minutes stirring time was 5.70 ×10⁻⁵ m2/s, while its value was 2.70 ×10⁻⁴ m2/s for Alginate-Fe solution containing 5% alginate. The same trend also applies for dynamic viscosity. For an Alginate-Fe solution containing 1% (m/m) alginate heated at 45°C with 15 minutes stirring time, its dynamic viscosity value was 157 mPa.s. Meanwhile, the dynamic viscosity of Alginate-Fe solution containing 5% (m/m) alginate prepared at the same condition was 520 mPa.s. Such increase in viscosity (from 3.82 cP to 12.74 cP) along with the increase in Alginate concentrations (from 0.25 to 1% wt) at 25°C was also revealed by previous researcher.21 The relationship between viscosity and alginate concentration in three different viscosity ranges, namely low viscosity, medium viscosity and high viscosity.22 High viscosity alginate solutions containing 1% alginate in water possess viscosities of no less than 2,000 cP at 20°C, whereas those with low viscosity should have viscosity of no higher than 30 cP. At high viscosity, when the alginate concentration is 1% wt, the viscosity is 2,000 cP and then it increases to 50,000 cP when the alginate concentration is 3% wt. Similar trend also applies for moderate and low viscosity alginate solutions. At moderate viscosity, the increase in viscosity is reported to be 200 cP at a concentration of 1% wt alginate, which then increases to 15,000 cP at a concentration of 4% wt. Overall, the high, medium and low viscosity alginates possess higher viscosity at higher alginate concentration at a given temperature.22 These observation shows that the value of the viscosity is strongly influenced by concentration of the solution. This phenomenon occurs because the concentration of the solution indicates the number of particles of matter dissolved per unit volume. The more particles dissolved, the higher the friction and interaction between the particles resulting in higher viscosity.23
The results of the viscosity estimation using the proposed mathematical models, namely the VTF, Intrinsic, Walther, and Mark Houwink models were not significantly different with the viscosity values obtained from experiments (Fig. 2 and Fig. 5). For example, the kinematic viscosity values of Alginate-Fe solution with 3% (m/m) alginate concentration heated at 45°C and stirred for 30 minutes calculated using the Walther and the Mark Houwink models were 1.52 × 10⁻⁴ m2/s m2/s and 1.50 × 10⁻⁴ m2/s, respectively. Whereas its experimental value was 1.55 × 10⁻⁴ m2/s. Fig. 2 demonstrates that the kinematic viscosity value of all Alginate-Fe solution concentrations heated at temperatures of 30°C to 75°C did not different significantly with the increase in temperature. In addition, the influence of alginate concentration on the kinematic viscosity value was found to follow a linear trend. This result was confirmed by the statistical assay, which revealed that the kinematic viscosity values obtained from experiment and those estimated using Walther and Mark Houwink’s models were not significantly different (p < 0.005). However, the Walther model exhibited its superiority over the Mark Houwink model in term of R2 value (Table 1). This statistical analysis result suggested that the Walther model is more accurate than the Mark Houwink model, which is in good accordance with the result presented in the previous section.
Temperature was found to insignificantly (p < 0.005) affect the dynamic viscosity of Alginate-Fe solution (Fig. 5). In Figure 5b, the experimental dynamic viscosity of an Alginate-Fe solution with 2% (m/m) alginate concentration heated at 60°C and stirred for 30 minutes was 241 mPa.s, which was very close to its value when estimated using the VTF model (242.88 mPa.s). Statistical analysis of this result also indicated no significant difference between the VTF models and the experimental data (p < 0.005). Fig. 5 also presents the fact that many dynamic viscosity values of Alginate-Fe solution obtained from modeling calculation and the experimental results overlap one to the other. However, alginate concentration exhibited more pronounced influence to dynamic viscosity of Alginate-Fe solution. When Alginate-Fe solution contained 1% to 4% (m/m) alginate, the increase in dynamic viscosity due to an increase of 1% alginate concentration was only about 50-100 mPa.s. (Fig. 6 to Fig. 9). However, a sharper increase of dynamic viscosity of Alginate-Fe solution was observed for Alginate-Fe solution containing 5% alginate, where the dynamic viscosity increases up to 200 mPa.s from that of Alginate-Fe solution containing 4% alginate. (Fig. 10). In addition to the VTF model, this dynamic viscosity value was also evaluated using the Intrinsic model. Although both models resulted in satisfactorily viscosity estimations, the R2 value of the VTF model was higher than the Intrinsic model (Table 2). This result suggests that the VTF model is more appropriate for the prediction of Alginate-Fe solution viscosity than the Intrinsic model.
Effect of Stirring Time
Because as the alginate powder was mixed with water, they firstly developed a slightly lumpy solid-liquid system, stirring of this mixture was performed. Our observation revealed that the difference in stirring time resulted in viscosity differences at different alginate concentrations. As depicted in Fig. 3, Alginate-Fe solution containing 3% alginate heated at 30oC and stirred for 15 minutes possessed a kinematic viscosity of 1.78 × 10⁻⁴ m2/s. Extending the stirring time of this solution up to 60 minutes reduced the kinematic viscosity to 1.61 × 10⁻⁴ m2/s. Similar observation results were obtained for their dynamic viscosity values. Alginate-Fe solution containing 3% (m/m) alginate heated at 30oC and stirred for 15 minutes possessed a dynamic viscosity of 285 mPa.s. (Fig. 8). Prolonged the stirring time of this solution to 60 minutes changed the dynamic viscosity to be 269 mPa.s. Surprisingly, there was specific condition when the stirring time did not significantly affect the dynamic viscosity (Fig. 6 to Fig. 10). Stirring the Alginate-Fe solution between 30 to 60 minutes was found to only slightly decreased dynamic viscosity.
The length of stirring time turned out to affect the surface tension of the Alginate-Fe solution. It can be clearly seen in Fig. 11 that the surface stress value of Alginate-Fe solution decreases with increasing stirring time. At 15 minutes of stirring, an Alginate-Fe solution with 3% (m/m) alginate concentration at a heating temperature of 30°C exhibited a surface tension of 0.0382 N/m. Then, the value dropped to 0.0292 N/m as the solution was stirred for 60 minutes. This trend also applied to all alginate concentrations with heating temperature ranges of 30°C to 75°C. This decrease in viscosity and surface tension phenomena suggested that viscosity is a function of time. This decrease in viscosity is caused by stirring, which helps to provide a larger contact area, increase the homogeneity of the mixture and subsequently reducing the particle size. Finally, these conditions cause a rapid reduction of surface tension and dynamic viscosity.24
In kinematic viscosity, the physical models used for estimation were the Walther and the Mark Houwink models. The kinematic viscosity value of Alginate-Fe solution with 3% (m/m) alginate concentration heated at 60°C and stirred for 30 minutes calculated using the Walther and Mark Houwink models were 1.51 × 10⁻⁴ m2/s and 1.48 × 10⁻⁴ m2/s, respectively. These estimated viscosity values were not much different with that obtained from experiment, which was 1.53 × 10⁻⁴ m2/s. Statistical analysis proved that no significant difference (p < 0.005) perceived between the results of modeling calculations and experimental data.
The dynamic viscosity of Alginate-Fe solution with 2% alginate concentration heated at 45°C and stirred for 60 minutes predicted using VTF model was 242.67 mPa.s. Whereas its experimental value was 243 mPa.s. Statistical tests suggested no significant difference (p < 0.005) between these dynamic viscosity values. Hence, the VTF model demonstrated a remarkable estimation of dynamic viscosity of Fe-alginate solution. In addition to the VTF model, this dynamic viscosity values were also predicted using the Intrinsic model. Since both models cannot be directly compared due to different types of viscosity used, they were compared in terms of their R2 value (Table 2). Our result proved that the VTF model was superior to the Intrinsic model, which strongly confirmed the results obtained from the effect of temperature and alginate concentration.
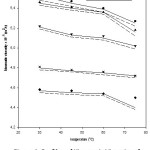 |
Figure 1: Profiles of Kinematic Viscosity of Alginate-Fe Solutions Containing 1% (m/m) Alginate Concentration at Various Temperatures and Stirring Times. |
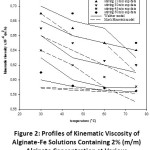 |
Figure 2: Profiles of Kinematic Viscosity of Alginate-Fe Solutions Containing 2% (m/m) Alginate Concentration at Various Temperatures and Stirring Times. |
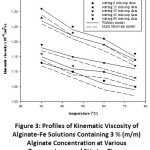 |
Figure 3: Profiles of Kinematic Viscosity of Alginate-Fe Solutions Containing 3 % (m/m) Alginate Concentration at Various Temperatures and Stirring Times. |
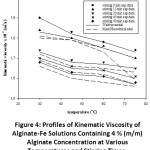 |
Figure 4: Profiles of Kinematic Viscosity of Alginate-Fe Solutions Containing 4 % (m/m) Alginate Concentration at Various Temperatures and Stirring Times. |
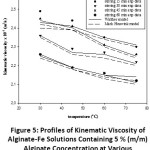 |
Figure 5: Profiles of Kinematic Viscosity of Alginate-Fe Solutions Containing 5 % (m/m) Alginate Concentration at Various Temperatures and Stirring Times. |
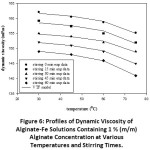 |
Figure 6: Profiles of Dynamic Viscosity of Alginate-Fe Solutions Containing 1 % (m/m) Alginate Concentration at Various Temperatures and Stirring Times. |
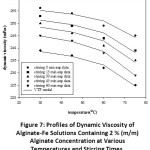 |
Figure 7: Profiles of Dynamic Viscosity of Alginate-Fe Solutions Containing 2 % (m/m) Alginate Concentration at Various Temperatures and Stirring Times. |
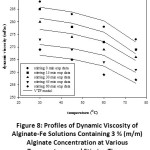 |
Figure 8: Profiles of Dynamic Viscosity of Alginate-Fe Solutions Containing 3 % (m/m) Alginate Concentration at Various Temperatures and Stirring Times. |
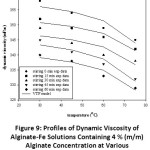 |
Figure 9: Profiles of Dynamic Viscosity of Alginate-Fe Solutions Containing 4 % (m/m) Alginate Concentration at Various Temperatures and Stirring Times. |
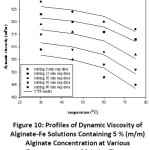 |
Figure 10: Profiles of Dynamic Viscosity of Alginate-Fe Solutions Containing 5 % (m/m) Alginate Concentration at Various Temperatures and Stirring Times. |
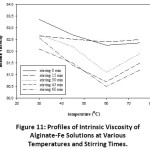 |
Figure 11: Profiles of Intrinsic Viscosity of Alginate-Fe Solutions at Various Temperatures and Stirring Times. |
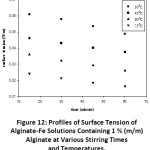 |
Figure 12: Profiles of Surface Tension of Alginate-Fe Solutions Containing 1 % (m/m) Alginate at Various Stirring Times and Temperatures. |
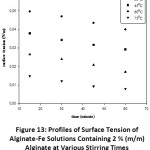 |
Figure 13: Profiles of Surface Tension of Alginate-Fe Solutions Containing 2 % (m/m) Alginate at Various Stirring Times and Temperatures. |
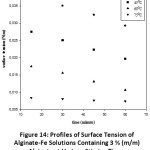 |
Figure 14: Profiles of Surface Tension of Alginate-Fe Solutions Containing 3 % (m/m) Alginate at Various Stirring Times and Temperatures. |
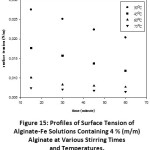 |
Figure 15: Profiles of Surface Tension of Alginate-Fe Solutions Containing 4 % (m/m) Alginate at Various Stirring Times and Temperatures. |
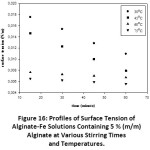 |
Figure 16: Profiles of Surface Tension of Alginate-Fe Solutions Containing 5 % (m/m) Alginate at Various Stirring Times and Temperatures. |
Table 1: Constants and Coefficient of Determination (R2) of the Kinematic Viscosity Models at Various Stirring Times and Alginate Concentrations.
| Stirring Time (min) | Walther | Mark Houwink | ||||
| a | b | c | D | R2 | R2 | |
| 0 | ||||||
| 1% alginate | 8.64 × 10⁻⁵ | 0.16 | 0.31 | 0.140 | 0.99 | 0.98 |
| 2% alginate | 13.0 × 10⁻⁵ | 1.66 | 5.33 | 3.68 × 10⁻⁴ | 0.94 | 0.96 |
| 3% alginate | 3.50 × 10⁻⁵ | 0.10 | 0.31 | 0.21 | 0.96 | 0.95 |
| 4% alginate | 1.16 × 10⁻⁵ | 0.35 | 0.23 | 0.12 | 0.98 | 0.96 |
| 5% alginate | 6.10 × 10⁻⁵ | 0.33 | 0.11 | 0.33 | 0.99 | 0.98 |
| 15 | ||||||
| 1% alginate | 3.25 × 10⁻⁵ | 0.17 | 0.20 | 0.13 | 0.95 | 0.94 |
| 2% alginate | 8.18 × 10⁻⁵ | 0.19 | 0.24 | 0.20 | 0.98 | 0.97 |
| 3% alginate | 2.12 × 10⁻⁵ | 0.80 | 0.40 | 0.10 | 0.87 | 0.85 |
| 4% alginate | 2.76 × 10⁻⁵ | 0.10 | 0.25 | 0.35 | 0.84 | 0.83 |
| 5% alginate | 6.70 × 10⁻⁵ | 0.30 | 0.15 | 0.35 | 0.94 | 0.93 |
| 30 | ||||||
| 1% alginate | 4.21 × 10⁻⁵ | 2.12 | 4.34 × 10⁻⁴ | 2.49 | 0.88 | 0.86 |
| 2% alginate | 6.72 × 10⁻⁵ | 0.15 | 0.08 | 0.36 | 0.95 | 0.95 |
| 3% alginate | 4.57 × 10⁻⁵ | 0.12 | 0.25 | 0.34 | 0.96 | 0.93 |
| 4% alginate | 1.68 × 10⁻⁵ | 0.16 | 0.36 | 0.31 | 0.87 | 0.85 |
| 5% alginate | 4.80 × 10⁻⁴ | 0.36 | 0.56 | 0.17 | 0.92 | 0.90 |
| 45 | ||||||
| 1% alginate | 3.46 × 10⁻⁵ | 4.84 | 2.63 | 3.46 × 10⁻⁴ | 0.95 | 0.94 |
| 2% alginate | 5.21 × 10⁻⁵ | 0.29 | 0.36 | 0.5 | 0.87 | 0.86 |
| 3% alginate | 2.69 × 10⁻⁵ | 0.30 | 0.46 | 0.61 | 0.98 | 0.96 |
| 4% alginate | 2.06 × 10⁻⁵ | 0.17 | 0.27 | 0.21 | 0.98 | 0.97 |
| 5% alginate | 1.80 × 10⁻⁴ | 0.41 | 0.16 | 0.31 | 0.98 | 0.96 |
| 60 | ||||||
| 1% alginate | 5.99 × 10⁻⁵ | 2.86 | 9.37 × 10⁻⁵ | 2.02 | 0.98 | 0.98 |
| 2% alginate | 4.16 × 10⁻⁵ | 0.20 | 0.13 | 0.57 | 0.88 | 0.86 |
| 3% alginate | 1.26 × 10⁻⁵ | 0.30 | 0.46 | 0.61 | 0.93 | 0.92 |
| 4% alginate | 1.29 × 10⁻⁵ | 0.40 | 0.20 | 0.40 | 0.92 | 0.94 |
| 5% alginate | 3.80 × 10⁻⁴ | 0.50 | 0.10 | 0.60 | 0.85 | 0.84 |
Table 2: Constants and Coefficient of Determination (R2) of Dynamic Viscosity Models at Various Stirring Times and Alginate Concentrations.
| Stirring time (min) | VTF | Intrinsic | ||
| A | B | R2 | R2 | |
| 0 | ||||
| 1% alginate | 164.74 | 1.24 | 0.86 | 0.80 |
| 2% alginate | 260.34 | 1.29 | 0.97 | |
| 3% alginate | 292.26 | 1.46 | 0.92 | |
| 4% alginate | 361.73 | 1.02 | 0.97 | |
| 5% alginate | 530.62 | 0.57 | 0.99 | |
| 15 | ||||
| 1% alginate | 161.73 | 1.31 | 0.86 | 0.52 |
| 2% alginate | 257.49 | 1.59 | 0.85 | |
| 3% alginate | 288.02 | 1.52 | 0.91 | |
| 4% alginate | 355.10 | 0.79 | 0.82 | |
| 5% alginate | 525.82 | 0.53 | 0.94 | |
| 30 | ||||
| 1% alginate | 157.51 | 1.15 | 0.65 | 0.45 |
| 2% alginate | 255.16 | 1.74 | 0.97 | |
| 3% alginate | 282.77 | 1.35 | 0.92 | |
| 4% alginate | 350.83 | 0.83 | 0.87 | |
| 5% alginate | 522.15 | 0.66 | 0.92 | |
| 45 | ||||
| 1% alginate | 155.25 | 1.40 | 0.56 | 0.43 |
| 2% alginate | 252.53 | 2.00 | 0.93 | |
| 3% alginate | 276.13 | 1.23 | 0.94 | |
| 4% alginate | 348.98 | 1.06 | 0.88 | |
| 5% alginate | 517.39 | 0.72 | 0.98 | |
| 60 | ||||
| 1% alginate | 152.84 | 1.63 | 0.85 | 0.52 |
| 2% alginate | 245.20 | 1.78 | 0.86 | |
| 3% alginate | 271.90 | 1.25 | 0.96 | |
| 4% alginate | 344.12 | 0.96 | 0.93 | |
| 5% alginate | 512.84 | 0.78 | 0.85 | |
Conclusion
The accuracy of four mathematical models for estimation of Alginate-Fe solution viscosity have been evaluated in this study. The Walther and Mark Houwink’s models were applied for prediction of kinematic viscosity, while the VTF and Intrinsic models were used for estimation of dynamic viscosity. The three models, namely the Walther, Mark Houwink and VTF models demonstrated excellent viscosity prediction as indicated by their close estimated viscosity values with those of experimental data and their differences were statistically insignificant (p < 0.05). The effects of temperature, alginate concentration and stirring time on Alginate-Fe solution viscosity exhibited similar trends. The Walther model showed its superior R2 value compared to the Mark Houwink model, while the VTF model exhibited higher R2 value compared to the Intrinsic model. As a conclusion, with the exception of Intrinsic model, the physical models tested in this study can be used to estimate the viscosity of Alginate-Fe solution with satisfactorily results. However, the Walther model was proven to be the most accurate model used for the prediction of the Alginate-Fe solution viscosity compared to the other models as shown by its highest R2 value, which was 0.987.
Acknowledgement
The authors gratefully acknowledge the Institute of Research and Community Service Universitas Diponegoro, which facilitated the selection of this research under Hibah Penelitian Disertasi Doktor (Doctorate Dissertation Research Scheme) 2019.
Funding Sources
This research was supported by the Directorate of Research and Community Service, Ministry of Research, Technology and Higher Education the Republic of Indonesia as explained in the acknowledgment through the Disertasi Doktor Scheme – 2019 with a grant number: 101-186/UN7.P4.3/PP/2019.
Conflict of Interest
The authors declare that they have no conflict of interest.
References
- Szekalska M., Pucilowska A., Szymanska E., Ciosek, P., Winnicka, K. Alginate: Current Use and Future Perspectives in Pharmaceutical and Biomedical Applications. Int J Polym Sci. 2016; 17: 7697031.
CrossRef - Pawar S.N., Edgar K. J. Alginate Derivatization: A Review of Chemistry. Properties and Applications. Biomater. 2012; 33(11): 3279 – 3305.
CrossRef - Zhanjiang, F. Training Manual of Gracilaria Culture and Seaweed Processing in China. Regional Sea farming Development and Demonstration Project China. 1990.
- Robinson D. S. Food Biochemistry and Nutritional Value. New York: Longman Scientife. Jhon Willey & Sons; 1987.
- Murtaza G., Waseem A., Nisar ur R., Hussain J. Alginate Microparticles for Biodelivery: A review. Afr J Pharm Pharmacol. 2011; (5):2726 – 2737.
CrossRef - Dhargalkar V. K., Pereira N. Seaweeds: Promising Plants of The Millenium. Sci Cult. 2005. 71: 60 – 66.
- Thu T. T. M., Wunwisa K. Encapsulation of protease from Aspergillus Oryzae and Lipase from Thermomyces Lanuginoseus Using Alginate and Different Copolymer Types. Agric Nat Resour. 2016; 50:155 – 161.
CrossRef - Katuwavilla N. P., Perera A. D. L. C., Dahanayake D., Karunaratne V., Gehan A.J. Amaratunga G. A. J., Karunaratne D. N. Alginates Nanoparticles Protect Ferrous from Oxidation: Potential Iron Delivery System. Int J Pharm. 2016; 513: 404 – 409.
CrossRef - Marcela F., Lucía C., Esther F., Elena M. Microencapsulation of L-Ascorbic Acid by Spray Drying Using Sodium Alginate as Wall Material. J Encapsulation Adsorpt Sci. 2016; (6): 1– 8.
CrossRef - Leo W. J., McLoughlin A. J., Malone D. M. Effects of Sterilization Treatments on Some Properties of Alginate Solutions and Gels. Biotechnol Prog. 1990; (6):51–53.
CrossRef - Gacesa P. Alginates. Carbohydr Polym. 1988; 8:161–182.
CrossRef - Sun Y., Schemann A., Held C., Lu X., Shen G., Ji X. Modeling Thermodynamic Derivative Properties and Gas Solubility of Ionic Liquids with ePC-SAFT. Ind Eng Chem Res. 2019; (58)19: 8401 – 8417.
CrossRef - Slezak M. Mathematical Models for Calculating the Value of Dynamic Viscosity of a Liquid. Arch Metall Mater. 2015;60 (2): 582 – 589.
CrossRef - Knežević D., Savić V. Mathematical Modelling of Changing of Dynamic Viscosity, as a Function of Temperature and Pressure, of Mineral Oils for Hydraulic System. Facta Univ Mech Eng. 2006; 4(1): 27 – 34.
- Gómez-Díaz D., Navaza J. M., Quintáns-Riveiro L. C. Effect of Temperature on the Viscosity of Honey. Int J Food Prop. 2009;12 (2):396-404.
CrossRef - Ollett A. L., Parker R. The Viscosity of Supercooled Fructose and Its Glass Transition Temperature. J Texture Stud. 1990; 21(3): 355 – 362.
CrossRef - Rey F., Ferreira M. A., Facal P., Machado A. A. S. C. Effect of Concentration, pH, and Ionic Strength on The Viscosity of Solutions of a Soil Fulvic Acid. Can J Chem. 1996; (74): 295 – 299.
CrossRef - McHugh D. J. Production, Properties and Uses of Alginates. Rome: Food and Agriculture Organization of The United Nations;1987
- Li Y. Y. Isolation and Characterization of Alginate from Hongkong Brown Seaweed an Evaluation of The Potential use of The Extracted Alginate as Food Ingredient. Master Thesis. Hong Kong: The Chinese University of Hong Kong; 2000.
- Brebu M., Vasile C. Thermal Degradation of Lignin – a Review. Cellul Chem Technol. 2010; 44(9): 353 – 363.
- Masuelli M. A., Illanes C. O. Review of the Characterization of Sodium Alginate by Intrinsic Viscosity Measurements. Comparative Analysis between Conventional and Single Point Methods. Int J BioMater Sci Eng. 2014; 1(1): 1–11.
- McNeely W. H., Pettitt D. J. Alginate. In: Whistler, R.L. Industrial Gums: Polysaccharides and Their Derivatives. 2nd edition. New York: Academic Press; 1973.
CrossRef - Zuritz C. A., Puntes E. M., Mathey H. H., Pérez E. H., Gascón A., Rubio L. A., Carullo C. A., Chernikoff R. E., Cabeza M. S. Density. Viscosity and Coefficient of Thermal Expansion of Clear Grape Juice at Different Soluble Solid Concentrations and Temperatures. J Food Eng. 2005; 71 (2): 143 –149.
CrossRef - Kurkuri M. D., Kulkarni A. R., Aminabhavi T. M. Rheological Investigations on The Dispersions of Sodium Alginate and Guar Gum Mixtures at Different Temperatures. Polym Plast Technol Eng. 2002; 41(3): 469 – 488.
CrossRef
Accepted on: 30 Dec 2020
Second Review by: J. Bhuvaneswari Balu
Final Approval by: Prof. Daniel Cozzolino


Web of Science Coverage
Emerging Sources Citation Index (ESCI)
2024 Journal Impact Factor: 1.1
Scopus Journal Metrics
CiteScore 2025: 2.6
CiteScore Details
Sustainable Nutrition: Food Systems, Nutrient Retention, and Public Health Impact
![]()
This journal is a member of, and subscribes to the principles of, the Committee on Publication Ethics (COPE)


