Chemical Composition of Lizardfish Surimi By-Product: Focus on Macro and Micro-Minerals Contents
 , Rossita Shapawi3, Ruzaidi Azli Mohd Mokhtar4, Wan Norhana Md. Noordin 5 and Nurul Huda1*
 1Faculty of Food Science and Nutrition, Universiti Malaysia Sabah, Sabah, Malaysia.
2Faculty of Fisheries and Marine Science, Universitas Brawijaya, Indonesia.
3Borneo Marine Research Institute, Universiti Malaysia Sabah, Sabah, Malaysia.
4Biotechnology Research Institute, Universiti Malaysia Sabah, Sabah, Malaysia.
5Fisheries Research Institute, Penang, Malaysia.
Corresponding Author Email: drnurulhuda@ums.edu.my
DOI : http://dx.doi.org/10.12944/CRNFSJ.9.1.06
Download this article as:
![]()
Surimi processing industries generated over 60% of fish by-products, including head, skin, viscera, trimming, bone, scale, and fin. Hence, an effort converting these by-products into valuable compounds and constituents is necessary for optimizing the resources. In order to implement this, the information on the chemical composition of the by-products is helpful. This study aimed to determine the chemical composition, particularly minerals of lizardfish surimi by-products. The protein, fat, ash, moisture, and carbohydrate values of by-products differed significantly (p < 0.05). Protein content was highest in the skin and scale (29.63% and 29.62%, respectively), and ash content was predominantly found in the scale (28.43%), fin (26.01%), and bone (23.58). Calcium, magnesium, potassium, and sodium content were significantly varied respectively from 0.25% to 6.88%, 0.06% to 0.37%, 0.01% to 0.09%, and 0.01% to 0.32%. Calcium is highest in scale, whereas zinc, manganese, and iron were most abundance in all parts of the by-products sample. Zinc is mostly detected in the fin (76.75 µg/g), bone (48.67 µg/g) and scale (46.01 µg/g) parts. On the other hand, copper, chromium, selenium, cadmium and lead were detected at lower concentration (less than 2 µg/g), and complied with the safety levels set by the Malaysian Food and Regulations. These findings suggest that, by-products generated from lizardfish surimi processing may be used as ingredients to enrich nutritional value of other food products.
KEYWORDS:Fishery Leftover; Fish Processing; Major And Trace Element Composition; Nutritional Value
Introduction
Production of surimi in the world was around 800,000 tonnes in the year 2014/2015 with Alaska pollock surimi accounting for 200,000 tonnes or 25% of the total production.1 Meanwhile, surimi from tropical marine species reached around 500,000 tonnes, with other fisheries contributing the rest.1 In Southeast Asian countries, surimi, a mechanically deboned, washed, bleached, and stabilized fish flesh,2,3 is predominantly produced from fish with a low commercial value fish including, threadfin bream (Nemipterus spp.), ox-eye scads (Priancanthus spp.), goatfish (Upenneus spp.), jewfish (Johnius spp.), lizardfish (Saurida spp.), barracuda (Sphyreana spp.), and ribbon fish (Trihiuru spp.) as well as mix fish species.4,5 Lizardfish (Saurida tumbil) has been widely used in Malaysia as a prime raw material for surimi production due to its availability and low price.6 Since only the flesh of the fish is used for surimi production, as a result, other portions of the fish including head, viscera, skin, bone, scale, and fin are generated as by-products, which may account for 60-70% of the whole fish weight.7 In addition to that, fish by-product may be taken away from the processor at a low cost. Due to the large amount of organic content, this by-product is considered as a certified (prescribed) waste, which is even costlier to discard. This practice is coming under increased investigation due to environmental issues linked to surimi waste disposal 8 and is getting a raising concern and cost burden for the fish processing industry.
Previously, the abundance of resources and lack of awareness in utilizing these by-products, have led to by-products being disposed as waste, resulting in unused valuable biomaterials and environmental pollution.9 Fortunately, nowadays, the circular economy concepts whereby production and consumption move closer to the cyclical processes in nature with waste from one species broken down into nutrients, and used by another.
Conversion of fish by-products into valuable components is an important strategy to reduce industrial waste and turn it into a useful commodity. Esteban et al.,10 reported the fish by-products contained crude protein (57.9%), fat (19.2%), crude fibre (1.3%), calcium (5.8%), phosphorus (2.1%), potassium (0.7%), sodium (0.6%), and magnesium (0.2%) (based on dry basis). In general, the nutritional profile of different parts of the fish by-product is somewhat different, as documented by Pateiro et al.,11 where the bone, gills, and head of fish by-products showed a higher ash, calcium, and phosphorous composition, compared to the flesh, viscera, and skin of the by-products. Meanwhile, the protein content of flesh and skin by-products was greater than that of the bone, gills and head. Hence, there is good opportunity to develop this surimi by-products into a more valuable products that can be extensively applied in food products as functional food ingredients.12 As reported by Nemati et al., 13 the fish bone powder could be fortified into bakery product, resulting in the improvement of calcium value and customer acceptance. Singh et al.,14 also reported the debittered fish frame hydrolysate could increase the nutritional value of fortified biscuits. Fish skin hydrolysate could also be applied as functional drink in the soup product.15
Although much work related to nutritional composition from fish by-products has been done to date, there is still a lack of exploration on the chemical composition and mineral content of waste from fish processing plants. Moreover, prior to conversion into other diversified products, information on the nutritional composition of the waste materials is crucial. This study, therefore, aimed to determine the chemical composition and mineral content of lizardfish by-products, particularly skin, scale, remnant flesh, bone and fin generated from surimi processing plants. The findings of the present study can give an important insight about the nutritional potential of the less-explored fish by-products.
Materials and Methods
Materials
All chemicals used in present study were of analytical grade. Sulfuric acid (H2SO4) (Merck, Germany) was used to digest the samples, while Kjeldahl catalyst selenium tablet (Fisher Chemical, USA) was applied to determine the crude protein based on quantifying nitrogen in the samples. Petroleum ether (Merck, Germany) was used in lipid extraction in the form of crude lipid. For mineral analysis, a high-purity nitric acid (Merck, Germany) was prepared to digest the sample, and water used in this experiment was ultrapure water (Millipore). The certified reference materials (CRM) were obtained from the National Institute of Standard Technology (NIST) as a validated test method. The by-products of Lizardfish (S. tumbil) were provided by the local surimi processing industry (QL Marine Products Sdn. Bhd.). The frozen by-product samples were packed into plastic bag and kept chilled inside an ice cooled insulated box and then stored in the freezer.
Sample Separation
The samples used in this study were two blocks of the lizardfish surimi by-product, with each block of this by-product weighing around 4.29 kg. For sample separation, the frozen samples were immediately thawed by immersing the blocks in tap water, followed by rinsing with the reverse osmosis water to remove undesirable non-fish by-product components. After washing, the lizardfish surimi by-product samples were separated by portions, including flesh, skin, bone, scale and fins. The separated samples were individually weighed and recorded as weight of each part of by-product. The weighed samples were then homogenized thoroughly and put into plastic containers. The packed samples were then stored at -20 °C until further use.
Chemical Analysis
The chemical composition of lizardfish surimi by-products was determined using the method of the Association of Official Analytical Chemist (AOAC).16 All analyses were conducted in two different by-product samples.
Moisture Content
The moisture content of each by-product was conducted using an air-oven (M720, Binder, Germany). Moisture content was then calculated with the formula described by AOAC 16:
![]()
where W1 is an initial weight (g) of the by-product sample, and W2 is a final weight (g) of the fish by-product sample after drying.
Protein Content
The protein content was determined using a Kjeltec 2300 Auto Distillation Unit (FOSS Tecator, Sweden) with Kjeldahl method. Protein content was determined based on the amount of nitrogen contained in the sample, and further calculated applying the following equation reported by AOAC 16:
![]()
where 6.25 is a nitrogen-to-sample conversion factor applied for the measurement of protein present in the tested sample.
Fat Content
The fat content was determined using a Soxtec 2050 automated analyzer (FOSS Analytical, Denmark) by Soxtec method. Petroleum ether was applied during extraction, while fat content was measured by the formula presented from AOAC 16:
![]()
where T1 is the by-product sample weight and T2 is weight of fat.
Ash Content
The ash content was conducted using gravimetric method. Samples (2 g) were placed into a porcelain cup, and heated in a furnace (Furnace 62700, Dubuque, IA, USA) with a temperature of 550 °C overnight. The treated samples were then put into a desiccator and the ash value was calculated with the following equation exhibited by AOAC 16:
![]()
where W1 is the sample weight, and W2 is the ash weight.
Carbohydrate Content
The carbohydrate content was measured by subtracting the sum of moisture, protein, fat, and ash contents from 100.17
Mineral Analysis
Prior to determining the mineral content through ICP-MS system (PerkinElmer Elan 9000-USA), the lizardfish surimi by-product samples were acidically digested using the closed vessel microwave digestion system (CEM, MARS, USA). About 2 g of each fish by-product was individually weighed and put in a Teflon digestion vessel with the addition of hydrogen peroxide (H2O2) (1 mL) and ultrapure nitric acid (NH3) (3 mL). The treated samples were sealed and put in a microwave and heated according to the method of Jarapala et al.,18 with power (1600 W, 100%), ramp time (15 minutes), temperature (200 °C), hold time (15 minutes), and cooling time (15 minutes). The digested samples were cooled and subsequently transferred into acid cleaned standard volumetric flasks (25 mL) with adding double ultrapure water. Afterwards, the calibration standards were prepared under the same conditions with adding 6% (v/v) HNO3, followed by a blank digest solution. The ICP-MS, in present study, was adjusted to nebulizer gas flow 0.96 L/min, lens voltage 1.6 V, radio frequency (RF) 1600 W, cool gas 13.0 L/min, and auxiliary gas 1.2 L/min. Twelve elements of interest were selected in this study, namely Calcium, Magnesium, Potassium, Sodium, Zinc, Chromium, Manganese, Copper, Iron, Selenium, Cadmium and Lead.
Statistical Analysis
Data was presented as mean ± standard deviation (SD) and analysed by one-way Analysis of Variance (ANOVA). A Tukey test was applied to present a significant difference in each treatment. All statistical analyses were performed using the Statistical Package for Social Science SPSS, version 27 for Windows (SPSS Inc., Chicago, IL, USA).
Results and Discussion
Lizardfish Surimi By-product Composition
The lizardfish surimi by-products used in this experiment consisted of skin (25.68 ± 2.08 %), fin (22.28 ± 3.24 %), remnant flesh (21.47 ± 2.58 %), bone (17.60 ± 2.50 %), and scale (12.97 ± 2.61 %), as depicted in Fig. 1. The skin of lizardfish constituted the highest percentage of the by-products from the surimi production, followed by fins and remnant flesh, whereas the lowest volume of by-products was the scale. Due to the lack of information regarding the weight of each portion of the by-product from surimi processing industry, the weight of portions found in the present study would be different from other fish processing and depended also on fish species, as reported by Stevens et al.,19 Atlantic salmon by-products comprised 10% of bones (including frame and fin), 10% of head, 12.5% of viscera, 3.5% of skin, 5% of scale, 2% of blood, and 3.5% of trimmings. Another study reported by Pateiro et al.,11 exhibited that the by-products from gilthead sea bream composed 21.53% of head, 14.57% of bone, 10.25% of skin, 6.58% of viscera, 2.63% of gills, 1.75% of fins, and 3.89% of other components.
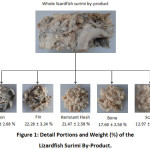 |
Figure 1: Detail Portions and Weight (%) of the Lizardfish Surimi By-Product. |
Chemical Composition
Table 1 presents the chemical composition of lizardfish surimi by-products. In general, different types of by-products contain different moisture, protein, fat, ash, and carbohydrate contents.
Table 1: Chemical compositions of the Flesh, Skin, Scale, Bone, and Fin from Lizardfish Surimi By-Product (Based on Wet Matter Basis) (%)
| Composition | Lizardfish by-product | ||||
| Flesh | Skin | Scale | Bone | Fin | |
| Moisture | 76.26±0.52d | 67.05±0.28c | 40.84±0.99a | 56.84±0.13b | 55.19±1.00b |
| Fat | 1.34±0.07c | 1.76±0.11d | 0.28±0.15a | 0.74±0.04b | 0.63±0.02b |
| Protein | 20.82±0.88b | 29.63±0.30c | 29.62±0.15c | 17.96±0.04a | 17.31±0.34a |
| Ash | 1.02±0.04a | 1.16±0.15a | 28.43±0.62c | 23.58±0.36b | 26.01±1.04bc |
| Carbohydrates | 0.56±0.38b | 0.40±0.45a | 0.83±0.48c | 0.88±0.14c | 0.87±0.60c |
Means in the same row with different superscripts are significantly different (p < 0.05).
The moisture contents are significantly higher (p < 0.05) in the remnant flesh, followed by skin, bone, fin and lowest in the scale. This observation is in line with previous studies documented in croaker (Pseudotolithus typus and Pseudotolithus elongatus)17 and gilthead sea bream (Sparus aurata).11 Moisture content is the main constituent of fish varied from 70% and 80%, especially in the flesh as edible portion of fish.19 For protein content, the highest value was exhibited in the skin (29.63%) and scale (29.62%) of the by-products. This might be due to the lower level of moisture content in both skin and scale than in the remnant flesh sample, as suggested by Setijawati et al.,20 when the moisture content in the fish sample was high, resulting in the low level of protein, or vice versa. Moreover, fish skin contains extracellular matrix such a fibrous protein or known as collagen, whilst the scale is composed of various components, particularly collagen fibres. Masood et al.,21 revealed that each fish scale contained 41 to 81% organic proteins on dry matter basis. However, the fin and bone recorded lowest level of protein. In the present study, the protein values from surimi (lizardfish) by-products ranged from 17.31% – 29.63%, higher than the protein contents of the by-products from gilthead sea bream (S. aurata) with values between 10.11% – 21.05% .11
The fat content of the scale was significantly lower (0.28%) compared to skin (1.76%). It was observed that the scale, bone and fin by-products contained less than 1% fat. As a result, the composition of ash obtained from those portions exhibited significantly higher values (ranging between 23.58% and 28.43%) than those obtained from remnant flesh and skin portions. This result is in agreement with the report on two croaker fish species (P. typus and P. elongatus).16 Meanwhile, the calculated levels of carbohydrate were low (0.40% – 0.88%) in all samples. These values were similar to those species documented by Njinkoue et al.,17. Overall, the chemical composition, observed in this present study on lizardfish by-products and other published studies highly varies from one species and/or portions within this species to another relying on feeding, sex, habitat and season.22
With the chemical composition determined in this study, the by-products from lizardfish surimi processing could be potentially developed into valuable products, such as fish protein hydrolysate, collagen, gelatine, bio-calcium and fortified food products.12,23,14
Mineral Content
The mineral contents of different portions of lizardfish surimi by-product are divided into two categories consisting of macro- and micro-elements. For macro-elements, representing Calcium (Ca), Potassium (K), Magnesium (Mg), and Sodium (Na), while Zinc (Zn), Manganese (Mn), Chromium (Cr), Iron (Fe), Copper (Cu), Selenium (Se), Cadmium (Cd) and Lead (Pb) are represented as micro-elements, both element values are tabulated in Table 2 & 3.
Table 2: Macro-Element Contents in the Flesh, Skin, Bone, Scale, and Fins of Lizardfish Surimi By-Product (%)
| Macro-element | Lizardfish surimi by-product | |||||
| Flesh | Skin | Scale | Bone | Fins | ||
| Calcium (Ca) | 0.34±0.01a | 0.25±0.05a | 6.88±0.06d | 5.01±0.07b | 6.00±0.05c | |
| Magnesium (Mg) | 0.09±0.00b | 0.06±0.00a | 0.33±0.00c | 0.31±0.00c | 0.37±0.00d | |
| Potassium (K) | 0.09±0.00d | 0.01±0.00a | 0.01±0.00a | 0.06±0.00c | 0.03±0.00b | |
| Sodium (Na) | 0.10±0.00b | 0.01±0.00a | 0.21±0.01c | 0.30±0.00d | 0.32±0.00d | |
Means in the same row with different superscripts are significantly different (p < 0.05).
Table 3: Micro-Element Contents in the Flesh, Skin, Bone, Scale, and Fins of Lizardfish Surimi By-Product (μg/g)
| Micro-element | Lizardfish surimi by-product | |||||
| Flesh | Skin | Scale | Bone | Fins | ||
| Zinc (Zn) | 23.60±0.69a | 27.35±0.12b | 46.01±0.57c | 48.67±0.96c | 76.75±0.20d | |
| Copper (Cu) | 1.89±0.30b | 0.91±0.14a | 0.22±0.02a | 0.56±0.01a | 0.40±0.03a | |
| Manganese (Mn) | 2.19±0.13a | 4.10±0.19a | 40.89±0.21b | 40.65±1.28b | 54.01±1.19c | |
| Iron (Fe) | 18.56±1.23bc | 20.41±0.02c | 6.95±0.91a | 14.53±1.34b | 14.91±0.78bc | |
| Chromium (Cr) | 0.44±0.03ab | 0.78±0.29b | 0.09±0.00a | 0.37±0.08ab | 0.28±0.00ab | |
| Selenium (Se) | 0.92±0.00d | 0.68±0.01d | 0.25±0.02b | 0.37±0.02c | 0.10±0.00a | |
| Cadmium (Cd) | 0.04±0.04c | 0.04±0.00c | 0.02±0.00a | 0.03±0.00b | 0.03±0.00b | |
| Lead (Pb) | 0.07±0.01a | 0.08±0.00a | 0.08±0.00a | 0.07±0.00a | 0.07±0.00a | |
Means in the same row with different superscripts are significantly different (p < 0.05).
Macro-Elements
The macro-element values in the different parts of surimi by-products were significantly varied (p < 0.05) from 0.25% to 6.88%, 0.06% to 0.37%, 0.01% to 0.09%, and 0.01% to 0.32% for calcium, magnesium, potassium, and sodium, respectively (Table 2). The fish by-products obtained from this study and other literatures have different levels of macro-mineral due to several factors such as feeding behaviour of the fish, seasonal and biological differences, and environmental conditions.24 Calcium is the highest macro-element detected in the different types of by-products compared to other elements. The scale, bone and fin in particular, showed significantly higher (p < 0.05) calcium readings than those observed in the remnant flesh and skin with the highest value in the scale sample, according to Masood et al.,21 calcium is one of the main components of fish scale in the form of calcium salt crystals. For magnesium, higher concentrations were recorded in fin (0.37%), scale (0.33%), and bone (0.31%) of the fish by-products compared to the remnant flesh and skin. Meanwhile, the remnant flesh recorded the highest potassium level (0.09%) than other types of lizardfish by-products. On the other hand, the skin part contained the lowest sodium concentration (0.01%) among the different portions of by-product samples.
Pateiro et al.,11 reported the macro-elements observed in the gilthead sea bream and its by-products which showed high variables in the level of calcium, magnesium, potassium, and sodium; however, when compared to the tested fish by-products in this study, particularly in the level of calcium, the lizardfish by-products exhibited three times higher values than in the fish bone of gilthead sea bream. Njinkoue et al.,17 documented the calcium content of by-products of two marine fish (P. typus and P. elongatus) which was 4 times higher than the present study. The high calcium levels obtained in the frame and scale reflecting these parts of by-product are a good source of this element, and being an important mineral for human health, as well as, can be used as a potential food supplement. For example, Nemati et al.,13 revealed the bakery fortified with bone powder from fish by-product could enhance the calcium level and customer acceptance. Singh et al.,14 also used the debittered fish frame into biscuit product, resulting in the increase of nutritional attribute. From our results, the by products from lizardfish surimi processing especially the scale, bones and fins could be turned into powder and used as supplement or fortification in food products.
For magnesium, as mentioned earlier, especially in the bone, scale and fin observed in this study had the highest levels than other types of by-products. When compared to the gilthead sea bream (S. aurata) 11, croaker fish (P. typus and P. elongatus) 17, and meagre (Argyrosomus regius) 24, lizardfish by-product exhibited higher magnesium content than those previously reported. In addition to this, magnesium has some benefits in human body, such as regulating a number of essential functions, being a cofactor for hundreds of enzymes, contributing in bone development, and related process .25 Thus, surimi by-products can be fortified into food products to increase the nutritional value. Potassium level showed less dominant in the studied samples as compared to the fish by-products documented by Pateiro et al.,11 and Kandyliari et al.,25. However, sodium scores from lizardfish by-products, particularly in the form of flesh and bone, exhibited higher values than those collected from gilthead sea bream (S. aurata).11
Micro-Elements
The levels of trace elements in lizardfish surimi by-products exhibited significant difference (p < 0.05) in all by-product portions. The fin contained the highest level of most of the micro elements. The most abundant microelements were zinc, manganese, and iron (Table 3). The highest concentration of zinc was exhibited in the fin samples (76.75 µg/g), followed by bone (48.67 µg/g) and scale (46.01 µg/g). Similarly the manganese content in fins (54.01 µg/g) was also the highest compared to other portions (2.19 – 40.89 µg/g). For iron, skin (20.41 µg/g) and flesh (18.56 µg/g) recorded higher level than fin, bone, and scale. This may be due to unavoidable fragments of blood remaining in the skin and flesh after portioning the by-product. On the other hand, the presence of copper, chromium, selenium, cadmium, and lead were low (less than 2 µg/g) in all fish by-products studied at particularly cadmium and lead (respectively, 0.02 – 0.04 µg/g and 0.07 – 0.08 µg/g).
Zinc is an important micro-element for metabolism activity in organisms. It plays an essential role in the maintenance of immune system, cell division, wound healing and so forth. The excess of zinc, however, is considered to produce detrimental effect to the organisms. For example, Salvaggio et al., 26 confirmed that excessive zinc in the zebrafish (as an alternative vertebrate model) could cause malformations of the skeletal and serious defects in growth. Another study documented by Plum at al., 27 revealed the excessive exposure in human could cause focal neuronal deficits, respiratory disorder, epigastric pain, and risk of prostate cancer. According to the Malaysian Food and Regulations 28, the permissible zinc limit in the food product is about 100 µg/g, while the Food and Agriculture Organization and World Health Organisation (FAO/WHO) 29, the permissible limit recommended is around 150 µg/g. The lizardfish by-products sample showed that the zinc concentrations were lower than those advocated by the Malaysian Food and Regulation 28 and FAO/WHO.29 This suggests that lizardfish (surimi) by-product is permissible to be used in the fortified food product. Meanwhile, the levels of zinc reported by Njinkoue et al.,17 and Pateiro et al.,11 using the by-products of Pacific Ocean perch (Sebastes alutus), croaker fish (P. typus and P. elongatus), gilthead sea bream (S. aurata), respectively, and found in the present study exhibited different concentrations. This might be due to the several factors, such as the physiological conditions of the fish (age and size), locality (natural or anthropogenic sources), and seasonal variation.30 The iron values of these by-product were less abundance than those documented by Njinkoue et al.,17 (18.93 – 36.94 µg/g), but higher than the values documented by Pateiro et al.,18 (6.90 – 10.10 µg/g). Moreover, the higher concentrations of copper were also observed in in the by-product of Pacific Ocean perch (Sebastes alutus) and croaker fish (P. typus and P. elongatus)17, but all documented the by-products and examined lizardfish by-product samples had a lower iron level than recommended by Malaysia and FAO/WHO standards (respectively, 10 and 30 µg/g). Interestingly, the selenium content from the by-product portions of lizardfish, especially in the flesh part, showed higher value than some of freshwater fish species investigated by Jarapala et al.,18. As widely known, selenium is an essential element, especially in preventing oxidative stress in the human cell.18 In case of chromium, cadmium, and lead contents, the examined samples were in line with those studied by Younis et al.,24 and Jarapala et al.,18. More importantly, the studied by-products contained lower values of these heavy metals than the toxic levels stated by Malaysian Food and FAO/WHO regulations. Thus, some micro-elements found in this study may be potentially used to enrich essential element in human diet, as well as to enhance functional food products through fortification strategy.
Conclusion
Lizardfish by-products from surimi processing industry possessed a number of nutritional compositions, particularly high amounts in protein content observed in the skin and scale. In addition, the scale, bone, and fin parts predominantly contained calcium as a potential macro-mineral source, whilst the zinc, manganese and iron contents were detected in higher levels than other micro-element compositions. In contrast, the levels of copper, chromium, selenium, cadmium and lead found in the samples were low. These heavy metals, however, contained in the lizardfish surimi by-products were considered safe due to permissible limits according to the standard of Malaysian Food and Regulation, and FAO/WHO. Based on the findings demonstrating their nutrient-rich compositions, the lizardfish by-products can be applied as potential ingredients in food product.
Acknowledgement
This research received funding by the Ministry of Education Malaysia through the Fundamental Research Grant Scheme (FRGS) with a grant number FRG0523-1/2019.
Conflict of Interest
The authors declare no conflict of interest.
References
- FOA, Globlefish Highlights: A Quartery Update on World Seafood Market. 3rd 2016. http://seafoodbrasil.com.br/wp-content/uploads/2016/09/web_i6094e.pdf.
- Park, J. W. Surimi and Surimi Seafood. Third Edition. CRC Press. 2013. 666.
CrossRef - Giusti, A., Armani, A., Sotelo, C. G. Advances in The Analysis of Complex Food Matrices: Species Identification in Surimi-based Products Using Next Generation Sequencing Technologies. PLoS ONE. 2017; 12(10): 0185586. https://doi.org/ 10.1371/journal.pone.0185586.
CrossRef - Rawdkuen, S., Benjakul, S. Whey Protein Concentrate: Autolysis Inhibition and Effects on The Gel Properties of Surimi Prepared from Tropical Fish. Food Chem. 2008; 106(3): 1077–1084. https://doi.org/10.1016/j.foodchem.2007.07.028.
CrossRef - Santana, P., Huda, N., Yang, T. Physicochemical Properties and Sensory Characteristics of Sausage Formulated Powder. J Food Sci Tech. 2015; 52(3): 1507-1515. DOI: 10.1007/s13197-013-1145-1.
CrossRef - Huda, N., Abdullah, A., Babji, A. S. Functional Properties of Surimi Powder from Three Malaysian Marine Fish. Int J Food Sci Technol. 36(4): 401-406. 10.1046/j.1365-2621.2001.00473.x .
CrossRef - Torres, J. A., Chen, Y.-C., Rodrigo-García, J., Jaczynski, J. Recovery of By-products from Seafood Processing Waste Streams, in: Shahidi, F. (Ed.). Maximising The Value of Marine By-products, CRC Press, Boca Raton, USA. 2007; 65-90.doi:10.1533/9781845692087.1.65.
CrossRef - Knuckey, I., Sinclair, C., Surapaneni, A., Ashcroft, W. Utilisation of Seafood Processing Waste-Challenges and Opportunities. Paper presented at the SuperSoil 2004: 3rd Australian New Zealand Soils Conference, University of Sydney.
- Bruno, J. F., Côté, I. M., Toth, L. T. Climate Change, Coral Loss, and the Curious Case of the Parrotfish Paradigm: Why Don’t Marine Protected Areas Improve Reef Resilience? Annu Rev Mar Sci. 2019; 11(1): 307–334.doi:10.1146/annurev-marine-010318-095300.
CrossRef - Esteban, M. B., García, A. J., Ramos, P., Márquez, M. C. Evaluation of Fruit, Vegetable and Fish Wastes as Alternative Feedstuffs in Pig Diets. Waste Manag. 2007; 27: 193-200.
CrossRef - Pateiro, M., Munekata, P. E. S., Domingues, R., Wang, M., barba, F. J. B., Bermudez, R., Lorenzo, J. M. Nutritional Profiling and The Value of Processing By-products from Gilthead Sea Bream (Sparus aurata). Mar Drugs. 2020: 18, 101. doi:10.3390/md18020101.
CrossRef - Herpandi, Huda, N., Rosma, A., Nadiah, W. A. The Tuna Fishing Industry: A New Outlook on Fish Protein Hydrolysate. Compr Rev Food Sci Food Saf. 2011; 10 (4): 195-207. doi: 10.1111/j.1541-4337.2011.00155.x.
CrossRef - Nemati, M., Huda, N., Ariffin, F. Development of Calcium Supplement from Fish Bone Wastes of Yellowfin Tuna (Thunnus albacares) and Characterization of Nutritional Quality. Int Food Res J. 2017: 24(6); 2419-2426.
- Singh, A., Benjakul, S., Huda, N. Characteristics and Nutritional Value of Biscuits Fortified with Debittered Salmon (Salmo salar) Frame Hydrolysate. Int J Food Sci Tech. 2020. https://doi.org/10.1111/ijfs.14688.
CrossRef - Benjakul, S., Chantakun, K., Karnjanapratum, S. Impact of Retort Process on Characteristics and Bioactivities of Herbal Soup Based on Hydrolyzed Collagen from Seabass Skin. J Food Sci Tech. 2018; 55: 3779-3791. https://doi.org/10.1007/s13197-018-3310-z.
CrossRef - Official Methods of Analysis. Editional Number: 17. Association of Official Analytical Chemist, Washington. D.C. 2000.
- Njinkoue, J. M., Gouado, I., Tchoumbougnang, F., Ngueguim, J. H. Y., Ndintech, D. T., Fomogne-Fodjo, C. Y., Schweigert, F. J. Proximate Composition, Mineral Content and Fatty Acid Profile of Two Marine Fishes from Cameroonian Coast: Pseudotolithus typus (Bleeker, 1863) and Pseudotolithus elongatus (Bowdich, 1825). NFS J. 2016;4: 27-31.
CrossRef - Jarapala, S. R., Kandlakunta, B., Thingnganing, L. Evaluation of Trace Metal Content by ICP-MS Using Closed Vessel Microwave Digestion in Fresh Water Fish. J Environ Public Health. 2014: 201506. http://dx.doi.org/10.1155/2014/201506.
CrossRef - Stevens, J. R., Newton, R. W., Tlusty, M., Little, D. C. (2018). The Rise of Aquaculture by-Products: Increasing Food Production, Value, and Sustainability Through Strategic Utilisation. Mar Policy, 2018; 90: 115-124. https://doi.org/10.1016/j.marpol.2017.12.027.
CrossRef - Setijawati, D., Jaziri, A. A., Yufidasari, H. s., Pratomo, M. D., Wardani, D. W., Ersyah, D., Huda, N. Characteristics and Use of Peptones from Catfish (Clarias gariepinus) and Pangas Catfish (Pangasius pangasius) Heads as Bacterial Growth Media. Squalen Bulletin Mar Fish Posthar Biotech. 2020; 15(1): 19-29.
CrossRef - Masood, Z., Yasmeen, R., Haider, M. S.,Tarar, O. M., Lakht-e-Zehra., Hossain, M. Y. Evaluations of Crude Protein and Amino Acid Contents from The Scales of Four Mullet Species (Mugilidae) Collected from Karachi Fish Harbour, Pakistan. Indian J Geo Mar Sci. 2015; 44(5): 724-731.
- Osibona, A. O. Comparative Study of Proximate Composition, Amino and Fatty Acids of Some Economically Important Fish Species in Lagos, Nigeria. African J Food Sci. 2011; 5(10): 581–588.
- Jaziri, A. A., Muyasyaroh, h., Firdaus, M. Effect of Phosphoric Acid Concentration on Physicochemical Properties of Abalistes stellaris Skin Gelatin. IOP Conf. Series: Earth and Environmental Science. 2020; 493, 012038. doi:10.1088/1755-1315/493/1/012038.
CrossRef - Younis, E. M., Abdel-Warith, A. A., Ali, A., Al-Asgah, N. A., El-Shayia, A. S. Chemical Composition and Mineral Contents of Six Commercial Fish Species from The Arabian Gulf Coast of Saudi Arabia. J Anim Vet Adv 2011; 10(23): 3053-3059.
- Kandyliari, A., Mallouchos, A., Papandroulakis, N., Golla, J. P., Lam, T. T., Sakellari, A., Karavoltsos, S., Vasiliou, V., Kapsokefalou, M. Nutrient Composition and Fatty Acid and Protein Profiles of Selected Fish By-products. Foods. 2020; 9, 190. doi:10.3390/foods9020190.
CrossRef - Salvaggio, A., Marino, F., Albano, M., Pecoraro, R., Camiolo, G., Tibullo, D., Bramanti, V., Lombardo, B. M., Saccone, S., Mazzei, V., Brundo, M. V. Toxic Rffects on Zinc Chloride on the Bone Development in Danio rerio (Hamilton, 1822). Front Physiol. 2016; 7: 153. doi: 10.3389/fphys.2016.00153.
CrossRef - Plum, L. M., Rink, L., Haase, H. The Essential Toxin: Impact of Zinc on Human Health. Int J Environ Res Public Health. 2010; 7, 1342-1365. doi:10.3390/ijerph7041342.
CrossRef - Malaysian Food and Regulations. In Hamid Ibrahim, N. and Yap, T.H. (Eds). Malaysian Law on Food and Drugs. Kuala Lumpur: Malaysia Law Publisher. 1985.
- FAO/WHO. List of Maximum Levels Recommended for Contaminants by The Joint FAO/ WHO Codex Alimentarius Commission. 2nd Rome. 1984; 3: 1-8.
- Sow, A. Y., Ismail, A., Zulkifil, S. Z., Amal, M. N., Hambali, K. A. Survey on Heavy Metals Contamination and Health Risk Assessment in Commercially Valuable Asian Swamp Eel, Monopterus albus from Kelantan, Malaysia. Scientific Reports. 2019;9: 6391. https://doi.org/10.1038/s41598-019-42753-2.
CrossRef
Scopus Citation(s): 20
Accepted on: 25 Jan 2021
Second Review by: Marco Albano Italy
Final Approval by: Dr. Krešimir Mastanjević


Web of Science Coverage
Emerging Sources Citation Index (ESCI)
2024 Journal Impact Factor: 1.1
Scopus Journal Metrics
CiteScore 2025: 2.6
CiteScore Details
Sustainable Nutrition: Food Systems, Nutrient Retention, and Public Health Impact
![]()
This journal is a member of, and subscribes to the principles of, the Committee on Publication Ethics (COPE)


