

Introduction
Calcium is a vital mineral for the body and low intake has an adverse effect on adult health. Based on several studies conducted across 74 countries, the average calcium intake varies from 175 to 1233 mg per day. Calcium intake is even less than 500 mg per day in many Asian countries. The global studies find out that many countries have low average calcium intake.1
63.5% of adults believe that they consume an adequate amount of recommended daily calcium intake but in reality, they fail to achieve and in turn, indicate the importance of educating individuals about calcium for a healthy body.2 Also, women are unable to meet up the calcium requirements throughout their life and remain deficient, especially when they face several critical stages of life like pregnancy, lactation, and menopause3.
The National Nutrition Monitoring Bureau (NNMB) – 2012 data from 10 Indian states shows that the daily calcium intake during pregnancy and lactation for Indian women is less than 30% of RDA (which means it is only 400 mg/d). This shows that most pregnant and lactating women in India have low dietary calcium intake4.
Calcium is an important mineral for bone development and is required throughout life, but in reality, more than 1/3 of the female population in the United States are deprived of recommended calcium doses. Calcium requirements are high during the pregnancy and lactation periods due to adverse effects on maternal bone health and maternal calcium stores are washed out. 2 5.
Calcium transfer between the mother and baby averages two hundred mg/day for one cycle of breast-feeding6. Calcium quantity varies widely in breast milk and can be as high as four hundred mg/day in some people.
Along with this, the first six months of lactation significantly reduces the bone minerals7. Spine areas including hips are majorly affected by the mineral reduction, which can go up to five percent. Daily supplements are advised by pediatrics which include folic acid and various minerals like iron, calcium, and zinc. Though, if proper food practices are followed then they are self-sufficient in overcoming the deficiencies related to the lactation period8.
Hence, the demand for calcium intake increases in daily requirements. WHO and FAO advises consuming Twelve hundred mg/day calcium during pregnancy and lactation9.
For decades in India, culturally accepted foods are produced and managing malnutrition successfully10. The home preparation has better acceptability in consumers11. Based on this background of increased calcium demand and acceptability issues; this study aimed to prepare and optimize the flour into calcium-rich Nutrimix flour (NF).
Box-Behnken method of response surface method is widely used for optimizing ingredients in different kinds of food products in food industries. This method determines the effects of different variables in any food mixture with a minimum number of experiments12.
A statistical and mathematical procedure like RSM, achieve response optimization of the multiple variables13. We have used the Box- Behnken response surface method while preparing Nutrimix flour.
According to National guidelines, the poor dietary intake of calcium in India is high and leading to the high prevalence of hypertensive disorders. There is an urgent need to focus on calcium supplementation during pregnancy and lactation4.
The flour prepared based on the scientific approach will be ready to cook and consist of 5 ingredients. Fingermillet, Green Gram, Semonila, Amaranth Seeds, and Gingely Seeds, contain the highest amount of calcium and have lactation beneficial properties. The flour can be included in the preparation of several Indian recipes like a pancake, idly, dosa and porridge, etc. Its acceptance during the study among lactating mothers indicates its wide usability. Nutrimix flour is an effective dietary supplement that helps lactating mothers to meet the one-third need of daily calcium as recommended by RDA i.e. 400mg per 100gm of flour. This study will also help anyone willing to take up the supplementation production of the Nutrimix flour and combined with organic farming ingredients, it can turn out to be very useful for several stakeholders within society. The Nutrimix flour will prove to be a good substitute in Indian recipes at a very low cost for Indian lactating mothers who are malnourished in calcium and protein nutrient intake, with the help of easily available ingredients.
Materials and Methods
Materials
Ingredients for Nutrimix flour formulation are listed below
- Finger millet (Eleusine coracana)
- Green gram (Vigna radiate)
- Semolina (Durum wheat)
- Amaranth seeds (Amaranthus)
- Gingley seeds (Sesamum indicum)
Experimental Design
A randomized RSM experiment helped in determining optimum Nutrimix Flour. We used Design Expert version 11.0 software for the RSM analysis. A total of forty-six sets of experiments ran to optimize the levels of all the five variables (X1 to X5) in the Nutrimix flour (NF). It helped to arrive at the desired level of calcium content in the flour as required by the lactating mother’s (one-third need of daily calcium) based on RDA guidelines by ICMR. Five variables used in the experiment were depicted in Table 1.
Table 1: Optimization of Independent Variable Levels.
| Independent Variable | Units | Symbol | Coded Level | ||
| Low (-1) | Central (0) | High (1) | |||
| Finger Millet | gm | X1 | 35 | 37.5 | 40 |
| Green Gram | gm | X2 | 25 | 27.5 | 30 |
| Semolina | gm | X3 | 10 | 11.5 | 12.5 |
| Amaranth | gm | X4 | 7.5 | 8.75 | 10 |
| Gingley Seed | gm | X5 | 12.5 | 15 | 17.5 |
The table represent the coded levels of all the independent variables used for the Nutrimix flour optimisation. Coded level of low, medium and high depict the varied amount of the ingredients mixed together to perform the study and attain a desired calcium value.
Table 1 depicted coded levels of all the independent variables used for the optimisation of Nutrimix flour. All the variables were varied with different amounts in a way to attain maximum calcium content out of mixture. The experiment ran with five factors and three levels (Table 2). The Design expert tool helped us to achieve the unbiased results in the random run. The analysis aimed to achieve maximum calcium (Y1) in the Nutrimix flour with the help of five variables.
Table 2: RSM Predicted Values of Calcium Content in Nutrimix Flour.
| Experiment Number | Point Type | Blocks | X1 | X2 | X3 | X4 | X5 | Response (Y1-Calcium) |
| 1 | 2 | 1 | -1 | -1 | 0 | 1 | 0 | 391.875 |
| 2 | 2 | 1 | 1 | -1 | 0 | 0 | 0 | 410.075 |
| 3 | 2 | 1 | -1 | 1 | 0 | 0 | 0 | 398.075 |
| 4 | 2 | 1 | 1 | 1 | 0 | 0 | 0 | 416.275 |
| 5 | 2 | 1 | 0 | 0 | -1 | -1 | 0 | 401.85 |
| 6 | 2 | 1 | 0 | 0 | 1 | -1 | 0 | 402.25 |
| 7 | 2 | 1 | 0 | 0 | -1 | 1 | 0 | 405.9 |
| 8 | 2 | 1 | 0 | 0 | 1 | 1 | 0 | 406.3 |
| 9 | 2 | 1 | 0 | -1 | 0 | 0 | -1 | 364.725 |
| 10 | 2 | 1 | 0 | 1 | 0 | 0 | -1 | 370.925 |
| 11 | 2 | 1 | 0 | -1 | 0 | 0 | 1 | 437.225 |
| 12 | 2 | 1 | 0 | 1 | 0 | 0 | 1 | 443.425 |
| 13 | 2 | 1 | -1 | 0 | -1 | 0 | 0 | 394.775 |
| 14 | 2 | 1 | 1 | 0 | -1 | 0 | 0 | 412.975 |
| 15 | 2 | 1 | -1 | 0 | 1 | 0 | 0 | 395.175 |
| 16 | 2 | 1 | 1 | 0 | 1 | 0 | 0 | 413.375 |
| 17 | 2 | 1 | 0 | 0 | 0 | -1 | -1 | 365.8 |
| 18 | 2 | 1 | 0 | 0 | 0 | 1 | -1 | 369.85 |
| 19 | 2 | 1 | 0 | 0 | 0 | -1 | 1 | 438.3 |
| 20 | 2 | 1 | 0 | 0 | 0 | 1 | 1 | 442.35 |
| 21 | 2 | 1 | 0 | -1 | -1 | 0 | 0 | 400.775 |
| 22 | 2 | 1 | 0 | 1 | -1 | 0 | 0 | 406.975 |
| 23 | 2 | 1 | 0 | -1 | 1 | 0 | 0 | 401.175 |
| 24 | 2 | 1 | 0 | 1 | 1 | 0 | 0 | 407.375 |
| 25 | 2 | 1 | -1 | 0 | 0 | -1 | 0 | 392.95 |
| 26 | 2 | 1 | 1 | 0 | 0 | -1 | 0 | 411.15 |
| 27 | 2 | 1 | -1 | 0 | 0 | 1 | 0 | 397 |
| 28 | 2 | 1 | 1 | 0 | 0 | 1 | 0 | 415.2 |
| 29 | 2 | 1 | 0 | 0 | -1 | 0 | -1 | 367.625 |
| 30 | 2 | 1 | 0 | 0 | 1 | 0 | -1 | 368.025 |
| 31 | 2 | 1 | 0 | 0 | -1 | 0 | 1 | 440.125 |
| 32 | 2 | 1 | 0 | 0 | 1 | 0 | 1 | 440.525 |
| 33 | 2 | 1 | -1 | 0 | 0 | 0 | -1 | 358.725 |
| 34 | 2 | 1 | 1 | 0 | 0 | 0 | -1 | 376.925 |
| 35 | 2 | 1 | -1 | 0 | 0 | 0 | 1 | 431.225 |
| 36 | 2 | 1 | 1 | 0 | 0 | 0 | 1 | 449.425 |
| 37 | 2 | 1 | 0 | -1 | 0 | -1 | 0 | 398.95 |
| 38 | 2 | 1 | 0 | 1 | 0 | -1 | 0 | 405.15 |
| 39 | 2 | 1 | 0 | -1 | 0 | 1 | 0 | 403 |
| 40 | 2 | 1 | 0 | 1 | 0 | 1 | 0 | 409.2 |
| 41 | 0 | 1 | 0 | 0 | 0 | 0 | 0 | 404.075 |
| 42 | 0 | 1 | 0 | 0 | 0 | 0 | 0 | 404.075 |
| 43 | 0 | 1 | 0 | 0 | 0 | 0 | 0 | 404.075 |
| 44 | 0 | 1 | 0 | 0 | 0 | 0 | 0 | 404.075 |
| 45 | 0 | 1 | 0 | 0 | 0 | 0 | 0 | 404.075 |
| 46 | 0 | 1 | 0 | 0 | 0 | 0 | 0 | 404.075 |
The table represents the 46 runs performed by the RSM. The five factors (X1, X2, X3, X4 and X5) along with three levels of low, medium and high underwent various combinations to arrive at the response (Y1) representing calcium. The response (Y1) form the further basis of the lab experiments and help achieve the optimized calcium value.
The finger millet ranged from 35 – 40 gm, green gram from 25 – 30 gm, semolina from 10 – 12.5 gm, amaranth seeds from 7.5 – 10 gm, and gingley seeds from 12.5 – 17.5 gm were used in the experiment. The full quadratic polynomial equation, chosen as the best-fitted model to showcase the factor influence and their interactions on the response14 15.
Procedure
Preparation of Nutrimix Flour
A digital scale weighed all the ingredients. Ingredients were pre-processed as depicted in the steps given in Figure 1.
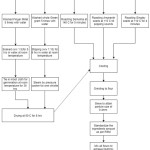 |
Figure 1: 3-D Flow Diagram Representing Pre-Processing of Nutrimix Ingredients. |
The above flow chart represents the various steps involved in the preparation of the ingredients starting from washing to grinding, to prepare flour. The various parameters like temperate, duration, and other methodologies used are shared.
Pre-Processing of Ingredients
Clean the hundred gm of finger millet by washing it five times in the tap water and soaked (w/v 1:5) at room temperature (28±2 °C) for five hours. After soaking, drain off the water and keep the grains in a moist cloth. The germination process takes twenty-four to thirty-six hours and dries them at (50±1°C) using a hot air tray dryer until the reading becomes constant in approximately eight hours. Cooldown the dried finger millet for thirty minutes at room temperature. Grind the millet after removing the vegetative growth by hand to achieve a particle size of 0.4 mm by using an electro-mechanical sieve shaker of 60-30 (0.5 mm – 0.25 mm).
Wash the hundred gm of Green Gram five times in tap water. Steep (w/v 1:10) the seeds at room temperature (28±2 °C) for six hours and steam for one whistle in a pressure cooker. Mash the seeds and use a hot air tray dryer at 50°C and grind the seeds to achieve the particle size of 0.4 mm
Roast the Semolina, Amaranth, and Gingley seeds. Roast Semolina at 140°C for 5 minutes, Amaranth at 115°C till popping sounds, and Gingelly seeds at 110°C for 4 minutes. Cool the seeds at room temperature and grind the seeds to achieve a particle size of 0.4 mm
Analytical Procedure
Development of a Second-Order Model
ANOVA was performed on the data obtained from the simulations. P-value was determined from the difference in means for the study. For p value less than 0.05, lack of fit and coefficient of determination were further analysed. The model was deemed fit after the analysis.
Quadratic polynomial equation identified the relationship between independent variables and response. The equation is given as below (7)
Y1: Response
X1, X2, X3: Independent variable
βi – Linear parameter coefficient
β0 – Constant
βii – Quadratic parameter coefficient
βij – Interaction parameters coefficients
k – Different variables
ɛ – Value of residual
Proximate Analysis – Nutrimix Flour
The optimized sample was analysed for the estimation of proximate principles. FSSAI, lab manual 10 16,17,18 used for estimation of the following parameters:
- Iron
- Calcium
- Moisture
- Crude Fat
- Total Protein
- Crude Fiber
- Ash contents
Difference method used for determining Carbohydrates.
Energy value = {(Total carbohydrates per 100 gm + Crude protein per 100 gm) x 4 Kcal} + {(Crude Fat per 100 gm) x 9 Kcal}19
Functional Properties – Nutrimix Flour
Functional properties of Nutrimix flour were analysed as listed below:
- Swelling capacity – ml
- Water absorption – WAC%
- Oil absorption capacity – OAC%
- Emulsion activity – EA%
- Emulsion stability – ES%
- Bulk density – kg/m3
Swelling Capacity
20 had described the method to determine the swelling capacity. Fill ten ml mixture sample in a two hundred ml graduated cylinder. Add fifty ml of distill water to increase the total volume. Cover and invert the mixture in the cylinder. The mixture was inverted for two minutes and stand still for eight minutes. Later on, the sample volume at 8th min was taken as experimental reading.
Water Absorption Capacity
21 had described the method to determine water absorption. Add ten ml of distill water in one gm of Nutrimix flour and let it remain in the same position for thirty minutes at room temperature. Centrifuge mixture at three thousand rpm for thirty minutes. Water absorption was determined as % water/gram flour.
Oil Absorption Capacity
Ten ml of the soybean oil (Specific gravity: 0.90) was mixed with the one gm of the Nutrimix flour and let it remain in the same position for thirty minutes at room temperature. Centrifuge mixer at three thousand rpm for thirty minutes. Oil absorption was determined as % oil/gram flour 21.
Emulsion Activity and Capacity
Mix Ten ml of distilled water with one gm of Nutrimix flour and ten ml of soybean oil. Centrifuge the sample at three thousand rpm for five minutes.
The height of the emulsion layer divided by the total height of the mixture gives the emulsion activity percentage22.
Emulsion Stability
Heat the emulsion in a centrifuge for thirty minutes at 80ºC in a water-cooled bath. Cool for fifteen minutes with tap water and centrifuge at three thousand rpm for fifteen minutes. The height of the emulsified layer divided by the total height of the mixture gives the emulsion stability.
Bulk Density
A hundred gm of flour was measured in a cylinder and tap it on a wooden plank until volume can no further be decreased. Bulk density is computed based on weight and volume.
Results and Discussion
Optimization Process
Design-Expert version 11 software was used in the numerical optimization of independent variables. It was performed as per the criteria mentioned in Table 1. The response namely calcium content, under consideration, in Nutrimix flour was based on WHO and RDA guidelines for lactating mothers that fulfill one-third of calcium daily needs 9.
Response Surface Model Fitment Discussion
Response Surface Methodology based study was performed to determine the Calcium content variation with the changing quantity of Nutrimix flour ingredients. Five numeric factors on a three-level form the basis of Box Behnken’s study. Low, High, and Central levels in the forty-six random runs were executed by the RSM. Central value helped in minimizing any issue. The ingredients were optimized during the forty-six simulation run.
Details of the RSM predicted values of Calcium content in Nutrimix Flour were presented in Table 2. A second level polynomial equation was referred to and used to achieve the optimum calcium. Table 3 depicted the equations of actual independent variables.
Table 3: Coded Independent Variables for the Nutrimix Flour.
| √Calcium | = |
| 20.10161685 | |
| 0.226538013 | A |
| 0.077171171 | B |
| 0.004978776 | C |
| 0.050410146 | D |
| 0.90262966 | E |
| -0.000868568 | AB |
| -5.60346E-05 | AC |
| -0.000567359 | AD |
| -0.010207733 | AE |
| -1.90834E-05 | BC |
| -0.000193222 | BD |
| -0.003476369 | BE |
| -1.24655E-05 | CD |
| -0.000224274 | CE |
| -0.002270805 | DE |
| -0.001279228 | A² |
| -0.000146787 | B² |
| 1.28814E-06 | C² |
| -6.15421E-05 | D² |
| -0.020279145 | E² |
The coded factors equation can be used to make predictions about the response for given levels of each factor (A, B, C, D and E). Factors are ingredients used in the study with a label as A, B, C, D and E. By default, the high levels of the factors are coded as +1 and the low levels are coded as -1. The coded equation is useful for identifying the relative impact of the factors by comparing the factor coefficients.
The quadratic equation gives the predicted values of responses based on the various permutation and combinations of the variables. -1, 1 and 0 are assigned to Low, high and central levels respectively. The ANOVA computations are shown in Table 4.
Table 4: ANOVA Computation of the Calcium in Nutrimix Flour.
| Source | Sum of Square | df | Mean Square | F value | p-value (Prob > F) | Result |
| Model | 13.99800196 | 20 | 0.699900098 | 10192369.53 | 1.55642E-81 | significant |
| A-Finger Millet | 0.821111543 | 1 | 0.821111543 | 11957524.07 | 1.5935E-72 | |
| B-Green Gram | 0.095286235 | 1 | 0.095286235 | 1387615.92 | 7.84185E-61 | |
| C-Semolina | 0.000396611 | 1 | 0.000396611 | 5775.694682 | 4.26822E-31 | |
| D-Amaranth | 0.040658924 | 1 | 0.040658924 | 592099.905 | 3.29397E-56 | |
| E-Gingley Seed | 13.03584485 | 1 | 13.03584485 | 189835875.4 | 1.56009E-87 | |
| AB | 3.01764E-06 | 1 | 3.01764E-06 | 43.94472221 | 6.03488E-07 | |
| AC | 1.25595E-08 | 1 | 1.25595E-08 | 0.182899054 | 0.67255501 | |
| AD | 1.28759E-06 | 1 | 1.28759E-06 | 18.750595 | 0.00021142 | |
| AE | 0.000416791 | 1 | 0.000416791 | 6069.566788 | 2.30101E-31 | |
| BC | 1.4567E-09 | 1 | 1.4567E-09 | 0.021213318 | 0.885367324 | |
| BD | 1.49339E-07 | 1 | 1.49339E-07 | 2.174764324 | 0.15277406 | |
| BE | 4.83406E-05 | 1 | 4.83406E-05 | 703.9647067 | 7.87146E-20 | |
| CD | 6.21553E-10 | 1 | 6.21553E-10 | 0.009051426 | 0.924962925 | |
| CE | 2.01194E-07 | 1 | 2.01194E-07 | 2.92991588 | 0.099332478 | |
| DE | 2.06262E-05 | 1 | 2.06262E-05 | 300.3716476 | 1.92381E-15 | |
| A² | 1.42815E-05 | 1 | 1.42815E-05 | 207.9760414 | 1.27123E-13 | |
| B² | 1.88042E-07 | 1 | 1.88042E-07 | 2.738387675 | 0.110465756 | |
| C² | 1.44809E-11 | 1 | 1.44809E-11 | 0.000210879 | 0.988529056 | |
| D² | 3.30539E-08 | 1 | 3.30539E-08 | 0.481351125 | 0.494207615 | |
| E² | 0.003589036 | 1 | 0.003589036 | 52265.71777 | 4.92796E-43 | |
| Residual | 1.71673E-06 | 25 | 6.8669E-08 | |||
| Lack of Fit | 1.71673E-06 | 20 | 8.58363E-08 | |||
| Pure Error | 0 | 5 | 0 | |||
| Cor Total | 13.99800368 | 45 |
The Model F-value of 10192369.53 strongly suggested that the model is significant. There is only a 0.01% chance that an F-value this large could occur due to noise. P-values less than 0.0500 indicate model terms are significant. In this case, A, B, C, D, E, AB, AD, AE, BE, DE, A², E² are significant model terms. Values greater than 0.1000 indicate the model terms are not significant.
Optimized Values Post-RSM
Response surface method computed the calcium content based on the Nutrimix flour ingredients quality of responses. Based on the maximum calcium content obtained from the optimized ingredients of Nutrimix flour is shown in Table 5, Figure 2, Figure 3 and Figure 4.
Table 5: Nutrimix Flour Optimum Values.
| Ingredients | Optimized amount (gm) |
| Finger Millet | 37.5 |
| Green Gram | 27.5 |
| Semolina | 11.25 |
| Amaranth Seed | 8.75 |
| Gingley Seed | 15 |
The above table represents the optimized values of the ingredients which help us achieve the required calcium content in the Nutrimix flour. This combination of ingredients is being further analysed through various graphs and 3-D figures.
The mixing ratio is formulated from a variety of ingredients as Finger Millet (37.5 g), Semolina (11.25 g), Green Gram (27.5 g), Amaranth Seeds (8.75 g), and Gingley Seeds (15 g).
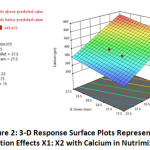 |
Figure 2: 3-D Response Surface Plots Representing Interaction Effects X1: X2 with Calcium in Nutrimix Flour. |
The above figure represents a relationship between X1 : X2 parameters and their effect on the response ( Y1), keeping all other parameters constant. X-axis shows A ( finger millet), Y-axis shows B (Green gram) and Z-axis shows Response (Calcium). The red dot in the middle of the 3D image represents the optimum value obtained from RSM and shows the variation of calcium content across the surface with a variation of parameters (A and B).
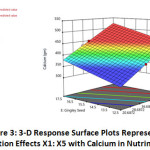 |
Figure 3: 3-D Response Surface Plots Representing Interaction Effects X1: X5 with Calcium in Nutrimix Flour. |
The above figure represents a relationship between X1 : X2 parameters and their effect on the response ( Y1), keeping all other parameters constant. The X-axis shows A (finger millet), Y-axis shows B (Gingley seeds) and Z-axis shows Response (Calcium). The red dot in the middle of the 3D image represents the optimum value obtained from RSM and shows the variation of calcium content across the surface with a variation of parameters (A and B).
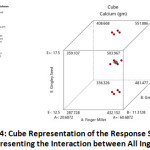 |
Figure 4: Cube Representation of the Response Surface Plots Representing the Interaction between all Ingredients. |
The cube above represents a relationship between X1 : X2: X3 parameters and their effect on the response ( Y1), keeping all other parameters constant. The X-axis shows A ( finger millet), Y-axis shows B (Green gram) and Z-axis shows E (Gingley seeds). The red dot in the middle of the 3D image represents the optimum value obtained from RSM and shows the variation of calcium content across the surface with a variation of parameters (A, B and E).
Verification and Validation of Box-Behnken Model
Experimental evaluation of Nutrimix flour calcium values performed, as explained in section 2.2, to verify the RSM model results accuracy. Experimental and predicted values were almost the same with no significant variation.
RSM model recommended standardizing the different ingredients for preparing the flour. Under the optimum conditions which included Nutrimix Flour: Green Gram (72.5 gm: 19 gm), Green Gram: Cumin Seeds (19 gm: 8.5 gm).
Proximate Analysis
Proximate analysis of optimized Nutrimix flour was estimated. Along with the proximate analysis, calcium and iron estimation were done for the optimized product. Refer to Table 6 for more details.
Table 6: Proximate Composition of Nutrimix Flour.
| Parameter | Nutrimix Flour(per 100 g) |
| Moisture (%) | 7.7±0.2* |
| Crude Fat (%) | 6.80±36* |
| Total Ash (%) | 2.4±0.34* |
| Crude Fibre (%) | 2.04±0.30* |
| Protein (%) | 16.4±0.99* |
| Carbohydrates (g) | 65.6±0.22* |
| Energy Value (Kcal) | 389.29±1.24* |
| Iron (mg) | 4.8±0.14* |
| Calcium(mg) | 398.2±0.89* |
The above table represents the various proximate analytical Mean ±SD values of different parameters in the Nutrimix flour, analysed individually in triplicate. Here, * indicates a non-significant difference.
The Nutrimix flour had medium level moisture of 7.7±0.2%, calcium 398.2±0.89 g, iron content was 4.8±0.14mg and had an energy of 389.29±1.24 kcal. The crude fiber was moderate with 2.04±0.30% and protein content of 16.4±0.99%. The crude fat was a moderate value of 6.80±36% with Total ash content as 2.4±0.34%.
Results showed that optimized Nutrimix flour is calcium and protein-rich and it is fulfilling approximately one-third of the RDA for lactating mothers (0-6 months).
Functional Properties
The functional properties of the Nutrimix flour have been listed in Table 7.
Table 7: Functional Properties of Nutrimix Flour.
| Parameter | Nutrimix Flour( per 100 g) |
| Swelling Capacity (ml) | 16.2±0.21* |
| Water absorption capacity (%) | 40.4±0.44* |
| Oil absorption capacity (%) | 36±0.9* |
| Emulsion activity and capacity (%) | 42.7±0.3* |
| Emulsion stability (%) | 47.6±0.4* |
| Bulk density(kg/m³) | 762±1.5* |
The above table represents the various functional Mean ±SD value of different properties in the Nutrimix flour, analysed individually in triplicate. Here, * indicates a non-significant difference.
The swelling capacity of 16.2±0.21 ml was determined in the Nutrimix flour. Swelling capacity varies with particle size, type of variety and processing methods.
The maximum Water Absorption Capacity (WAC) of Nutri flour may be attributed to starch (Carbohydrates) and fiber within the flour. Water Absorption Capacity could be a crucial attribute of proteins in food merchandise like dough and baked products23. A WAC 40.4±0.44% and Oil Absorption capacity 36±0.9% was determined within the samples.
The Water and Oil Binding Capacity (OAC) of the food macromolecule depends upon the intrinsic factors. Aminoalkanoic acid composition, surface polarity and macromolecule conformation are some factors that affect binding capability.
The ability of the proteins present in the Nutrimix flour makes is important for appropriate oil absorption in food. Oil Absorption Capacity leads to a flavour enhancement and mouthfeel in various food dishes. Emulsion Activity 42.7±0.3% and Emulsion stability 47.6±0.4 % was observed in the Nutrimix flour.
The distinction between all-time low emulsifying activity and also the highest emulsion stability would compute the EA. Emulsifying properties are affected by the hydrophobicity of protein24. Solubility, pH, and concentration square measure numerous factors that influence the emulsifying properties of the protein.
Protein’s capability to reinforce its formation and stabilization is vital for varied emulsions and their associated applications in food merchandise like cake, and frozen items. In these merchandises, a varied emulsifying and stabilizing capability is needed, thanks to their varied compositions and processes25.
Increasing Emulsion Activity (EA), Emulsion Stability (ES), and fat binding throughout the food process are the primary practical properties of the macromolecule. These properties are vital in numerous food products like various dressing, frozen desserts, and salad dressing.
The Bulk density 762±1.5 Kg/m³ depends upon the particle size and initial wetness content of flours. The high bulk density of flour suggests its suitableness be used in food preparations. Low bulk density would be a bonus within the formulation of complementary foods26.
Conclusion
Response Surface Methodology was used effectively in Calcium Rich Nutrimix Flour preparation. It helped to optimize, different kinds of ingredients in flour which are beneficial for boosting the recommended daily requirement of lactating mothers as recommended by NIN. During lactation, there are increased demands of micronutrients and macronutrients which help both to maintain a mother’s health and growing child. In India, there is a low focus on the calcium needs of the lactating mother as compared to pregnant mothers.
The mixing ratio is formulated from a variety of ingredients as Finger Millet (37.5 g), Semolina (11.25 g), Green Gram (27.5 g), Amaranth Seeds (8.75 g), and Gingley Seeds (15 g). The nutrient content of the optimized flour was calcium (398.2±0.89 mg), Iron (4.8±0.14 mg), Moisture (7.7±0.2%), Protein (16.4±0.99%), Carbohydrates (65.6±0.22 g), Energy Value (389.29±1.24 Kcal), and Crude fat (2.04±0.30%).
Based on experimental results, we were able to meet the recommended daily allowances of the lactating mother (0-6months) in the Nutrimix flour. The formulated Nutrimix flour is rich in calcium, protein contents and is suitable to be used in various ready to cook food.
This optimized product could be a good option for lactating mothers as all ingredients are traditionally accepted and consumed during this period. The prepared Nutrimix Flour can be used directly or can be used as a Ready to use food for preparing various recipes and would help to bridge the gap of nutrients and increased needs for lactating mothers.
Acknowledgements
None
Funding Sources
It is a self-funded study. No external funds were available.
Conflict of Interest
The authors have no conflict of interest to report.
References
- Balk EM, Adam GP, Langberg VN, et al. Global dietary calcium intake among adults: a systematic review. Osteoporos Int. 2017;28(12):3315-3324. doi:10.1007/s00198-017-4230-x.
CrossRef - Thomas M, Weisman SM. Calcium supplementation during pregnancy and lactation: Effects on the mother and the fetus. Am J Obstet Gynecol. 2006;194(4):937-945. doi:10.1016/j.ajog.2005.05.032.
CrossRef - Ervin RB, Wang CY, Wright JD, Kennedy-Stephenson J. Dietary intake of selected minerals for the United States population: 1999-2000. Adv Data. Published online 2004.
- Maternal Health Division Ministry of Health and Family Welfare. Designed and printed with support from UNICEF. 2014;(December). http://www.nrhmorissa.gov.in/writereaddata/Upload/Documents/National_Guidelines_for_Screening_of_Hypothyroidism_during_Pregnancy.pdf
- Black RE, Allen LH, Bhutta ZA, et al. Maternal and child undernutrition: global and regional exposures and health consequences. Lancet. 2008;371(9608):243-260. doi:10.1016/S0140-6736(07)61690-0.
CrossRef - Prentice A. C ALCIUM IN P REGNANCY AND L ACTATION . Annu Rev Nutr. Published online 2000. doi:10.1146/annurev.nutr.20.1.249.
CrossRef - Laskey MA, Prentice A. Bone mineral changes during and after lactation. Obstet Gynecol. 1999;94(4):608-615. doi:https://doi.org/10.1016/S0029-7844(99)00369-5.
CrossRef - Kalkwarf H, Children C, Eating P. Calcium in Human Health. Calcium Hum Heal. 2006;(February). doi:10.1007/978-1-59259-961-5.
CrossRef - Guideline: Calcium supplementation in pregnant women. World Heal Organ. 2013;70(04):1-35. doi:10.1016/S0065-3233(04)70004-2.
- prasad vandana, holla radha, gupta Should India Use Commercially Produced Ready To Use Therapeutic Foods (RUTF) For Severe Acute Malnutrition (SAM) ? Soc Med. 2009;4(1):52-55. http://www.socialmedicine.info/index.php/socialmedicine/article/view/284.
- Dube B, Rongsen T, Mazumder S, et al. Comparison of ready-to-use therapeutic food with cereal legume-based Khichri among malnourished children. Indian Pediatr. 2009;46(5):383-388.
- Gunst RF, Myers RH, Montgomery DC. Response Surface Methodology: Process and Product Optimization Using Designed Experiments. Technometrics. 1996;38(3):285. doi:10.2307/1270613.
CrossRef - Danbaba N, Nkama I, Badau MH. Application of Response Surface Methodology (RSM) and Central Composite Design (CCD) to Optimize Minerals Composition of Rice-Cowpea Composite Blends during Extrusion Cooking. Int J Food Sci Nutr Eng. 2015;5(1):40-52. doi:10.5923/j.food.20150501.06.
- Tan MC, Chin NL, Yusof YA. A Box-Behnken Design for Determining the Optimum Experimental Condition of Cake Batter Mixing. Food Bioprocess Technol. 2012;5(3):972-982. doi:10.1007/s11947-010-0394-5.
CrossRef - Shi A, Wang Q, Liu H, et al. Peanut Processing Quality Evaluation Technology. In: Peanuts: Processing Technology and Product Development. ; 2016. doi:10.1016/B978-0-12-809595-9.00002-8.
CrossRef - 17th edn 2000 Official Method 986.21,Moisture in Spices / I.S Specification No I.S 1797 – 1985. Methods Test Spices Condiments. Published online 2000.
- Safety F, Authority S, Health MOF, Welfare F, Delhi NEW. Manual of Methods of Analysis of Foods Food Safety and Standards Authority of India Manual for Methods of Analysis of Mycotoxins. Published online 2016.
- Additives F. Manual of Methods of Analysis of Foods Food Additives. Analysis. Published online 2005.
- Atwater WO, Benedict FG. An experimental inquiry regarding the nutritive value of alcohol. 1902. Obes Res. Published online 1993. doi:10.1002/j.1550-8528.1993.tb00616.x.
CrossRef - OKAKA JC, POTTER NN. PHYSICO‐CHEMICAL AND FUNCTIONAL PROPERTIES OF COWPEA POWDERS PROCESSED TO REDUCE BEANY FLAVOR. J Food Sci. Published online 1979. doi:10.1111/j.1365-2621.1979.tb03488.x.
CrossRef - SOSULSKI FW, McCURDY A. Functionality of Flours, Protein Fractions and Isolates from Field Peas and Faba Bean. J Food Sci. Published online 1987. doi:10.1111/j.1365-2621.1987.tb14263.x.
CrossRef - Yasumatsu K, Sawada K, Moritaka S, et al. Whipping and Emulsifying Properties of Soybean Products. Agric Biol Chem. 1972;36(5):719-727. doi:10.1080/00021369.1972.10860321.
CrossRef - Adeyeye EI. Chemical composition and food properties of six cultivars (whole and dehulled) of African yam bean (Sphenostylis Stenocarpa) flours. In: Beans: Nutrition, Consumption and Health. ; 2012.
- Kaushal P, Kumar V, Sharma HK. Comparative study of physicochemical, functional, antinutritional and pasting properties of taro (Colocasia esculenta), rice (Oryza sativa) flour, pigeonpea (Cajanus cajan) flour and their blends. LWT – Food Sci Technol. Published online 2012. doi:10.1016/j.lwt.2012.02.028.
CrossRef - Adebowale YA, Adeyemi IA, Oshodi AA. Functional and physicochemical properties of flours of six Mucuna species. African J Biotechnol. Published online 2005. doi:10.5897/AJB2005.000-3223.
- Akpata MI, Akubor PI. Chemical composition and selected functional properties of sweet orange (Citrus sinensis) seed flour. Plant Foods Hum Nutr. Published online 1999. doi:10.1023/A:1008153228280.
CrossRef

This work is licensed under a Creative Commons Attribution 4.0 International License.


