The Effect of HCl-Thermal Pressure Hydrolysis and High-Speed Destruction of Chitin on Particle Size Distribution and Functional Group of Nano-chitin Compound
Asri Silvana Naiu1
, Roike Iwan Montolalu2, , 1Department of Fishery Product Technology, Faculty of Fisheries and Marine Science, Gorontalo State University, 6 Jend. Sudirman Street Gorontalo, Indonesia.
2Faculty of Fisheries and Marine Science, Sam Ratulangi University, Manado, Indonesia.
3Faculty of Fisheries and Marine Science, Bogor Agricultural University, Kampus IPB Darmaga, Bogor, Indonesia.
Corresponding Author Email: asri.silvana@ung.ac.id
DOI : http://dx.doi.org/10.12944/CRNFSJ.8.1.18
Download this article as:
![]()
Chitin application in agriculture or food industries is still very limited because it is insoluble in many types of solvents and its fragility is relatively low. Therefore, experiments to increase solubility and fragility of chitin in some solvents are still needed. Destruction chitin to nano particles can alter the chitin physical feature to be more reactive and have more optimal performance. Chitin nanoparticle powder has been produced through hydrolysis of chitin by diluted chloride acid (HCl 3M) in 3 different treatments of chitin and acid solution ratio, i.e 1:10 (M1), 1:12 (M2), and 1:14 (M3) followed with the use of 1 atm-pressure and chitin physical destruction at the speed of 22,000 rpm in order to cut the chitin polymers into smaller sizes. The size of chitin was measured using particle size analyzer (PSA), while the functional group of the compound was examined using spectrophotometer Fourier Transform Infrared (FTIR). Results showed that mean size ranged from 185.4 nm to 319.3 nm with polydispersity index (PI) of 0.29 to 0.366. The functional group of the compound reflects the absorption pattern in nearly similar wavelength to the IR spectrum of standard chitin, i.e 896.9 cm -1, indicating ß-1,4-glycosidic bond, 1311.59 cm -1 and 1379 cm -1 indicating the presence of C-N on amide (-NHCOCH3-), 3200 cm-1representing the presence of N-H group in amide and the appearance of peak in wave value of 1610-1680 cm -1 that is stretching vibration area of C=0 in amide part. The solubility rate of the particles ranged from 68.92% to 71.72% which showed an increasing by decreasing the volume of HCl used in hydrolyzing chitin
KEYWORDS:Nano Chitin; PSA; Thermal Pressure Hydrolysis
Introduction
Chitin is a biopolymer compound contained in the skeleton or skin of crustaceans, insects, and the cell of several fungi groups (Synowiecki & Al-Khateeb, 2003)1 and consisting of monomers 2-acetamide-2-deoxy D-glucose (N-acetyl glucosamine) (Horton 2002).2 Chitin (C8H13NO5) is an amorphous solid or white crystal-shaped natural polysaccharide that is biodegradable, hydrophobic, insoluble in the water, dilute organic acids, organic acids, strong alkaline, and organic solvents, but soluble in strong acids, such as sulphuric acid, nitric acid, and phosphoric acid (Junianto, 2008).3 The presence of chitin in nature is generally bound with protein, mineral, and various pigments. Kaya et al., (2013)4 reported that presentation of chitin in crustacean Gammarus argaeus was 11% (db)-12% (db). It has been applied in various industries, such as medicine, food, agriculture, waste treatment, cosmetics, and biotechnology, but its usage is still very limited because of its insolubility in many solvents and relatively low reactivity. Therefore, it is necessarily to formulate chitin into soluble form in the water and other solvents. Polyamide structure in chitin, according to Austin & Brine (1976),5 needs to be broken down to obtain chitin solubility. So far, chitin is, in general, transformed to chitosan that has higher solubility. Chitosan has solubility of 79.39%, while chitin does 28% (Rochima, 2007).6 Besides converting chitin to chitosan through deacetylation, it can be physically, chemically, enzymatically converted to microfiber chitin, nanofiber chitin or chitin powder of nano particles. Nano-sized material is believed to have bigger energy because it has large area to increase contact with other particles and yields more optimal performance in mixing.
Formation of nano-fibered chitin or chitin of nano particle has been conducted through several methods, such as electrospinning technique (Pillai & Sharma, 2009),7 chitin hydrolysis using strong acid followed with repeated centrifugation(Revol &Marchessault, 1993),8 and hydrolysis with strong acid followed with ultrasound treatment (Kumar & Bhat, 2018),9 but the use of concentrated acids is not safe due to high risks on either the workers or environment. Previous study (Ernawati, 2012)10 employs high concentration of HCl (9.2 to 18.5% or 3 to 6M) with autoclave method has not yielded water-soluble chitin hydrolysate.
Synthesis of nano particle chitin powder in this study used dilute chloride acid (3 M HCl) as chitin hydrolyzing agent with treatment variations in chitin and acid solution ratio accompanied with 1 atm pressure and followed with chitin destruction at high speed in order to cut the chitin polymer into smaller size. Pre-research phase obtained water soluble chitin hydrolysate that needs further study on particle size examination with PSA and compound functional group using Fourier Transform Infrared (FTIR) spectrophotometer.
IR spectrophotometer is, in general, employed to determine the functional group of an organic compound and obtain information on organic compound structure by comparing the fingerprint area (Dachriyanus, 2004).11 Qualitative determination can be done by comparing the peak height (transmittance) produced by the tested substance or standard substance at certain wavelength. This analysis is used to know whether there is reaction or interaction between the mixed materials. Besides, the detected group intensity value can determine the amount of substance reacting or contained in a mixture (Sunariyo, 2008).12
Materials and Method
Material
Materials used to synthesize nanochitin were commercial chitin (CV. Bio Chitosan Indonesia), 3M HCl (Merck), 96% ethanol (technical grade) and distilled water, while functional group testing used potassium bromide (KBr).
Method
Nanochitin Synthesis
Nanochitin synthesis started with hydrolyzing chitin following Revol and Marchessault (1993)8 and Broers et al., (2018)13 modified at chitin and dilute acid solution ratio, and chitin destruction used a Tokebi Platinum homogenizer. Chitin hydrolysis used 3M HCl with 3 chitin and acid ratios, i.e. 1: 10 (M1), 1: 12 (M2), and 1: 14 (M3) at 100°C for 90 min. at 1 atm pressure. After hydrolyzed, the acid solution was removed and then replaced with 96% ethanol. Chitin suspension in the ethanol was crushed with a high-speed homogenizer (22,000 rpm) for 10 min., then centrifuged at 6,000 rpm for 30 min. The supernatant was removed, the deposits were rewashed in ethanol, and then centrifuged at 6,000 rpm for 10 min. The deposit obtained was dried at 80°C for 4 hours, then ground to yield chitin powder of nano particle.
Particle Size Analysis
The chitin nano particle was measured with version 1.34/2.00 Beckman Coulter DelsaTM Nano Particle Size Analyzer (PSA) using water solvent at 25°C. Nano chitin sample was dispersed in the water then passed with photon ray to react with the particle. Dispersion of the particle ray creates fluctuation in distribution intensity and clumped in the selected corner, then measured with sensitive detector. The intensity of the interaction was translated in particle size diameter on data display. Nano particle examination was carried out in the Laboratory of Nanotech Herbal Indonesia, Serpong Gunung Sindur, Bogor.
Particle Solubility Analysis
The solubility testing procedure refers to the modified of Gontard et al., (1992).14 The percent of solubility was the percentage of dry matter of nanochitin solubilized after 6 hours immersion in water. The weight of initial dry matter of particles was determined at 100°C for 24 hr.
0.1-0.2 g particles of nanochitin were weighed, immersed into 50 mL of water then slowly and periodically agitated for 6 hr at room temperature. The particles were then taken out and dried (1OO’C for 24 hr) to determine the weight of dry matter which was not solubilized in water. The percentage of dry matter solubilized was calculated by subtracting the weight of dry matter not solubilized from the weight of initial dry matter and reported on dry weight basis.
Fourier-Transform Infrared Spectroscopy Analysis
Infrared spectra of KBr and chitin mixtures were obtained over the frequency range of 400 to 4,000 cm−1 at a resolution of 4 cm−1 using FTIR Spectrometer, IR Prestige 21-type Shimadzu. The sample was thoroughly mixed with KBr, and the dried mixture was then pressed to result in a homogeneous sample disk. In order to prepare the pellet 1.5mg of the sample was mixed with 350mg of KBr. Ground mixture well and 100mg of the powder was spread uniformly in the die and pressed to make the pellet. The baseline was recorded and the pellet was mounted on the pellet on the die holder of the spectrophotometer with the help of tweezer. The spectrum was recorded from 400 to 4,000 cm−1. The background (baseline) reading was subtracted and the resulting values were compared with a spectrum of standard chitin. FTIR analysis was done in the Laboratory of Mineral and Material Maju FMIPA, UM Malang.
Statistical Analysis
All the experiments were carried out in triplicate and represented as mean ± standard deviation. The data were statistically analyzed using analysis of variance and least significant difference.
Results and Discussion
The particle size, the solubility and the compound functional group of nanochitin derived from hydrolysis were characterized in order to see the difference in particle size distribution, the percentage of solubility and the change in the compound functional group due to difference in hydrolyzing acid volume.
Particle Size Distribution
The size distribution of nanochitin produced from the hydrolysis of chitin and 3M HCl at different chitin and acid solution ratio can be seen in Figure 1a to 1c. Measurement with PSA showed 3 distribution variations, 10%, 50%, and 90%. Figure 1a (treatment M1) demonstrates mean particle diameter of 185.4 ± 45.8 nm with polydispersity index (PI) of 0.30. Figure 1b (treatment M2) exhibits mean diameter of the particle size of 319.3 ± 72.7 nm with polydispersity index (PI) of 0.29, and Figure 1c (treatment M3) shows mean particle diameter of 264.1 ± 62.0 nm with Polydispersity Index (PI) of 0.366.
The results showed that the differences in the volume of HCl in hydrolyzing chitin significantly affect (p<0.05) on the particles size. The more of HCl in hydrolysis process, the larger the particle size of nanochitin.
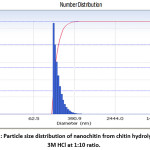 |
Figure 1a: Particle size distribution of nanochitin from chitin hydrolysis with 3M HCl at 1:10 ratio. Click here to View figure |
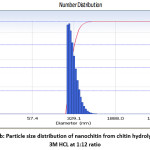 |
Figure 1b: Particle size distribution of nanochitin from chitin hydrolysis with 3M HCL at 1:12 ratio Click here to View figure |
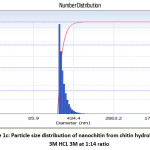 |
Figure 1c: Particle size distribution of nanochitin from chitin hydrolysis with 3M HCL 3M at 1:14 ratio Click here to View figure |
All assessed samples had PI value below 0.7 (70%) that indicated the accuracy in measurements and showed narrower size distribution pattern meaning that the particle size was more uniform. Babael et al., (2008)15 stated that PI value below 0.7 (70%) indicates narrower particle size distribution and accurate measurements.
Mean particle size of the nanochitin mostly distributed (90%) of the treatment M1, M2, and M3 was 229.7 nm, 399.1 nm, and 320.3 nm, respectively, while the least distributed particle size (10%) was 144 nm, 242.2 nm, and 209.3 nm, respectively. Compared with the chitin size used, the hydrolyzed chitin in this study is firstly 3 to 7 mm- coarse flakes-shaped. Chitin particle measurement was also done by Jenial et al., (2018)16 and found the chitin particles of 0.152-0.25 mm. Acid hydrolysis at 1 atm pressure followed with chitin crystal physical destruction using homogenizer at 22,000 rpm yielded nano-sized chitin powder.
The present study revealed that higher HCl solution volume to chitin comparison in hydrolysis yielded larger particle size. Application of pressure and high temperature (100°C) at the hydrolysis helps break the bonds of chitin polymers into smaller units. The destruction process done after pressure application takes important role in producing smaller chitin particles, but degraded particles size into smaller units make agglomeration easily occur. Nano particle tends to clump and agglomerate due to the effect of Brown movement and Van der Waals force in the solution. Nano particle clots make the size be bigger and tend to be not uniform. According to Alias et al., (2010)17, decline in the crystalite size and the particle becomes smaller cause the agglomeration easy to occur. The particle agglomeration formation originated from adjacent small particles that crashed each other (transport step), then mutually attached (attachment step), and formed bigger particles.
Solubility of Nanochitin
The solubility of a compound indicates how much a compound can dissolve in a solvent. The level of solubility of nano-chitin resulting from hydrolysis by HCl acid can be seen in Figure 2. The solubility of particles ranges from 68.92% to 71.72% and shows a decreasing by increasing volume of HCl used. However, statistical tests showed that the different in ratio of chitin and HCL treatments had no significant effect (p> 0.05) on the percentage of particle solubility.
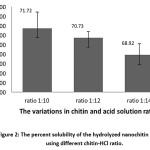 |
Figure 2: The percent solubility of the hydrolyzed nanochitin particles using different chitin-HCl ratio. Click here to View figure |
Chitin compounds have been known as compounds that are difficult to dissolve in various solvents, especially at room temperature. Hubbe, et al., (2017)18 states that chitin is still an underutilized resource mainly due to its harder molecular structure. (Rathke & Hudson, 1994)19 explained that the structure of chitin microfibrilar has potential as a fiber and film-forming, but because chitin is not soluble in common organic solvents, chitin derivatives, namely chitosan, were developed.
The formation of chitin to nano-chitin can affect its solubility. The results showed that particle size is very influential on its solubility. Chitin nano particle can dissolve in water solvents after stirring for six hours at room temperature. The solubility of nano-chitin particles in this study was not significantly different between treatments, probably caused by all nano sized particles having a large surface area. The results of this study are similar to those described by Gong, Grant, & Brittain, (2007)20 where the larger the particle diameter, the longer the time needed to dissolve the particle. According to Sinala, (2016),21 in addition to temperature and mechanical stirring, particle size has an effect on the rate of solubility. The finer the solute and the smaller the particle size, the wider surface area of the solute in contact with the solvent, and as a results the faster the solute dissolves.
Functional group spectrum of nanochitin.
Identification of functional group using FTIR was conducted at the wavelength of 500-4,000 cm-1. The functional groups of the nano-chitin derived from the synthesis of all treatments were compared with those of chitin compound reported by Tamimi and Herdyastuti (2013)22 and Dompeipen (2017),23 and N-acetyl glucosamine HCl from chitin hydrolysis was compared with HCl reported by Ernawati (2012).10 This comparison aims to see whether the nano-chitin produced still has the same functional group as chitin compound or more like N-acetyl glucosamine HCl from hydrolysis with HCl.
Inter-treatment testing of the functional group of nano-chitin compound indicated major difference in percent transmittance of the compound group and stretching tape O-H as presented in Figure 3a to 3c.The use of HCl solution volume up to 12 times the chitin weight during the hydrolysis slightly reduced the percent transmittance, but adding excessive acid solution (1:14) increased the percent transmittance of the functional groups. Increased percent transmittance indicates that IR frequency absorbed by the compound gets fewer (Dachriyanus, 2004).11 Excessive HCl in hydrolysis results in the breakage of the acetyl group of chitin and forms NH3+ and Cl– ions. Figure 2c (treatment M3, 1:14) demonstrates wider stretching tape OH on the area about 2,500 to 3,500 cm-1 because of having more acid O-H groups besides O-H of the ethanol used to terminate the hydrolysis. Dachriyanus (2004)11 claimed that O-H bond of the acid will absorb in the area between 2,500 and 3,300 cm-1, while alcohol will absorb between 3,230 and 3,550 cm-1. If this absorption appears together, the acid will give very wide sorption in the area 2,500 to 3550 cm-1.
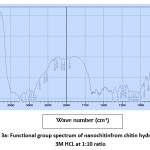 |
Figure 3a: Functional group spectrum of nanochitinfrom chitin hydrolysis with 3M HCL at 1:10 ratio Click here to View figure |
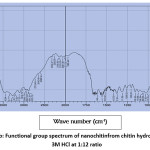 |
Figure 3b: Functional group spectrum of nanochitinfrom chitin hydrolysis with 3M HCl at 1:12 ratio Click here to View figure |
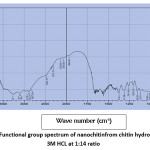 |
Figure 3c: Functional group spectrum of nanochitinfrom chitin hydrolysis with 3M HCL at 1:14 ratio Click here to View figure |
Based on the results, nano-chitin produced in all treatments showed the absorption pattern in nearly similar area, at the wavelength range of 748 to 752 cm-1 indicating the presence of C-H Alkena functional group. Besides, the peaks appear in all treatments at the wavelength of 896.9 cm -1 as an indication of tug vibration occurrence in the area indicating ß-1,4-glycosidic bond. Also, the presence of stretching absorption in the area of 1,311.59 cm -1reflecting C-N group on amide (-NHCOCH3-) supported by absorption in the area of about 3,200 cm-1that represents the presence of N-H group on amide and the presence of peak at the wavelength of 1610-1680 cm -1 as stretching vibration area of C=0 on amide part. C-H and C-C groups are shown by peak appearance at 1,373.32 cm-1 (treatment M2 and M3) and 1,379.1 cm-1 (treatment M1).
The functional group spectra of nano-chitin compound from pressured hydrolysis and destruction are still similar to the IR spectra of standard chitin tested by Tamimi and Herdyastuti (2013)22 in which the standard chitin has the absorption in the area of 3,446.26 cm-1 indicating intermolecular –OH group. The area of 3,200 cm-1indicated –NH group on amide (NHCOCH3), 1,316.61 cm-1 indicated C-N group (NHCOCH3), while the area of 1,651 cm-1 represented tug variation of C=O group (NHCOCH3, amide), and C-H and C-C groups appeared through the peak at 1,379 cm-1.
The functional group of the nano-chitin read on the FTIR is also supported by Dompeipen (2017)23 where the functional group of standard chitin contains 10 main peaks, 690.99 cm-1, 752.33 cm-1, 896.28 cm-1, 1,026.33 cm-1, 1,073.93 cm-1, 1,418.74 cm-1, 1,661.50 cm-1, 2,886.81 cm-1, 2,961.32 cm-1, 3,268.63 cm-1, and 3,436.35 cm-1. According to Silverstein et al., (1989)24, one of the absorptions for chitin compound characteristic is the presence of weak stretching absorption at 1,650 cm-1 that reflects the presence of C=O group on -NHCOCH3 bond and the presence of stretching absorption at 1,310 cm-1 indicating the presence of C-N on amide (-NHCOCH3) bond. In addition, one of the chitin compound indication is the occurrence of tug vibration at the wavelength of 834.54 cm-1 reflecting β-1.4-glycosidic bond.
The functional group analysis of N-acetyl glucosamine from chitin hydrolysis using HCl (Mukti & Herdyastuti, 2016)25 indicates the presence of functional group of O-H, N-H, C-H, C=O, C-N, and C-O at the wavelength of 3,000-3,500, 2,880, 1,635.50, 1,387.80, and 1,082 cm-1. Ernawati (2012)10 demonstrates the absorption tape of C-N GlcN HCl group from hydrolysis at the wavelength of 1,381 cm-1, while the standard has 1,288cm -1. This absorption tape area is also similar to that in the IR spectra of nano-chitin of the present study.
Acknowledgment
I would like to thank the Rectors of Gorontalo State University and University of Sam Ratulangi Manado for allowing me to join the doctoral program while continuing to carry out my duties as lecturer on campus. Additionally, authors would like to state that all data in this article is original and as part of main author doctoral research, and do not be published in other journals. This doctoral research was self funding.
Conclusion
Mean particle size of nano-chitin mostly distributed (90%) occurred in M1, M2, and M3 was 229.7 nm, 399.1 nm, and 320.3 nm, respectively, while the lowest size distribution (10%) recorded was 144 nm, 242.2 nm, and 209.3 nm, respectively. All test samples had maximum PI value of 0.366 indicating narrower size distribution pattern and reflecting more uniform particle size. The functional group of the compound showed absorption pattern at nearly same wavelength as that in IR spectra of standard chitin and N-acetyl glucosamine derived from chitin hydrolysis, but the use of HCl solution volume up to 12 times chitin weight during the hydrolysis reduced the percent transmittance. Nevertheless, application of excessive acid solution (1:14) increased the percent transmittance of the functional groups indicating that IR frequency absorbed by the compound got fewer. The solubility rate of the particles ranged from 68.92% to 71.72% which showed an increasing by decreasing the volume of HCl used in hydrolyzing chitin. This high level of solubility of nano-chitin has a high potential to be applied in various industries, especially the food industry.
Reference
- Synowiecki, J., & Al-Khateeb, N. (2003). Production, properties, and some new applications of chitin and its derivatives. Crit Rev Food Sci, 43 (1), 45-71.
- Horton, R., Moran, L., Ochs, R., Rawn, J., & Scrimgeour, K. (2002). Principles of biochemistry. Third edition. New York: Prentice-Hall, Inc
- Junianto. (2008). Peningkatan skala produksi kitin dari kulit udang secara biologis. Disertasi, Institut Pertanian Bogor, Bogor.
- Kaya, M., Tozak, K., Baran, T., Sezen, G., & Sargin, I. (2013). Natural porous and nano fiber chitin structure from Gammarus argaeus. EXCLI Journal, 12, 503-510.
- Austin, P., & Brine, C. (1976). Patent No. 4029727. US.
- Rochima, E. (2007). Karakterisasi kitin dan kitosan asal limbah rajungan Cirebon Jawa Barat. Buletin Teknologi Hasil Perikanan, X (1), 9-22.
- Pillai, C., & Sharma, C. P. (2009). Electrospinning of chitin and chitosan nanofibres. Trends Biomater Artif. Organs., 22 (3), 179-201.
- Revol, J., & Marchessault, R. (1993). In vitro chiral nematic ordering of chitin crystallites. Int J Bio Macromol, 15, 329-335.
- Kumar, P. G., & Bhat, S. K. (2018). Preparation chitin nano whiskers from mushroom. Int J of Sci and Research Publications, 8 (8), 130-137.
- Ernawati. (2012). Pembuatan glukosamin hidroklorida dengan metode autoklaf. Tesis, IPB, Bogor.
- Dachriyanus. (2004). Analisis Struktur Senyawa Organik Secara Spektroskopi. Padang, Sumatera Barat: LPTIK Universitas Andalas.
- Sunariyo. (2008). Karakteristik Komposit Termoplastik Polipropilena dengan Serat Sabut Kelapa sebagai Pengganti Bahan Pelet Kayu. Tesis Magister, Universitas Sumatera Utara, Medan.
- Broers, L., van Dongen, S., de Goederen, V., Ton, M., Spaen, J., Boeriu, C., et al. (2018). Addition of chitin nanoparticles improves polylactic acid film properties. Nanotechnology and Advanced Material Science, I (2), 1-8.
- Gontard, N., Guibert, S., & Cuq, J.-L. (1992). Edible wheat gluten films: influence of main process variables on film properties using response surface methodology. Journal of Food Science, 57 (1), 190-195
- Babaei, Z., Jahanshahi, & Sanati, M. (2008). Fabrication and evaluation of gelatin nanoparticles for delivering of anti-cancer drug. IntJNanosci Nanotech, 4 (1), 23-30.
- Jenial, S., Fadli, A., & Aziz, Y. (2018). Studi kinetika reaksi pada proses deasetilasi kitin dari limbah industri ebi. JOM FTEKNIK, 5 (1), 1-7.
- Alias, S., Ismail, A., & Muhammad, A. (2010). Effect of pH on ZnO nanoparticle properties synthesized by sol-gel centrifugation. J Alloy Compd, 499, 231-237.
- Hubbe, M. A., Ferrer, A., Tyagi, P., Yin, Y., Salas, C., Pal, L., et al. (2017). Nanocellulose in thin films,coatings, and plies for packaging applications: A review. Biological Research , 12 (1), 2143-2233
- Rathke, T., & Hudson, S. (1994). Review of chitin and chitosan as fiber and film formers. Journal of Macromolecular Science , C34 (3), 375-437
- Gong, Y., Grant, D., & Brittain, H. (2007). Principles of Solubility. In P. Augustijns, & M. E. Brewster, Solvent Systems and Their Selection in Pharmaceutics and Biopharmaceutics (pp. 1-27). New York, USA: American Association of Pharmacetical Science Press
- Sinala, S. (2016). Farmasi Fisik. Jakarta: Pusdik SDM Kesehatan
- Tamimi, M., & Herdyastuti, N. (2013). Analisis gugus fungsi dengan menggunakan spektroskopi FTIR dari variasi kitin sebagai substrat kitinase bakteri Pseudomonas sp TNH-54. UNESA Journal of Chemistry, 2 (2), 47-51.
- Dompeipen, E. J. (2017, Agustus 11). Isolasi dan identifikasi kitin dan kitosan dari kulit udang windu (Paneaus monodon) dengan spektroskopi inframerah. Majalah BIAM , pp. 31-41.
- Silverstein, R., Francis, X., & David, J. (1989). Spectrometric Identification of Organic Compound. Seventh edition. New York: John Wiley & Sons.
- Mukti, M. I., & Herdyastuti, N. (2016). Karakterisasi N-asetilglukosamin hasil hidrolisis kitin secara kimiawi. Prosiding Seminar Nasional Kimia dan Pembelajarannya, (pp. C-61 – C-64). Surabaya.
Accepted on: 17/03/2020
Second Review by: Dr. Preeti P. Thakur India
Final Approval by: Prof. Jiwan S. Sidhu


Web of Science Coverage
Emerging Sources Citation Index (ESCI)
2024 Journal Impact Factor: 1.1
Scopus Journal Metrics
CiteScore 2025: 2.6
CiteScore Details
Sustainable Nutrition: Food Systems, Nutrient Retention, and Public Health Impact
![]()
This journal is a member of, and subscribes to the principles of, the Committee on Publication Ethics (COPE)


