Quality Analysis of Soy Bread and Its Effects on Glycemic Index
Mohammad Mozibul Haque1
, A. F. M Irfan Uddin Zim1, Md. Abdul Aziz1, 1Department of Applied Food Science and Nutrition, Faculty of Food Science and Technology, Chittagong Veterinary and Animal Sciences University, Khulshi, Chittagong, Bangladesh.
2Department of Medicine & Surgery, Faculty of Veterinary Medicine, Chittagong Veterinary and Animal Sciences University, Khulshi, Chittagong, Bangladesh.
Corresponding Author Email: altaf@cvasu.ac.bd
DOI : http://dx.doi.org/10.12944/CRNFSJ.8.1.07
Download this article as:
![]()
Low glycemic index foods have been associated with several health benefits. Similarly, soy-based food products have an increasing demand in the market due to its high nutritional value. The study was conducted to produce high-quality protein-enriched bread with low glycemic index (GI) value. The fortification of bread was done with soy flour in our study. The proximate analysis, sensory evaluation and the GI value of the bread sample were determined.The crude protein, crude fiber, fat and ash content of the bread progressively increased with the addition of soy flour where 20% soy bread having the highest values as 14.5%, 0.7%, 5% and 2.1%, respectively and control bread having lowest values as 9.2%, 0.2%, 1.8%, and 1.7%, respectively. The sensory evaluation of bread showed no significant differences in crust, shape, internal texture, appearance and general acceptance where the aroma and the taste of bread samples were significantly different from the control bread. Taste of bread had a low score of 5.81 at 20% soy substitution bread and highly differed with control bread (p<0.01). The GI values were significantly lowered by 15% (p<0.05) and 20% (p<0.01) soy sample bread. The average GI value of Control, 10%, 15% and 20% soy substitution bread were 60.4, 49.98, 44.37 and 39.19 respectively. Glycemic Index decreased from 18% to 35% with the incorporation of soy flour (10% to 20%) in the bread sample. The soy flour treated breads were found nutritionally superior compared to soy untreated food.
KEYWORDS:Proximate Analysis; Sensory Evaluation; Glycemic Index Value; Soy; Bread
Introduction
Bangladesh as the most densely populated countries, food habit of the people of this country is mainly cereal-based due to the geographical and climatic condition of the land. The most dominated food consumed by people is cereal rice which is followed by wheat. Rice and wheat account for 62% and 54% of total intake of all foods per capita per day for rural and urban people, respectively.1 Cereal and cereal-based products or snacks have become very popular in Bangladesh day by day. Industries are rising for cereal processing and marketing. Bread is one of the oldest and traditional products in the bakery industry. It is an important staple food which consumption is steady and increasing sharply. Normal Bread has a high Glycemic Index (GI) value according to the international table of GI and Glycemic Load value (GL).2 So, the enrichment of cereal-based food products with other protein-based grain has great attention in research field.3
Soybean (Glycine max) is a new prospective oil crop in Bangladesh which is regarded as an ideal food for the people of Bangladesh as it contains high quantity of protein (40-50%), superior quantity of edible oil and a rich amount of calcium, iron, phosphorus and most of the vitamins.4 Soy protein is highly digestible (92-100%). Increased acceptance of soy protein is due to unmatched protein qualities like good functional properties in food applications, high nutritional quality, abundance, availability, and low cost. Soybeans have one of the lowest GI values of all the legumes (GI =14-20)2 likely because of their higher protein and fat content. Since glycemic index defined as the percentage of the incremental area under the blood glucose response curve in two hours by consuming 50g of available carbohydrate portion of a food and incremental area under blood glucose response curve in two hours by consuming 50g of reference food, typically used glucose.5 Low glycemic food ( GI: <50) has protective role against the development of type 2 diabetes mellitus and coronary artery disease.6, 7 As a result, many soy-based foods fit nicely into a low glycemic diet which is much more suitable for heath cautious people and in diabetic patients.
For a balanced diet, modification of bread has been needed to improve its nutritional content. Replacement of bread carbohydrates with protein is concerned in recent studies and fortification was done by several fiber-rich protein grains in several studies.8,9 Bread is fortified with soy ingredients in several studies due to its empirical health benefit and its lower cost availability.10, 11 Epidemiological and experimental evidence suggests that consumption of soybean products may have a significant impact upon health.12, 13 As soy bean is a low GI food, so the addition of soy in bread can be lowering the GI of bread.
Keeping the above consideration, an experiment was undertaken to use soy bean flour in bread preparation at various proportions to evaluate their nutritional quality and glycemic index. Moreover, organoleptic/sensory properties of bread treated with- and without soy flour were also assessed.
Materials and Methods
Sources of Ingredients of Bread
In order to prepare experimental bread soybean and wheat flour were purchased from Wireless Jawtola market of Chittagong city, whereas “Saf-instant” instant dry yeast, sun flower oil, dano skim milk powder, fresh refined sugar and confidence vacuum refined salt were individually purchased from Khulshi Mart Super Market of Chittagong city in Bangladesh.
Processing of Soy Beans into Powder Form
The soybean seeds were processed into powder form (flour) using the method of the International Institute of Tropical Agriculture.14 The process ensured the removal of most anti-nutritional factors such as the protease inhibitors, lectins etc.15 Briefly, soybean was cleaned properly to remove visible dirt or debris and then roasted until developing light brown. The roasted soybean was then boiled for 20 minutes and decorticated the seed and drained out the water. Afterward, soaked soybean was dried at 106ºC for 4 hours before grinding and sieving to have powdered soybean flour.
Blend Formation and Baking
Four bread samples were prepared of which one sample was considered as control and others were considered as soy flour treated samples. The ratio of whole wheat flour and soy flour in different samples was as follows: 100:0 (control sample), 90:10, 85:15 and 80:20 (treated samples).
The four blend formulations were baked using the straight dough method.16 The same baking formula was followed for all bread samples17: 56% whole wheat flour or the blend of whole wheat flour treated with soy flour, 36% water, 3.4% sugar, 1.6% vegetable oil, 1% skim milk powder, 1% salt, and 1% yeast. All ingredients were then mixed by hand for 20 minutes to get an appropriate well-mixed dough. The dough was then fermented in a bowl covered with sterile and wet clean muslin cloth for 1 hour at 29°C. The fermented dough was raised twice to its initial volume by air tapping during this period. Then the raised dough was punched to remove air and scaled to 350g dough pieces. This weighed dough was molded to its final shape in bread making deice and proofed in a manually prepared proofing cabinet for an hour at 30°C with maintaining 85% relative humidity. Final proofed dough was baked at 220°C for 30 minutes.
Proximate Analysis
The proximate analysis of the control and treated bread samples were performed using the AOAC method.18 The proximate analysis determines the level of moisture, ash, crude fiber, crude protein, crude fat, and carbohydrate contents.
Sensory Evaluation
Sensory evaluation was conducted on the freshly baked bread samples (control and treated) by 21 untrained panelists of the fourth year and the first-year students (15 male and 6 female; 19-24 years of age) of the Faculty of Food Science and Technology, Chittagong Veterinary and Animal Sciences University, Khulshi, Chittagong. The sensory evaluation attributes were crust, aroma, shape, internal texture, taste, appearance and general acceptability. Each sensory attribute of the bread samples was assessed by the panelists according to a 9-point Hedonic scale (1=dislike extremely; 2=dislike very much; 3=dislike moderately; 4=dislike slightly; 5=neither like nor dislike; 6=like slightly; 7=like moderately; 8=like very much and 9=like extremely).19
Study of Assessing Glycemic Index
The study was conducted using an internationally recognized method of assessing GI.20
Study Subjects
Ten healthy and non-smoking fourth-year students of Faculty of Food Science and Technology, CVASU were randomly recruited. Exclusion criteria were being overweight, dieting, impaired glucose tolerance, illness or food allergy or on regular medication. Verbal and written consent was taken from each participant.
Experimental Procedure
Glucose (Galaxose D powder, Galaxo Smithkline Company, BD) as a reference and four test bread samples (one control and three soy flour treated) at the rate of 25g of available carbohydrate plus other ingredients in each bread sample were served to the participants. Mass and nutrient contents of the reference and bread samples are given in Table 1. The reference glucose was prepared by dissolving the glucose in 250ml of plain water. Bread samples (control and treated) as per the required number of species were prepared the day before the experiment started. The prepared bread samples were stored overnight in the bread box covered with lid ensuring normal circulation of air to maintain its best quality. The individual portions of the bread were weighed on the day of the experiment and served with 250 ml of plain water to the study participants. The participants consumed their allocated bread and water at a comfortable pace within 10 minutes. The experimental methods20 used in the study are briefly outlined here.
Table 1: Mass and nutrient contents of the test portion of the glucose reference and the four sample breads
| Sample types | Description of items | Portion size (g) | Protein (g) | Fat (g) | Available carbohydrate (g) | Fiber (g) |
| Reference | Glucose | 25 | 0 | 0 | 25 | 0 |
| Control | Whole wheat (WW) bread (100:0) plus other ingredients (A) | 46.7 | 4.3 | 0.8 | 25 | 0.08 |
| Test bread samples | 10% Soy bread in WW (90:10) plus other ingredients (B) | 52.5 | 6.5 | 1.9 | 25 | 0.2 |
| 15% Soy bread in WW (85:15) plus other ingredients (C) | 54.5 | 7.2 | 2.4 | 25 | 0.3 | |
| 20% Soy bread in WW (80:20) plus other ingredients (D) | 57.8 | 8.4 | 2.9 | 25 | 0.4 |
The experiment with samples (glucose and bread samples) was conducted between Day 0 and Day 12 for a total of 6 sessions allowing one day wash out time for the participants. The study participants had light food items such as daily normal diet before the start of fasting. For each experimental session, all participants had overnight fasting (10-12 hours) followed by finger-prick blood taking at 8-9 am and consumption of the samples as per schedule. Fingertip capillary blood appears to give the greatest sensitivity to blood glucose response.20 Glucose consumption was only done for the first and last experimental sessions. During each experimental session, six additional finger-prick blood samples were collected from each participant at 15 up to 60 minutes then 30 minutes interval followed up to 120 minutes. Glucose concentrations were measured immediately from the blood samples (Details given below).
Blood Glucose and Glycemic Index Determination
Glucose concentration in the blood sample was measured in mmol per ml by Gluco Dr. (Korea, model no AGM 2100) blood glucose test Meter. A two-hour blood glucose response curve (0-120 minutes at 15 minutes interval) was constructed against blood glucose concentration and the incremental area under the glucose response curve (IAUC) was also calculated.
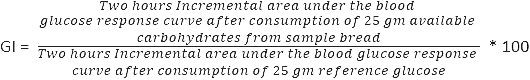
The Glycemic Index value for each sample was calculated for individual participants by dividing the IAUC value for the samples by their average two-hour blood glucose IAUC value for the reference glucose and multiplying by 100 to obtain a percentage score. The final reported GI value for each sample was the mean GI value for that sample in the group of 10 participants.
Statistical Evaluation
Proximate, sensory and glucose incremental area data were collected in Microsoft Excel 2007 spreadsheet. Afterward, data were exported to SPSS 17 (SPSS Inc., 233 South Wacker Drive, 11th Floor, Chicago, IL 60606-6412). Data were sorted, coded and recorded before statistical analysis in SPSS 17 software. Proximate and sensory data were analyzed by one way ANOVA test to assess the significance level of variation at a 95% confidence interval (CI). Post hoc (Tukey) test was done to identify the variation between the sample groups. Glycemic index calculated in Microsoft excel and further one way ANOVA and post hoc test were done at 95% confidence interval to denote significant variation within the different sample groups. Descriptive statistics (frequency, percentage, means, standard deviation, and standard error mean) were performed for different bread samples.
Results
Nutritional composition of whole wheat bread and Soy flour treated bread
The results of proximate analysis on the whole wheat flour bread and soy flour treated bread samples are presented in Table 2. The proximate analysis evidenced that soy flour treated bread contained a significantly better level of protein, carbohydrate, fat, ash and fiber than that of whole wheat flour bread (p=0.001). According to the hypotheses, the protein level in the formulated bread increased and the carbohydrate level decreased significantly when the amount of soy flour added into the bread.
Table 2: Proximate composition of wheat flour and soy flour treated bread samples
| Parameter / Bread sample | A (N=3) | B (N=3) | C (N=3) | D (N=3) | P (1-ANOVA) | P (Post-hoc test) |
| Crude protein (%) | 9.2± 0.02a | 12.4± 0.02b | 13.1± 0.01c | 14.5± 0.03d | <0.001 | All sample <0.001 |
| Crude fiber (%) | 0.2 ± 0.02a | 0.5± 0.02b | 0.5± 0.02c | 0.7± 0.02d | <0.001 | All sample<0.001 |
| Crude fat (%) | 1.8 ± 0.02a | 3.7± 0.01b | 4.3± 0.04c | 5.1± 0.06d | <0.001 | All sample <0.001 |
| Ash (%) | 1.7 ± 0.1 ab | 1.9± 0.02 abc | 2± 0.01 bcd | 2.1± 0.1 cd | <0.001 | A vs BB vs CC vs D<0.001 |
| Moisture (%) | 33.7 ± 0.1 a | 34± 0.1 abc | 34.2± 0.2 bcd | 34.4± 0.01 cd | <0.001 | All sample <0.001 |
| Total Carbohydrate (%) | 53.5 ± 0.1 a | 47.6± 0.05 b | 45.9 ± 0.22 c | 43.3± 0.1 d | <0.001 | All sample <0.001 |
Note: Data are average value ± standard deviation. Values in the same row with different superscripts are statistically significant (p<0.01).
A – Bread produced from 100% wheat flour
B – Bread produced from composite flours of 90% wheat and 10% soy bean
C – Bread produced from composite flours of 85% wheat and 15% soy bean
D – Bread produced from composite flours of 80% wheat and 20% soybean
Sensory evaluation
The mean score of taste was significantly varied among bread classes and the post-hoc test suggested the mean score was significantly lower in all bread classes as compared with bread class A (p<0.05) (Table 3). The mean score of crust, shape, internal texture, appearance, and general acceptability was not statistically different in all bread classes as compared to control bread. The mean score of aroma significantly differed among bread classes and the post-test showed that the mean score of sample D was significantly lower as compared with bread class A.
Table 3: Hedonic sensory score of the whole wheat and soy flour treated bread samples
| Attributes/Bread Sample | A (N=21) | B (N=21) | C (N=21) | D (N=21) | p (1-ANOVA) | P (post-hoc test) |
| Crust | 7.6±1.2 | 7.3±1.3 | 7.1±1.7 | 7.1±1.3 | 0.61 | N/A |
| Aroma | 7.4±1.1 ad | 6.8±1.1 | 6.7±1.2 | 6.2±1.1 ad | 0.01 | A vs D <0.01 |
| Shape | 7.4±1.3 | 7.9±1 | 7.7±1.3 | 7.6±1.3 | 0.58 | N/A |
| Internal Texture | 7.1±1.5 | 7.2±1.4 | 7.2±1 | 7.1±1.4 | 0.99 | N/A |
| Taste | 7.1±1.5 ad | 6.8±1.2 | 7±1.1 cd | 5.8±1.7 acd | 0.01 | A,C vs D<0.01 |
| Appearance | 7.5±1.1 | 7.6±1.1 | 7.5±1 | 7.3±1 | 0.72 | N/A |
| General Acceptance | 7.3±1.4 | 7.3±1 | 7±1.3 | 6.7±1.4 | 0.34 | N/A |
Note: Data are average value ± standard deviation. Values in the same row with same superscripts are statistically significant (p<0.05)
A – Bread produced from 100% wheat flour
B – Bread produced from composite flours of 90% wheat and 10% soy bean
C – Bread produced from composite flours of 85% wheat and 15% soy bean
D – Bread produced from composite flours of 80% wheat and 20% soybean
Glycemic iIndex
The mean blood glucose response curves for the glucose and bread samples are shown in Figure 1. The response curves in 10% and 15% soy flour treated bread samples raised steadily up to 45 minutes and then fell down slowly below the control bread sample response curve. The response curve in 20% soy flour treated bread sample raised steadily during the first 30 minutes and ran below the curves produced by other samples. The mean GI values significantly varied by sample types (p<0.01) (Figure 2). The mean GI value was lower in any of samples B to D (soy flour treated bread) than in sample A (no soy flour, control) (p<0.05). In pair-wise comparison, the mean GI value was significantly lower in sample C and sample D than in sample B (p<0.05). The mean GI value in sample D was lower than in sample C (p<0.05) (Figure 2).
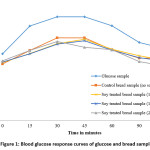 |
Figure 1: Blood glucose response curves of glucose and bread samples Click here to View figure |
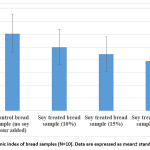 |
Figure 2: Glycemic index of bread samples (N=10). Data are expressed as mean± standard deviation. Click here to View figure |
Discussion
The proximate analysis revealed that the content of crude protein, crude fiber, crude fat, ash, and moisture significantly increased, whereas the content of carbohydrate significantly decreased in soy flour added bread in the present study. Higher level of protein in the treated bread is due to the adding soy which contains more protein than wheat flour in the same weigh.21 The proximate outcomes of the present study are in-line with the results of many earlier studies.4,22,23 Therefore, the findings in current and earlier studies suggest that soy flour treated bread has been qualified as an improved diet in all aspects of nutrients compared with soy flour untreated bread. As soy treated bread providing consumers with added protein it has the potential to improve the protein-energy malnutrition problem which is a common scenario in Bangladesh.23
Sensory evaluation of sample breads determined that aroma and taste of the breads were statistically different with 20% soy treated bread sample (P<0.05) which indicates that the addition of Soy flour may negatively affect bread aroma and taste. People in Bangladesh generally accustomed to wheat bread. That may be the reason panelists did not like the aroma and taste in the soy treated bread. No statistical difference was evidenced for Crust, shape, internal texture, appearance and general acceptance of the breads were statistically similar between soy treated and untreated breads in the present study. Several studies found similar findings.17, 24,25
Overall the GI values gradually decreased in soy treated breads and comparing soy untreated bread the reduction rate was much significant in 20% soy treated bread (60 to 39%) followed by 15% soy treated bread (60-42%) and 10% soy treated bread (60-50%). It indicates that the increase of amount of soy flour with wheat flour cause to lowering the glycemic index value of the food. Carbohydrates present in soy are slowly digested and absorbed, thus produce slow and small rises in blood sugar and helps in lowering the glycemic index. 26,27 Since high amount of soy added causes to decrease the consumer acceptance, so addition must be at level where maximum consumer accepts the product while also ensuring the health benefit for the human body.28 In our experiments, 15% incorporation of soy has high acceptance with significantly lower the GI value (p<0.05). The current study measured glucose concentration by applying one method. However, more than one method of measuring glucose concentration in blood might have increased the validity of glucose estimation. Also, the sample size in this study was small (Brouns et al., 2005) to measure GI value.
Conclusion
The soy flour treated breads (in particular 20% soy flour added bread) were nutritionally superior to that of the soy untreated bread (bread made form 100%’ flour’). The 20% soy treated bread contained a higher amount of protein, fat, fiber and ash content. The 15% soy flour treated bread had higher nutritional and organoleptic qualities. The 10% soy flour treated bread had the highest mean scores of overall acceptance. In general, the soy flour treated breads produced lower GI values on consumption which suggests the better nutritional quality of the food. So, the soy flour which costs lower than wheat flour has economic implications in manufacturing of baked goods which would reduce the importation of wheat flour. The soy flour made bread could meet up better protein requirements along with fat and calories for the poor section of people in Bangladesh which could prevent from occurring protein deficiencies of the people. The low GI of soy treated bread appears to be an additional benefit for human health and suggests that soy foods are an appropriate part of diet plans intended to improve control over the blood glucose level.
Acknowledgement
The authors would like to express their gratitude and cordial thanks to the Ministry of Science and Technology, Bangladesh and Advanced Studies & Research, CVASU, for providing funds for this research work.
Funding
The author(s) received financial support from Ministry of Science and Technology, Bangladesh and Advanced Studies & Research, CVASU, for the research, authorship, and/or publication of this article.
Conflict of Interest
The authors do not have any conflict of interest.
References
- Humaywn M. K. A study on consumption pattern of some selected commodities in sadarthana of Mymensingh district. Mymensingh, Bangladesh: Bangladesh Agricultural University; 1995. MSc thesis.
- Foster-Powell K., Holt S. H. A., Brand-Miller J. C. International table of glycemic index and glycemic load values. Am J Clin Nut. 2002; 76(1): 5-56.
- Ayo J. A., Olawale O. Effect of defatted groundnut concentrate on the physicochemical and sensory quality of “fura”. Nutr & Food Sci. 2003; 33(4):175-183.
- Kure O. A., Bahago E. J., Daniel E. A. Studies on proximate composition and effect of flour particle size of acceptability of biscuits produced from blends of soyabeans and plantain flours. Namida Tech-Scope J. 1998; 3:17-21.
- Wolever T. M. S., Jenkins D. J. A., Jenkins A. L., Josse R. G. The glycemic index: methodology and clinical implications. Am J Clin Nut. 1991; 54(5): 846-854.
- Jenkins D. J., Kendall C. W., Augustin L. S., Franceschi S., Hamidi M., Marchie A., Jenkins A. L., Axelsen M. Glycemic index: overview of implications in health and disease. Am J Clin Nut. 2002; 76(1): 266S-273S.
- Liu S., Willett W. C., Stampfer M. J., Hu F. B., Franz M., Sampson L., Hennekens C. H., Manson J. E. A prospective study of dietary glycemic load, carbohydrate intake, and risk of coronary heart disease in US women. Am J Clin Nut. 2000; 71(6): 1455–1461.
- Dalgetty D. D., Baik B. K. Fortification of bread with hulls and cotyledon fibers isolated from peas, lentils, and chickpeas. Cereal Chem. 2006; 83(3): 269-274.
- Rupa A. Z., Hussain I., Goni O. Production of potato breads. Bang J Sci Industr Res. 2013; 48(3): 201-204.
- Yanez E., Ballester D., Aguayo M., Wulf H. Enrichment of bread with soy flour. Arch Latinoam Nutr. 1982; 32(2):417-428.
- Mashayekh M., Mahmoodi M. R., Entezari M. H. Effect of fortification of defatted soy flour on sensory and rheological properties of wheat bread. Int JFood Sci Tech. 2008; 43(9): 1693-1698.
- Messina M. J., Persky V., Setchell K. D. R, Barnes S. Soy intake and cancer risk: a review of the in vitro and in vivo data. Nutr Cancer. 1994; 21(2): 113–131
- Hasler C. M. The cardiovascular effects of soy products. J Cardiovasc Nurs. 2002; 16(4): 50-63.
- International Institute of Tropical Agriculture (IITA). Soybeans for good health: How to grow and use soybeans in Nigeria. IITA publication; 1990.
- Liener I. E. Implications of ant nutritional components in soybean foods. Crit Rev Food Sci Nutr. 1994; 34(1): 31-67.
- Edwards W. P. The Science of Bakery Products, 1st edn, 2007;The Royal Society of Chemistry, London.
- Olaoye O. A., Onilude A. A., Idowu O. A. Quality characteristics of bread produced from composite flours of wheat, plantain and soybeans. Afr J Biotechnol. 2006; 5(11): 1102-1106.
- AOAC International. Official methods of analysis, 20th edn, 2016; AOAC International, Washington DC.
- Ranganna, S. Handbook of Analysis and Quality Control for Fruit and Vegetable Products. 2nd edn, 1991; Tata McGraw-Hill Publishing Company Limited, New Delhi.
- Brouns F., Bjorck I., Frayn K. N., Gibbs A. L., Lang V., Slama G., Wolever T. M. S. Glycaemic index methodology. Nutr Res Rev. 2005; 18(1): 145-171.
- Basman A., Koksel H., Ng P. K. W. Utilization of transglutaminase to increase the level of barley and soy flour incorporation in wheat flour breads. J Food Sci. 2003; 68(8): 2453-2460.
- Edema M. O., Sanni L. O., Sanni A. I. Evaluation of maize-soybean flour blends for sour maize bread production in Nigeria. Afr J Biotechnol. 2005; 4(9): 911-918.
- Akubor P. I., Ukwuru M. U. Functional properties and biscuit making potential of soybean and cassava flour blends. Plant Food Hum Nutr. 2005; 58(3):1-12.
- Goesaert H., Brijs K., Veraverbeke W. S., Courtin C. M., Gebruers K., Delcour, J. A. Wheat flour constituents: how they impact bread quality, and how to impact their functionality. Trends Food Sci Technol. 2005; 16(1): 12-30.
- Feili R., Abdullah W. N. W., Yang T. A. Physical and sensory analysis of high fiber bread incorporated with jackfruit rind flour. Food Sci Technol. 2013; 1(2): 30-36.
- Blair R. M., Henley E. C., Tabor A. Soy foods have low glycemic and insulin response indices in normal weight subjects. Nutr j. 2006; 5(1): 35.
- Villegas R., Gao Y. T., Yang G., Li H. L., Elasy T. A., Zheng W., Shu X. O. Legume and soy food intake and the incidence of type 2 diabetes in the Shanghai Women’s Health Study. Am J Clin Nut. 2008; 87(1): 162-167.
- Banureka V. D., Mahendran T. Formulation of wheat-soybean biscuits and their quality characteristics. Trop Agric Res Extn. 2011; 12(2).
Accepted on: 30/03/2020
Second Review by: Dr. Setyaningrum Rahmawaty Indonesia
Final Approval by: Prof. Ana Laura de la Garza


Web of Science Coverage
Emerging Sources Citation Index (ESCI)
2024 Journal Impact Factor: 1.1
Scopus Journal Metrics
CiteScore 2025: 2.6
CiteScore Details
Sustainable Nutrition: Food Systems, Nutrient Retention, and Public Health Impact
![]()
This journal is a member of, and subscribes to the principles of, the Committee on Publication Ethics (COPE)


