Effect of Pre-treatment in Producing Pumpkin Powder Using Air Fryer and Its Application in ‘Bingka’ Baking
Department of Food and Process Engineering, Faculty of Engineering, Universiti Putra Malaysia, Serdang, 43400 UPM, Malaysia
Corresponding Author Email: farahsaleena@upm.edu.my
DOI : http://dx.doi.org/10.12944/CRNFSJ.8.1.05
Download this article as:
![]()
Pumpkin powder is one of the main pumpkin products with longer shelf life and it can act as a substitute for pumpkin flesh in different types of formulated foods. This work focused on producing pumpkin powder from different pumpkin parts and evaluating the effects of powder substitution on the physical properties of cake (bingka). Different parts of pumpkin (peeled, unpeeled, and skin) were pre-treated by soaking in limewater solution and then dried in an air fryer at the temperature of 80 °C, 120 min and air flow of 5.11 m/s. The fresh pumpkin (peeled and unpeeled-pumpkin) and pumpkin powder (peeled and unpeeled-pumpkin) were both used in the production of ‘bingka’ and the baking parameters were optimised. The selected temperatures for baking ‘bingka’ were in the range of 130–150 °C and the baking time was between 25 and 35 min. Baking temperature and time had a significant effect (p < 0.05) on moisture content and hardness, but are insignificant towards chewiness. The ‘bingka’ baked using peeled pumpkin at optimum baking temperature (130 °C) and time (25 min) had higher moisture content (45.92%) as compared to those baked using unpeeled pumpkin 43.47%, peeled pumpkin powder (44.23%) and unpeeled pumpkin powder (43.47%). It can be concluded that pumpkin powders can be used as a substitute for raw material by considering the moisture content, hardness and chewiness of the products.
KEYWORDS:Pumpkin; Pre-Treatment; Pumpkin Powder; Air Fryer; Optimisation; Baking
Introduction
Pumpkin (Cucurbita maxima) is one of the vegetables that is high in nutrition and can be used as food, as well as in medicines. Pumpkins are soft and sweet. They are used in a variety of food products such as cakes (Anju, 2013), breads (Pongjanta et. al., 2006), cookies (Kulkarni & Joshi, 2013), Asian noodles (Lee et al., 2002), rice breads (Dabash et. al., 2017), jellies (Yoshimura et. al., 1994), sauces (Sosa et. al., 2013), and marmalades (Egbekun et. al., 1998). Different parts of pumpkins have different nutrient contents. Pumpkin skin is a good source of pectin but it is discarded as agricultural waste during processing. There is insufficient information and research available on pumpkin skin.
Pumpkins are very sensitive; even if they are stored in a refrigerator, they are prone to microbial spoilage (Anju, 2013). In fact, they deteriorate a few weeks after harvesting due to their high moisture content, which is about 92% (Tunde-Akintunde & Ogunlakin, 2011). Thus, it is difficult to retain the nutrients, taste, and colour of pumpkins.
Soaking in the calcium solution might give better quality to the final product, such as prevention in microbiological growth, improvement in texture, and maintain in color, (Alandes et al., 2009). However, certain solution may have adverse effect on the product, due to presence of SO2 causes allergenic effect to some consumers (Aydin and Gocmen, 2015).Calcium hydroxide is commonly used for food production. Therefore, it may be used as an alternative to preserve the food quality in order to maintain the color and extend the shelf life. These characteristics are beneficial to develop food products rich in calcium, such as high calcium milk, high calcium bread, flour, and others (Lee et al., 2002).
Drying is the perfect method for their preservation and this is achieved by hot air drying (Aydin & Gocmen, 2015), air frying (Murzaini et. al., 2016), and freeze-drying (Que et. al., 2008). Currently, pumpkin flour is the main processed product of pumpkins, which can be easily stored for a long time and is used in the manufacturing of formulated foods (Aydin & Gocmen, 2015).
‘Bingka’ is a traditional dessert that is popular in the Malay society. Conventionally, ‘bingka’ is made from coconut milk, eggs, sugar, and butter. In the production of ‘bingka’, sugar is the most important ingredient because it affects starch gelatinisation, texture, sweetness, and colour of the product (Gan et al., 2007). The sensory characteristics of baked ‘bingka’ are creamy, sweet, and full of pumpkin flavour.
Air frying is a new baking technique that involves rapid air circulation. An air fryer is designed to dry and bake. Hot air is rapidly circulated in order to maintain a uniform temperature. The cooking chamber of an air fryer receives heat from the heating element close to the sample, hence the duration of cooking is shortened (Rahman et.al., 2016). The presence of air flow modulates the temperature by distributing the hot air inside the chamber; this enhances the baking process and reduces baking time. A lower baking temperature in the presence of air flow is more efficient in terms of working time (Sani et. al., 2014).
Response surface methodology (RSM) is a collection of mathematical and statistical techniques that utilise quantitative data from experimental designs for solving multivariate problems, in which several independent variables influence a dependent response (Jang et. al., 2011). This method is an effective tool in the development of experiments and has officially been used to optimise several food processing operations (Rahman et al., 2016). Many researchers have conducted optimisation studies using RSM to calculate the data. Examples of such studies include the optimisation of steamed foam cakes prepared via separated-egg-sponge method (Jang et al., 2011), the selection of ingredients and baking process for improving the quality of wholemeal oat breads (Flander et. al., 2007), rice cake-baking in infrared-microwave combination ovens (Turabi et. al., 2008), the basic formulation of a traditionally-baked cassava cake (Gan et al., 2007), the formulation of soy cakes baked in infrared-microwave combination ovens (Şakıyan, 2015), as well as processing conditions and formulations of microwave-baked rice cakes (Alifakı et. al., 2016).
In food processing, the properties of moisture content, texture such as hardness and chewiness gives important effect for food production to maintain the good quality of food product. Therefore, this research aims to evaluate the physicochemical of pumpkin powder and to optimise the temperature and time on the physical properties of ‘bingka’.
Materials and Methods
Preparation before Drying Process
Firstly, the preparation of drying process was followed by cutting process, pre-treatment process and drying process. Three samples were used from different parts of pumpkins (peeled pumpkin, unpeeled pumpkin and pumpkin skin) where process into two conditions (treated and non-treated) before drying process. These treated samples, which are soaked in limewater and the non-treated sample without pre-treatment process was used as the control samples. Both treated and non-treated samples were dried in the same condition of processing parameters.
Cutting Process
The preparation of pumpkin flesh (peeled), flesh and skin (unpeeled), and skin powder was done by selecting pumpkins based on their size, which was about 1 kg per pumpkin. Pumpkins were purchased from a local market. Firstly, the pumpkins were washed to make sure that dirt and foreign material on the pumpkin skin were removed. The peeled and unpeeled were sliced (2 cm x 1 cm x 0.1 cm) and the skin was cut into the shape of rectangular (2.0cm x 1.0cm).
Pre-Treatment Process
The pre-treatment was conducted on the pumpkin samples before drying process, which is known as calcium impregnation. The scientific name of limewater is calcium hydroxide (Ca(OH)2). The samples were soaked in a limewater solution (1:7, v/v, 1 part of Ca(OH)2 and 7 parts of water at the standard concentration of 0.02 mg/mL for 25 min at room temperature (Keen et. al., 2016). Then, the samples were washed with tap water before dried with an absorbent paper.
Drying Process
The peeled pumpkin, unpeeled pumpkin, and pumpkin skin samples were dried using a commercial hot air fryer (Philips, HD9220/20, United Kingdom) with effective air velocity of approximately 5.12 m/s. The drying time and temperature for the air fryer can be controlled based on the desired process conditions. The conditions of drying parameters for temperature and time are 80 °C and 120 min, respectively.
After drying, the samples were allowed to cool down at room temperature. Then, the pumpkin samples were ground using an electronic blender and subsequently sieved using a standard steel sieve shaker (Minor Sieve Shaker, Endecott, London, England) through the size of 250 µm (60 mesh) to produce peeled pumpkin, unpeeled pumpkin, and pumpkin skin powder (Aukkanit and Sirichokworrakit, 2017). The powder was kept in a sealed plastic bag at room temperature for further investigation.
Analysis of Dried Pumpkin Powder
After drying process, the dried pumpkin powder was followed by analysis process (moisture content, water activity, colour, particle size and particles morphology).
Moisture Content Analysis
The moisture content of pumpkin powder was analysed using a moisture analyser (Infrared moisture balance, MX-50 A & D Weighing, Adelaide, Australia) under a standard drying programme (accuracy = 0.05% min-1). The results for moisture content obtained by this instrument were validated by the standard air oven method for total solids and baked products after overnight drying at 105 °C (AOAC, 2005).
Water Activity Analysis
A water activity meter (GDX Instrumentation Scientifique, France) was used to measure the water activity of the powder. Three triplicate measurements of water activity were performed for each sample (AOAC, 2005).
Colour Analysis
An Ultrascan PRO spectrocolorimeter (A60-1012-402 Model Colorimeter, Hunter Lab, Reston, VA, USA) was used to measure the colour intensities of peeled pumpkin, unpeeled pumpkin, and pumpkin skin powder. The parameters monitored were L* (whiteness/darkness), a* (redness/greenness), b* (blueness/yellowness) values and , , (colour coefficients) for raw pumpkin (Pathare et. al., 2013). The measurements were performed in triplicate. Total colour difference (∆E) was calculated as follows in eq.1 : ∆E – relative colour difference index:
![]()
Particle Size Analysis
The size of powder particles was determined by using a laser light diffraction instrument, Mastersizer 2000 (Malvern Instruments, Malvern, U.K) (Tze et al., 2012). The particle size was determined as the mean diameter over the volume distribution, which is usually used to characterise a particle and was expressed as D[4,3] (Tonon et. al., 2008). The particle size was measured in triplicates for treated and untreated pumpkin samples
Particles Morphology Analysis
Particles morphology was evaluated by scanning electron microscopy (SEM) (Hitachi, S-3400N, Tokyo, Japan) (Tonon et al., 2008). A 10-mm sample was mounted on a gold stub and sputter-coated (EMITECH, K550X, Quorum Technologies Ltd, East Sussex, UK) with platinum prior to the morphological assessment. The voltage used was 5 kV throughout the scanning process.
Preparations of Baking Pumpkin ‘Bingka’.
This stage of this study was to apply the powder produced were then used for ‘bingka’ baking.
Preparation of ‘Bingka’
Firstly, the ingredient above were weighed accurately according to their respective amount by using an electronic balance and placed into containers separately. The ingredients were placed in the room temperature and refrigerator to avoid contamination. The formulation or the amount of ‘bingka’ recipe that used fresh pumpkin samples is about 34.1% pumpkin boiled and mashed, 18.7% flour, 14.1% egg, 10.7% coconut milk, 11.8% sugar, 0.5% buttercup, 9.6% condensed milk, 0.3% salt and 0.2% vanilla essence. Then, the formulation of ‘bingka’ recipe that used powdered pumpkin samples is about 8.6% pumpkin powder, 25.5 % plain water, 18.7% flour, 14.1% egg, 10.7% coconut milk, 11.8% sugar, 0.5% buttercup, 9.6% condensed milk, 0.3% salt and 0.2% vanilla essence.
Before baking, the measurement of initial moisture content of the batter samples were standardised to the value of 48.75 ± 0.12% (wet basis). Then the ingredients of ‘bingka’ were poured into the round baking pan according specific weight. The pumpkin ‘bingka’ where baked by using air fryer.
Baking Conditions
Baking was done in a 1,425-Watt air fryer (Philips, HD9220, United Kingdom) with air velocity of 5.11 m/s. The baking conditions depended on the results of the preliminary experiment. Hence, the pumpkin cakes were baked at 130, 140, and 150 °C for 25, 30, and 35 min, respectively. In these respective cases, a convection oven was used as the experimental control set with air velocity of 0.08 m/s.
Optimisation of Baking Parameters
Moisture Content Analysis
Three slices of cakes measuring 2.5 cm3 each were cut and their moisture content was analysed using a moisture analyser as mentioned in Section 2.2.1.
Texture Analysis
Texture analysis of the ‘bingka’ (made from peeled and unpeeled pumpkin) was performed using a texture analyser (Model TA-XT2i, Stable Micro Systems, England). Three slices of cakes measuring 2.5 cm3 each were cut as shown in Figure 4. For the textural test (hardness and chewiness), a 35-mm cylinder (P/35) probe was selected for the texture analyser (Channgern and Suriyaphan, 2009). For the consistency of the measurements, the averages of triplicate determinations were obtained.
Optimisation of baking process using response surface methodology
A rotatable central composite design (CCD) was used to design the tests for the optimisation of baking process, which were temperature and time for baking pumpkin ‘bingka’. The measured responses were moisture content, hardness, and chewiness. According to the CCD, 13 experimental runs were performed, and the centre point determination was repeated six times. RSM was used to analyse the experimental data in the optimisation process (Patil et. al., 2014). RSM using Design-Expert software version 10.0.3.1 (Stat Ease Inc., Minneapolis, USA) was used with 2-variable, 3-level CCD. A composite function with a quadratic model was devised to study the combined effects of two independent variables of baking temperature and baking time.
Verification of Data
The optimum processing temperature and time were created by superimposing the plots for all the response variables. The selection of the optimum parameters used for analysing the predicted values of response variables was based on the predictive equation derived by RSM (Gan et al., 2007). The verification of the optimal formulations for making baked pumpkin cakes was performed. The processing parameters in the presence of optimum temperature and time were analysed, and the results were compared with the predicted values.
Results and Discussion
Effect of pre-treatment on moisture content and water activity
Based on Table 1, the moisture content and water activity of peeled pumpkin powder have the lowest values (non-treated = 5.68 ± 0.23 and treated = 5.18 ± 0.15; non-treated = 0.341 ± 0.03 and treated = 0.319 ± 0.05) respectively, compared to unpeeled pumpkin and pumpkin skin powder. This is because; the texture of peeled pumpkin is mild. Therefore, the texture of peeled pumpkin can ease removal of water during drying process conducted. The result shows that treated peeled pumpkin, unpeeled pumpkin, and pumpkin skin had a lower moisture content and water activity compared to non-treated samples of pumpkin powder.
This is because the treated sample is subjected to calcium pre-treatment, which reduces the moisture content by approximately 0.06%–0.51% in all parts of pumpkin powder (Keen et. al., 2016). This is further explained by the addition of Ca²+ that contributes to the stabilisation of membrane systems and forming Ca precipitate. It would also increase the rigidity of the middle lamella and cell wall. Therefore, after the drying process, there is a reduction of moisture content and water activity in pumpkin powder and the structure of the sample becomes more crispy and brittle.
For unpeeled pumpkin powder, the moisture content and water activity have lower values (non-treated = 6.64 ± 0.46 and treated = 6.16 ± 0.39; non-treated = 0.359 ± 0.01 and treated = 0.323 ± 0.16) respectively, compared to pumpkin skin powder. Furthermore, the moisture content of pumpkin skin is low (non-treated = 7.07 ± 0.62; treated = 6.23 ± 2.45) in some parts of pumpkin. The skin texture is bumpy and slightly rough. This finding is supported by (Keen et. al., 2016), in which low water activity level of pumpkin powder suggests a better keeping quality as most of the unfavourable changes in food occur during storage. In this work, the water activity below 0.6 for all samples indicates that the samples are microbiologically safe (Quek et. al., 2007).
Table 1: The moisture content and water activity of non-treated and treated pumpkin powder
| Samples | Moisture Content (%) | Water Activity | ||
| Non-treated | Treated | Non-treated | Treated | |
| Peeled | 5.68 ± 0.23ᵇ | 5.18 ± 0.15ᵃ | 0.341 ± 0.03ᶜ | 0.319 ± 0.05ᵇ |
| Unpeeled | 6.64 ± 0.46ᵇ | 6.16 ± 0.39ᵃ | 0.359 ± 0.01ᶜ | 0.323 ± 0.16ᵃ |
| Skin | 7.07 ± 0.62ᵇ | 6.23 ± 2.45ᵃ | 0.387 ± 0.01ᶜ | 0.342 ± 0.23ᵃ |
Superscript (a,b,c,…) = Treatment significant (p <0.05) in order to column.
Values are mean ± standard error,
Effect of pre-treatment on the colour of pumpkin powder
L* values represent the degree of lightness. The units are in the form of degrees (or angles), ranging from 0° (red) to 90° (yellow) 180° (green), 270° (blue) and back to 0° (McGuire, 1992). For the limewater-treated powder, the samples have the highest L* values of 64.10 ± 0.10 (peeled pumpkin), 64.43 ± 0.32 (unpeeled pumpkin), and 62.27 ± 0.23 (pumpkin skin) compared to non-treated samples (60.30 ± 0.30, 56.0 ± 0.40, and 60.07 ± 0.40 for peeled pumpkin, unpeeled pumpkin, and pumpkin skin, respectively). Higher L* values indicate a great browning occurred during heating (Manganaris et. al., 2005).
Table 2: The colour of peeled pumpkin, unpeeled pumpkin and pumpkin skin powder
| Samples | L* | a* | b* | ∆E | |
| Peeled | Non-treated | 60.30 ± 0.30 | 11.40 ± 0.17 | 49.67 ± 0.32 | 8.00 ± 0.02 |
| Treated | 64.10 ± 0.10 | 9.87 ± 0.06 | 53.47 ± 0.31 | 14.04 ± 0.76 | |
| Unpeeled | Non-treated | 56.70 ± 0.40 | 12.70 ± 0.20 | 43.10 ± 0.53 | 12.58 ± 0.50 |
| Treated | 64.43 ± 0.32 | 8.50 ± 0.20 | 49.47 ± 0.21 | 15.58 ± 2.44 | |
| Skin | Non-treated | 60.07 ± 0.40 | 6.57 ± 0.21 | 43.17 ± 0.42 | 10.13 ± 0.54 |
| Treated | 62.27 ± 0.23 | 6.50 ± 0.10 | 43.80 ± 0.26 | 11.85 ± 0.81 | |
∆E represents the effect of treated samples on the total changes of different parts of pumpkin powder. The total changes of the treated samples are higher than non-treated samples. The values of the treated samples are 14.04 ± 0.76 (peeled), 15.58 ± 2.44 (unpeeled), and 11.85 ± 0.81 (skin) compared to the values of the non-treated samples of 8.00 ± 0.02 (peeled), 12.58 ± 0.50 (unpeeled), and 10.13 ± 0.54 (skin). This is due to loss of the Ca2+ ions in the fruit cell will occur the browning and calcium treatment will reduce browning by stabilizing the Ca2+ ions in cell membranes (Poovaiah, 1986; Hopfinger et al. 1984). Drying conditions, including high temperature, light, and oxygen exposure, can cause changes in food surface characteristics that change the colour and may cause carotenoid degradation (Workneh et. al., 2012).
Effect of pre-treatment on the particle size of pumpkin powder
Based on Table 3, the particle size of the treated samples is lower than the untreated samples. This study is reasonable because limewater treatment shrinks pumpkin tissues, which allows osmosis to occur. Osmosis is a process where substance flows from high concentration to low concentration. Previously, calcium treatment from limewater can firm the sample (Keen et. al., 2016). After drying process occurs, it will reduce the moisture content in the sample and change the structure of the sample to be more brittle and easy to dry.
The particle size of the treated samples is smaller than the non-treated samples. For different parts of pumpkin, the skin has the lowest particle size compared to other parts. The particle size of the skin is 103.03mm for the non-treated samples and 97.96 mm for the treated samples. The moisture content of the skin is higher than peeled and unpeeled skin samples but has the lowest particle size. This is because the texture of pumpkin skin is so unique that the rough texture needs time to dry.
Table 3: Particle size of non-treated and treated pumpkin powder
| Samples | Particle Size (µm) | |
| Non-treated | Treated | |
| Peeled | 122.78 ± 0.15ᵃ | 120.99 ± 2.54ᵇ |
| Unpeeled | 139.11 ± 0.72ᵇ | 112.71 ± 0.31ᵇ |
| Skin | 103.03 ± 0.34ᵃ | 97.96 ± 0.86ᵇ |
Superscript (a,b,c,…) = Treatment significant (p <0.05) in order to column.
Values are mean ± standard error
Effect of pre-treatment on the structure of pumpkin powder
Figures 1–3 show the images of SEM taken to observe the surface structure of optimised treated and untreated pumpkin powder samples. The surface structures for treated peeled, unpeeled, and skin samples are more clotted than the treated samples. This is due to the removal of free water during drying process and microstructure stresses developed inside the products (Rahman et. al., 2016). The structure for untreated samples of pumpkin powder becomes flakes and the surface area of particle size is bigger than the treated samples. The treated pumpkin powder samples appear to have more open and larger pores in the microstructure probably due to the pre-treatment of samples in limewater.
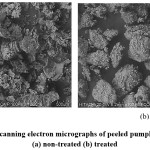 |
Figure 1: Scanning electron micrographs of peeled pumpkin powder (a) non-treated (b) treated Click here to View figure |
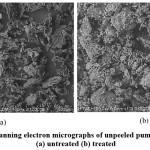 |
Figure 2: Scanning electron micrographs of unpeeled pumpkin powder (a) untreated (b) treated Click here to View figure |
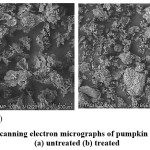 |
Figure 3: Scanning electron micrographs of pumpkin skin powder (a) untreated (b) treated Click here to View figure |
The moisture contents of peeled pumpkin powder are 5.18% for the treated samples and 5.68% for the non-treated samples. Meanwhile, the particle sizes of peeled pumpkin powder are 122.78µm for the non-treated samples and 120.99µm for the treated samples. Both criteria have the lowest moisture content and the highest particle size. Based on Figure 1(a), the image taken is similar to a flake but Figure 1(b) appears to be more clotted. Besides, for skin sample, the moisture contents are 7.07% (non-treated) and 6.23% (treated). Furthermore, the particle sizes are 103.03µm (non-treated) and 97.06µm (treated). The skin of the treated samples has higher moisture content and smaller particle size. From Figure 3(b), it can be seen that the particle size in the image is smaller than the particle size in Figure 3(a). From SEM images, it can be concluded that the image of the treated samples has smaller particle size than the non-treated samples.
Optimisation of baking temperature and time of pumpkin ‘bingka’ using response surface methodology
It is confirmed that the fitted model from the ANOVA data is suitable because it shows a significant regression, low residual values, no lack of fit with satisfactory determination coefficients (R²) of 0.946 to 0.9988 for the responses including moisture content, hardness, and chewiness from the ‘bingka’ made by fresh sample and powder, as well as unpeeled and peeled samples. The value of R² should be close to 1 for a good statistical model. The model terms are more significant for lower p value. The p value of less than 0.05 suggests that the model term is significant (Ghodke et. al., 2009).
Effects of baking temperature and time on moisture content
Table 4 presents the effects of baking parameters (temperature and time) on moisture content, hardness, and chewiness for the samples baked by using an air fryer. Firstly, moisture content is the most essential criterion and it is closely associated with the quality and texture of pumpkin ‘bingka’. Before baking, the initial moisture content of the batter was standardised to the value of 48.75 ± 0.12% (wet basis). The final moisture content of all the ‘bingka’ samples is between 30% and 45% (wet basis) (Table 4). The ‘bingka’ baked at 150 °C in the air fryer resulted in low moisture content (30.60%) at 35 min as compared to baking at a lower temperature (130 °C) (Table 5).
The highest moisture content was recorded for the sample baked at 130 °C for 25 min. The moisture content of baked ‘bingka’ was observed for the sample made from peeled and unpeeled fresh pumpkin (45.92% and 43.47%, respectively). The moisture contents of the ‘bingka’ made by using the powder from peeled and unpeeled pumpkin are 44.23% and 44.47%, respectively. It is observed that the ‘bingka’ made from peeled pumpkin and peeled pumpkin powder has the highest value of moisture content compared to the ‘bingka’ made from unpeeled pumpkin. This is due to the texture of pumpkin that peeled pumpkin is from flesh of pumpkin whereas unpeeled pumpkin its combination of flesh and skin pumpkin.
Table 4: Experimental design and data obtained for the response variables of pumpkin ‘bingka’ baking.
| Run | Parameters | Responses | |||||||||||||
| Peeled Pumpkin | Unpeeled Pumpkin | Peeled Pumpkin Powder | Unpeeled Pumpkin Powder | ||||||||||||
| Temperature (°C) | Time (min) | MC (%) | Hardness (N) | Chewiness (N) | MC (%) | Hardness (N) | Chewiness (N) | MC (%) | Hardness (N) | Chewiness (N) | MC (%) | Hardness (N) | Chewiness (N) | ||
| 1 | 130 | 25 | 45.92 | 8.55 | 2.95 | 43.47 | 8.43 | 3.03 | 44.23 | 8.76 | 3.49 | 44.47 | 8.58 | 3.37 | |
| 2 | 130 | 30 | 44.55 | 8.96 | 3.48 | 42.28 | 9.56 | 3.84 | 43.59 | 9.74 | 4.02 | 43.78 | 9.71 | 3.79 | |
| 3 | 130 | 35 | 43.63 | 9.92 | 4.36 | 41.18 | 11.83 | 4.93 | 42.72 | 10.78 | 4.82 | 42.18 | 10.74 | 4.34 | |
| 4 | 140 | 25 | 40.84 | 11.52 | 5.25 | 40.47 | 12.41 | 5.41 | 40.39 | 11.38 | 5.73 | 41.27 | 11.62 | 4.96 | |
| 5 | 140 | 30 | 40.62 | 12.36 | 5.96 | 39.35 | 13.06 | 6.79 | 38.64 | 12.46 | 6.12 | 39.95 | 12.69 | 5.30 | |
| 6 | 140 | 30 | 39.90 | 12.53 | 6.04 | 38.85 | 13.99 | 6.31 | 38.91 | 12.66 | 6.57 | 38.85 | 13.48 | 5.81 | |
| 7 | 140 | 30 | 39.00 | 12.03 | 6.58 | 39.08 | 14.06 | 6.57 | 39.18 | 11.89 | 6.88 | 39.08 | 12.85 | 6.25 | |
| 8 | 140 | 30 | 39.56 | 12.15 | 6.34 | 39.26 | 14.14 | 6.93 | 39.89 | 12.63 | 6.32 | 39.46 | 12.33 | 6.44 | |
| 9 | 140 | 30 | 39.25 | 12.19 | 6.81 | 39.16 | 14.67 | 6.05 | 39.24 | 12.39 | 6.59 | 38.75 | 13.02 | 6.93 | |
| 10 | 140 | 35 | 38.98 | 13.42 | 7.34 | 37.49 | 15.10 | 7.49 | 37.45 | 13.22 | 7.21 | 37.41 | 13.82 | 7.24 | |
| 11 | 150 | 25 | 38.12 | 13.79 | 7.97 | 34.65 | 15.16 | 7.92 | 36.46 | 13.75 | 7.40 | 36.49 | 14.05 | 7.83 | |
| 12 | 150 | 30 | 37.12 | 14.23 | 8.35 | 33.29 | 15.38 | 8.01 | 34.19 | 14.07 | 7.76 | 35.23 | 14.73 | 8.09 | |
| 13 | 150 | 35 | 35.60 | 14.70 | 8.94 | 30.60 | 15.67 | 8.70 | 33.06 | 14.48 | 7.98 | 34.60 | 15.56 | 8.31 | |
Table 5: Analysis of variance of the responses by quadratic regression model
| Sources | Peeled Pumpkin | Unpeeled Pumpkin | Peeled Pumpkin Powder | Unpeeled Pumpkin Powder | ||||||||
| MC | Hardness | Chewiness | MC | Hardness | Chewiness | MC | Hardness | Chewiness | MC | Hardness | Chewiness | |
| Model | < 0.0001* | < 0.0001* | < 0.0001* | < 0.0001* | < 0.0001* | < 0.0001* | < 0.0001* | < 0.0001* | < 0.0001* | < 0.0001* | < 0.0001* | 0.0005* |
| A-Temperature | < 0.0001* | < 0.0001* | < 0.0001* | < 0.0001* | < 0.0001* | < 0.0001* | < 0.0001* | < 0.0001* | < 0.0001* | < 0.0001* | < 0.0001* | < 0.0001* |
| B-Time | 0.0011* | 0.0001* | 0.0010* | < 0.0001* | 0.0011* | 0.0006* | < 0.0001* | 0.0001* | 0.0009* | 0.0007* | 0.0002* | 0.0220* |
| AB | 0.8279** | 0.3588** | 0.5383** | 0.0053* | 0.0253* | 0.1333** | 0.0055* | 0.042* | 0.1794** | 0.7338** | 0.366** | 0.8704** |
| A² | 0.0114* | 0.0016* | 0.1418** | < 0.0001* | 0.0046* | 0.0535** | 0.4959** | 0.0277* | 0.0065* | 0.5856** | 0.0247* | 0.8143** |
| B² | 0.7123** | 0.2309** | 0.8461** | 0.1241** | 0.9244** | 0.7534** | 0.5854** | 0.8179** | 0.9886** | 0.9337** | 0.718** | 0.9376** |
| Lack of fit | 0.8994 | 0.2679 | 0.5671 | 0.2900 | 0.7223 | 0.6162 | 0.9511 | 0.8257 | 0.7418 | 0.2958 | 0.9423 | 0.6605 |
| R² | 0.982 | 0.989 | 0.986 | 0.998 | 0.970 | 0.974 | 0.993 | 0.986 | 0.972 | 0.978 | 0.982 | 0.975 |
*significant (p < 0.05); ** not significant (p > 0.05)
Baking temperature will affect the highest or lowest condition on moisture content of pumpkin ‘bingka’. The only temperature is highly significant effect (p < 0.05) on moisture content for each sample. The air flow in the air fryer significantly influenced the baking temperature as well. A higher baking temperature meant that more heat was transfer to the ‘bingka’ surface. Thus, an increase in the moisture content of baked pumpkin ‘bingka’ could have led to an increase in the hardness of the products. It can be acknowledged that moisture content is significantly influenced by temperature and time.
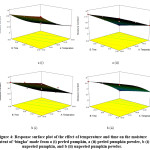 |
Figure 4: Response surface plot of the effect of temperature and time on the moisture content of ‘bingka’ made from a (i) peeled pumpkin, a (ii) peeled pumpkin powder, b (i) unpeeled pumpkin, and b (ii) unpeeled pumpkin powder. Click here to View figure |
From Figure 4 (a)i, there might be shorter baking process occurring as the response surface plot increases consistently compared to Figure 4 (b)i. It means that a temperature increase during baking process reduces the rate of heat penetration into the ‘bingka’. It can be related that longer contact time of a cake in an oven causes more evaporation of water vapour (Alifakı and Şakıyan, 2016). The decreasing amount of heat penetrating through the ‘bingka’ becomes a restrictive factor, thus slowing the moisture vapour generation in the ‘bingka’ batter (Shahapuzi et al., 2015).
Effects of baking temperature and time on hardness
The determination of the hardness requires compression of the sample using force (N) by setting the product distance (Al-Muhtaseb et al., 2013). The effects of time and temperature on hardness are shown in Table 4. Baking temperature and time have a significant effect on the hardness of ‘bingka’ made from unpeeled pumpkin and peeled pumpkin powder (p < 0.05) baked using the air fryer.
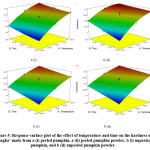 |
Figure 5: Response surface plot of the effect of temperature and time on the hardness of ‘bingka’ made from a (i) peeled pumpkin, a (ii) peeled pumpkin powder, b (i) unpeeled pumpkin, and b (ii) unpeeled pumpkin powder. Click here to View figure |
Figure 5 shows that all graphs are negatively quadratic. The same pattern in the said graphs may be due to the initial increase and subsequent decrease in the heat transfer and time gap during the baking of ‘bingka’. When the pumpkin ‘bingka’ is baked at a higher temperature for a longer time, its hardness will increase. This is due to the circulation of superheated air, in which the baking chamber receives heat from a heating element close to the ‘bingka’ (Rahman et al., 2016).
Effects of baking temperature and time on chewiness
Chewiness is the force required to chew a solid food until it is ready for swallowing (Al-Muhtaseb et al., 2013). From the collected data, it can be said that with the increase of baking temperature and time, the hardness of ‘bingka’ will increase, hence producing an increment in the force required to chew the ‘bingka’ until it is ready for swallowing. The highest value of chewiness is 8.94 N for the ‘bingka’ made from peeled pumpkin baked at 150 °C for 35 min. This is because the heating rises faster at high baking temperature, resulting in the increase of the chewiness of pumpkin ‘bingka’.
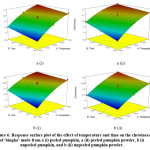 |
Figure 6: Response surface plot of the effect of temperature and time on the chewiness of ‘bingka’ made from a (i) peeled pumpkin, a (ii) peeled pumpkin powder, b (i) unpeeled pumpkin, and b (ii) unpeeled pumpkin powder. Click here to View figure |
Besides, only baking temperature is found to significantly affect the chewiness of the pumpkin ‘bingka’. Lower temperature during baking would produce softer texture and less chewy pumpkin ‘bingka’. Based on Figure 6, baking temperature of 130 °C and baking time of 25 min, as well as fresh unpeeled pumpkin ‘bingka’ resulted in the lowest value of chewiness (3.03N). Evidently, the addition of powdered pumpkin flesh and skin will affect the texture of the product. However, at the same temperature and time as mentioned above, the chewiness of unpeeled pumpkin powder ‘bingka’ is higher than that of the peeled pumpkin powder product, as shown in Figure 6 b (ii) and Figure 6 a (ii). At higher temperatures, more moisture is lost due to evaporation; hence, the firmness increases and more chewing are required to swallow the ‘bingka’.
Optimisation and validation of the data
Based on the discussion and the results, it can be concluded that the criteria of all independent variables are very important in defining the characteristics of ‘bingka’. The best combination of the factors is able to produce the expected characteristics of the final ‘bingka’. The optimisation of baking conditions arises from compromises among different responses (Das et. al., 2012). The criteria of optimisation should be selected and each response variable may either be minimised or maximised.
The moisture content and of commercial value of pandan ‘bingka’ was 43.6 ± 0.65%, pumpkin ‘bingka’ 44.28 ± 0.13%.The ranges selected as the goals for each criterion with some alterations are tabulated in Table 6 . Each variable is defined to produce the best quality of powder.
Table 6: Criteria and outputs for numerical optimization of pumpkin cake.
| Criteria | Goals | Limit |
| Temperature (°C) | Minimize | 130 – 150 |
| Time (min) | Minimize | 25 – 35 |
| Moisture Content (%) | in the range | 38 – 42 |
| Hardness (N) | in the range | 10.0 – 11.5 |
| Chewiness (N) | in the range | 3.0 – 4.5 |
The values of limitation of moisture content, hardness and chewiness were based on preliminary experiment and local and product. The ‘bingka’ baked at minimum baking time and temperature has higher moisture content of 45.78 ± 0.03 at lower hardness. Overall, the moisture content and hardness are acceptable for a presentable ‘bingka’ made from peeled and unpeeled pumpkins. The predicted and experimental results showed that the percentage errors are less than 10%; therefore, the response model has a valid prediction (Siti Faridah & Noor Aziah, 2012).
Table 7: Predicted and experimental values of the response variables at optimum formulation.
| Sample | Temp | Time | MC (%) | % error | Hardness (N) | % error | Chewiness (N) | % error | |||
| Predicted | Experimental | Predicted | Experimental | Predicted | Experimental | ||||||
| PP | 130 | 25 | 41.89 | 40.36 ± 0.24 | 1.17 % | 11.30 | 11.45 ± 4.30 | 1.31% | 3.35 | 3.31.± 0.32 | 1.20% |
| UP | 130 | 25 | 41.96 | 41.19 ± 0.52 | 1.84 % | 11.46 | 12.52 ± 0.95 | 8.47% | 3.40 | 3.23 ± 0.12 | 5.00% |
| PPP | 130 | 25 | 41.86 | 42.38 ±0.40 | 3.58 % | 10.90 | 10.68 ± 0.86 | 2.01% | 3.20 | 3.16 ± 0.53 | 1.25% |
| UPP | 130 | 25 | 42.00 | 45.78 ± 0.03 | 9.00 % | 11.06 | 12.13 ± 1.14 | 8.82% | 3.26 | 3.21 ± 0.24 | 1.53% |
** PP- Peeled Pumpkin; UP- Unpeeled Pumpkin; PPP- Peeled Pumpkin Powder; UPP- Unpeeled Pumpkin Powder
Colour of pumpkin ‘bingka’
Table 8 shows the values of the tristimulus colour parameters of L*, a*, and b*, as well as ∆E of pumpkin ‘bingka’. The L* values of the ‘bingka’ made from peeled and unpeeled pumpkin powder are 61.51 ± 0.26 and 63.10 ± 0.32, respectively, whereas the L* values of the ‘bingka’ made from peeled and unpeeled pumpkins are 60.09 ± 0.57 and 63.67 ± 0.43, respectively. These results are expected because they are similar to the colour of a fresh pumpkin. The colour of fresh pumpkin flesh is about 67.94, according to the L* parameter (Norfezah et. al., 2011).
Table 8: The colour of pumpkin ‘bingka’ at optimum formulation.
| Samples | L* | a* | b* | ∆E |
| PP | 60.09 ± 0.57ᵇ | 13.79 ± 0.26ᵇ | 52.99 ± 0.49ᶜ | 11.26 ± 0.04ᵃ |
| UP | 63.67 ± 0.43ᵃ | 14.10 ± 0.29ᵇ | 56.59 ± 0.71ᶜ | 11.59 ± 0.06ᵃ |
| PPP | 61.51 ± 0.26ᵃ | 19.34 ± 0.77ᵇ | 60.37 ± 0.88ᶜ | 11.88 ± 0.08ᵃ |
| UPP | 63.10 ± 0.32ᵃ | 13.15 ± 5.85ᵇ | 55.29 ± 3.44ᶜ | 11.47 ± 0.34ᵃ |
Superscript (a,b,c,…) = Treatment significant (p <0.05) in order to column.
Values are mean ± standard error
According to the experimental results, the ∆E values of the ‘bingka’ baked in the air fryer are from 11.26 to 11.88 (Table 8). The increased values of ∆E are obtained due to higher temperature, especially with the airflow of the air fryer. According to the statistical analysis, baking temperature and time are significant criteria for the colour change of the ‘bingka’.
Conclusions
The pre-treatments were significantly (p <0.05) different on different parts of pumpkin powder properties in general. The limewater pre-treatment was observed in moisture content, water activity, particle size and morphology reduction in all sample pumpkin powder after drying as compared to control sample/control powder. The moisture content of treated samples are 5.18%, 5.56%, and 4.93% for peeled pumpkin, unpeeled pumpkin, and pumpkin skin, respectively. It was proven that peeled pumpkin powder, unpeeled pumpkin powder and skin pumpkin powder that were pre-treated with limewater have a good quality in terms of moisture content, water activity, particle size, colour and structural morphology. Pumpkin powders produced under optimum operating parameters were then applied in ‘bingka’ as a substitute for fresh pumpkin. Pumpkin powders produced under optimum operating parameters were then applied in ‘bingka’ as a substitute for fresh pumpkin. Baking temperature and time affect the moisture content and texture of peeled and unpeeled pumpkin ‘bingka’. Baking temperature and time show significant effect (p < 0.05) on the moisture content and hardness of all samples, except for those made from fresh pumpkin, unpeeled pumpkin, and peeled pumpkin powder.
Acknowledgement
This work is supported by University Putra Malaysia
Funding Sources
The authors received no financial support for the research, authorship, and publication of this article.
Conflict of Interest
The authors were declares no conflict of interest.
References
- Alandes, L., I. Pérez-Munuera, E. Llorca, A. Quiles and I. Hernando, 2009. Use of calcium lactate to improve structure of “Flor de Invierno” fresh-cut pears. Postharvest Biology and Technology, 53: 145- 151.
- Alifakı, Y. Ö., & Şakıyan, D. Ö. (2016). Utilization of Response Surface Methodology to Optimize of Process Conditions and Formulation of Microwave Baked Rice Cake. The Journal of Food(Gida), 41(2), 91–98.
- Aukkanit, N., & Sirichokworrakit, S. (2017). Effect of Dried Pumpkin Powder on Physical , Chemical , and Sensory Properties of Noodle, International Journal Advances in Science Engineering and Technology, (1), 14–18.
- Aydin, E., & Gocmen, D. (2015). The influences of drying method and metabisulfite pre-treatment onthe color, functional properties and phenolic acids contents and bioaccessibility of pumpkin flour. Food Science and Technology, 60(1), 385–392.
- Aziah, A. A. N., & Komathi, C. A. (2009). Physicochemical and functional properties of peeled and unpeeled pumpkin flour. Journal of Food Science, 74(7), 328–333.
- Bhat M. A., B. A. (2013). Study on Physico-Chemical Characteristics of Pumpkin Blended Cake. Journal of Food Processing & Technology, 04(09).
- Channgern, C., & Suriyaphan, O. (2009). Texture and Sensory Qualities of Steam Cake Containing Soy Protein Isolate, 1–11.
- Dabash, V., Burešová, I., Tokár, M., Zacharová, M., & Gál, R. (2017). the Effect of Added Pumpkin Flour on Sensory and Textural Quality of Rice Bread. Journal of Microbiology, Biotechnology and Food Sciences, 6(6), 1269–1271.
- Das L., Raychaudhuri U., & Chakraborty R. (2012). Effect of Baking Conditions on the Physical Properties of Herbal Bread Using Rsm. International Journal of Food, Agriculture & Veterinary Sciences, 2(2), 106–114.
- Das, S., & Banerjee, S. (2015). Production of Pumpkin Powder and Its Utilization in Bakery Products Development : a Review. International Journal of Research in Engineering AndTechnology, 4(5), 2319–2322.
- Egbekun, M. K., Nda-Suleiman, E. O., & Akinyeye, O. (1998). Utilization of fluted pumpkin fruit (Telfairia occidentalis) in marmalade manufacturing. Plant Foods for Human Nutrition, 52(2), 171–176.
- Flander, L., Salmenkallio-Marttila, M., Suortti, T., and Autio, K. (2007). Optimization of ingredients and baking process for improved wholemeal oat bread quality. LWT – Food Science and Technology, 40(5), 860–870.
- Gan, H. E., Karim, R., Muhammad, S. K. S., Bakar, J. A., Hashim, D. M., & Rahman, R. A. (2007). Optimization of the basic formulation of a traditional baked cassava cake using response surface methodology. LWT – Food Science and Technology, 40(4), 611–618.
- Ghodke, S. K., Ananthanarayan, L., & Rodrigues, L. (2009). Use of response surface methodology to investigate the effects of milling conditions on damaged starch, dough stickiness and chapatti quality. Food Chemistry, 112(4), 1010–1015.
- Hopfinger, J.A., B.W. Poovaiah and M.E. Patterson, 1984. Calcium and magnesium interactions in browning of ‘Golden Delicious’ apples with bitter pit. Scientia Horticulturae, 23: 345- 351.
- Jang, M. S., Park, J. E., & Kwhak, S. H. (2011). Optimization of the steamed foam cakes prepared with separated-egg-sponge method using response surface methodology. Food Science and Biotechnology, 20(3), 571–578.
- Keen, J. L. H., Taip, F. S., Ibrahim, M. N., Aziz, N. A., and Shishir, M. R. I., (2016). Effect of Pre-Treatment on the Physical Properties of Pumpkin Powder. Australian Journal of Basic and Applied Sciences, 10(7), 146–151.
- Kulkarni, A. S., & Joshi, D. C. (2013). Effect of replacement of wheat flour with pumpkin powder on textural and sensory qualities of biscuit. International Food Research Journal, 20(2), 587–591.
- Lahtinen, S., Levola, M., Jouppila, K., & Salovaara, H. (1998). Factors affecting cake firmness and cake moisture content as evaluated by response surface methodology. Cereal Chemistry, 75(4), 547–550.
- Lee, C. H., Cho, J. K., Lee, S. J., Koh, W., Park, W., & Kim, C. H. (2002). Enhancing ??-carotene content in Asian noodles by adding pumpkin powder. Cereal Chemistry, 79(4), 593–595.
- Manganaris, G.A., M. Vasilakakis, G. Diamantidis and I. Mignani, 2005. Effect of calcium additives on physicochemical aspects of cell wall pectin and sensory attributes of canned peach (Prunus persica (L.) Batsch cv Andross). Journal of the Science of Food and Agriculture, 85: 1773-1778
- Manivannan, P., & Rajasimman, M. (2011). Optimization of process parameters for the osmotic dehydration of beetroot in sugar solution. Journal of Food Process Engineering, 34(3), 804–825.
- McGuire, R. 1992. Reporting of objective colour measurement. HortScience, 27(12): 1254-1255
- Murzaini, N. M. N., & Taip, F. S. (2016). Optimization of processing conditions in drying of different parts pumpkin powder using air fryer method .International Conference of Agricultural and Food Engineering, 23–25.
- Norfezah, M. N., Hardacre, A., & Brennan, C. S. (2011). Comparison of waste pumpkin material and its potential use in extruded snack foods. Revista de Agaroquimica y Tecnologia de Alimentos, 17(4), 367–373.
- Pathare, P. B., Opara, U. L., & Al-Said, F. A. J. (2013). Colour Measurement and Analysis in Fresh and Processed Foods: A Review. Food and Bioprocess Technology, 6(1), 36–60.
- Patil, V., Chauhan, A. K., & Singh, R. P. (2014). Optimization of the spray-drying process for developing guava powder using response surface methodology. Powder Technology, 253, 230–236.
- Pongjanta, J., Naulbunrang, A., Kawngdang, S., Manon, T., & Thepjaikat, T. (2006). Utilization of pumpkin powder in bakery products. Songklanakarin Journal of Science and Technology, 28(1), 71–79.
- Poovaiah, B.W., 1986. Role of calcium in prolonging storage life of fruits and vegetables. Food Technology, 40: 86-89.
- Prachayawarakorn, S., Tia, W., Plyto, N., & Soponronnarit, S. (2008). Drying kinetics and quality attributes of low-fat banana slices dried at high temperature. Journal of Food Engineering, 85(4), 509–517.
- Que, F. Mao, Li., Fang, X., and Wu, T. (2008). Comparison of hot air-drying and freeze-drying on the physicochemical properties and antioxidant activities of pumpkin (Cucurbita moschata Duch.) flours. International Journal of Food Science and Technology, 43(7), 1195–1201.
- Rahman, N. A. A., Razak, S. Z. A., Taip, L. A. L. F. S., & Kamal, S. M. M. (2016). Response surface optimization for hot air-frying technique and its effects on the quality of sweet potato snack, 1–8.
- Şakıyan, Ö. (2015). Optimization of formulation of soy-cakes baked in infrared-microwave combination oven by response surface methodology. Journal of Food Science and Technology, 52(5), 2910–2917.
- Sani, N. A., Taip, F. S., Kamal, S. M. M., & Aziz, N. A. (2014). Effects of temperature and airflow on volume development during baking and its influence on quality of cake. Journal of Engineering Science and Technology, 9(3), 303–313.
- Sosa, C. A., Sgroppo, S. C., & Bevilacqua, A. E. (2013). Physicochemical changes on pumpkin/pepper sauces during refrigerated storage. Journal of Food Processing and Preservation, 37(3), 262–268.
- Tonon, R. V., Brabet, C., & Hubinger, M. D. (2008). Influence of process conditions on the physicochemical properties of açai (Euterpe oleraceae Mart.) powder produced by spray drying. Journal of Food Engineering, 88(3), 411–418.
- Tunde-Akintunde, T. Y., & Ogunlakin, G. O. (2011). Influence of drying conditions on the effective moisture diffusivity and energy requirements during the drying of pretreated and untreated pumpkin. Energy Conversion and Management, 52(2), 1107–1113.
- Turabi, E., Sumnu, G., & Sahin, S. (2008). Optimization of baking of rice cakes in infrared-microwave combination oven by response surface methodology. Food and Bioprocess Technology, 1(1), 64–73.
- Tze, N. L., Han, C. P., Yusof, Y. A., Ling, C. N., Talib, R. A., Taip, F. S., & Aziz, M. G. (2012). Physicochemical and nutritional properties of spray-dried pitaya fruit powder as natural colorant. Food Science and Biotechnology, 21(3), 675–682.
- Wongsagonsup, R., Kittisuban, P., Yaowalak, A., & Suphantharika, M. (2015). Physical and sensory qualities of composite wheat-pumpkin flour bread with addition of hydrocolloids. International Food Research Journal, 22(2), 745–752.
Accepted on: 09/01/2020
Second Review by: Dr. Sani Jirasatid Thailand
Final Approval by: Prof. Giovani Leone Zabot


Web of Science Coverage
Emerging Sources Citation Index (ESCI)
2024 Journal Impact Factor: 1.1
Scopus Journal Metrics
CiteScore 2025: 2.6
CiteScore Details
Sustainable Nutrition: Food Systems, Nutrient Retention, and Public Health Impact
![]()
This journal is a member of, and subscribes to the principles of, the Committee on Publication Ethics (COPE)


