Soft Drink Consumption and its Influence on BMI and Academic Performance among Selected School Children in Dhaka City of Bangladesh
Md Shahjahan1*
, T Khatun3, S Hossain4, , , 5 1Department of Public Health, Faculty of Allied Health Sciences, Daffodil International University, Dhanmondi, Dhaka, Bangladesh.
2Department of Operations Management and Business Statistics, Sultan Qaboos University, Muscat, Oman.3Department of Community Nutrition, Faculty of Public Health, Bangladesh University of Health Sciences, Mirpur, Dhaka, Bangladesh.
4Department of Health Promotion and Health Education, Faculty of Public Health, Bangladesh University of Health Sciences, Mirpur, Dhaka, Bangladesh.
5School of Health and Rehabilitation Sciences, The University of Queensland, Australia.
Corresponding Author Email: mdshahjahan@agnionline.com
DOI : http://dx.doi.org/10.12944/CRNFSJ.7.3.18
Download this article as:
![]()
Soft drink refers to sugar-sweetened beverages that contain a natural or artificial flavoring. Daily soft drinks consumption in children is an unhealthy lifestyle behavior that demands special attention to maintain their healthy lives. The present study was aimed to examine the consumption of soft drink and its influence on BMI, and academic performance among selected school children in Dhaka City of Bangladesh. This cross-sectional study was nested among 600 randomly selected young school-aged children (6-17 years, both boys and girls) from the six English Medium schools in Dhaka city of Bangladesh. Face-to-face interviews were conducted to collect the data using a semi-structured interviewer-administered questionnaire. Descriptive and bivariate analyses were done using SPSS 20.0. Results showed that about 48% of the school children consumed soft drinks regularly. Raised weight and Body Mass Index (BMI) was higher among regular soft drink consumers compared to their counterparts (p<0.05). Study revealed that girls (49%) consumed more artificial color soft drinks than boys (30%). On bivariate analysis, the availability (p<0.01) and accessibility of soft drinks (p<0.01), peer influence (p<0.01), low price (p<0.01) and advertisement (p<0.01) were established to be significant determinants for soft drink consumption among the young school students. Study findings showed that academic performance was better among non-consumers of soft drinks (p<0.001). The overall consumption of soft drinks is alarming among school children and its influence on increasing BMI and decreasing academic performance. The high consumption of soft drinks deserve due attention to avoid the development of non-communicable diseases. Therefore, well coordinated health education programs are recommended to minimize the consumption of soft drinks among school children.
KEYWORDS:Soft Drinks Consumption; School Children; BMI; Academic Performance; Overweight/Obesity; Bangladesh
Introduction
Soft drink consumption is increasing among the children and has become a controversial public health concern. Soft drink is a nonalcoholic drink, especially one that is carbonated1 consisting of a unique chemical blend of sugar or artificial sweetening agents, caffeine, colour, flavour and preservatives in water, injected with carbon-dioxide gas. All of these ingredients are associated with increased body weight, decreased nutrient intake, and may lead to develop different non communicable diseases like cancer and heart disease.2 Despite this, soft drinks may be part of a diet for enjoyment as well as an essential contributor for hydration. Besides, light beverages may be an integral part of weight loss plans.3,4 The consumption of soft drink is increasing day by day around the globe. In 2010, the highest growth in the soft drinks market was found in Asia, where India and China reported their growth rates of 16% and 14% respectively.5
Rising incomes, rapid urbanization, and a growing population are important predictors that includes a high proportion of young people who are more likely to consume soft drinks in Bangladesh. Besides, other factors conducive to soft drinks consumption include rising domestic production, the hot climate and inadequate access to safe drinking water. Many manufacturers rely on synthetic dyes which may have hazardous health consequences particularly for the children.6,7 Consumption of non-permitted colors in soft drinks may cause several adverse health effects.8-10 Studies have shown that consumption of soft drink can reduce dietary intake of vitamin A and C, calcium, magnesium and riboflavin in children’s and adolescents.11,12 Moreover, it can increase in calorie intake, and overnutrition may develop into obesity, which increases the risk of serious health for kids.13,14 According to Center for Science in the Public Interest (CSPI), in the United States, per-capita consumption of carbonated sugar-sweetened drinks declined by 25 per cent between 1998 and 2014, and sales are projected to decline in North America and Western Europe. On the other hand, soda sales in Latin America, Asia Pacific and Middle Eastern and African countries are all projected to increase between now and 2018.15
After independence the food habit of Bangladeshi people has been changed a lot. From 1980 to onwards, Bangladeshi people become habituated with western foods alongside with traditional foods. As a result of globalization and rapid urbanization the lifestyle as well as food habit has been changed a lot and children are not the exception one. Rapid growth of fast food shop, lower price, available and accessible in school premises and different types of occasion could be the reason consuming soft drinks among Bangladeshi school children. In addition, the promotion of soft drinks is very common in Bangladesh that attracts young people easily. As a result, teenagers and young people become addicted to these beverages, which may require further scientific evidence to find out the relationship between soft drink consumption and academic performance. Therefore, the present study aimed to examine the soft drink consumption and its influence on BMI and academic performance among selected school children in Dhaka City of Bangladesh.
Methodology
Research Design
This study was cross-sectional in design.
Population of Study
A total of 600 school children aged 6-17 years (where 50% were boys and 50% were girls) were enrolled for this study. Six English Medium schools were selected purposively from Dhanmondi residential area. The rationale for choosing this area was because most of the people living in the area have high socio-economic status and thus more likely to have habit of consumptions artificial color soft drinks. Students who fulfilled the inclusion criteria (age 6-17 years, healthy and willing to participate in the study) were included, and, who had severe physical and mental illness were excluded from the study.
Sampling Technique & Sample Size Determination
Cluster sampling design was used to determine the sample size. Non availability of information regarding soft drinks consumption among young school students of Bangladesh , considering target proportion as 50% since it maximizes the distribution. The formula for the cluster sampling design is given by- n = z2q/ pr2, where, n = the desired sample size, z = 1.96, p = 0.50, q = 0.50, r = the relative error of the estimate and the design effect= 1.55.16 Thus the calculated sample size was 600.
Data Collection Method
This study was carried out in classroom during a normal class period from randomly selected both boys and girls as targeted population. Two different sets of questionnaires were used (English and the native language- Bangla) and kept as simple as possible where a pre-arranged sequence was also maintained. The questionnaire was pretested to gather information on its understandability, time consumed by each question, consistency among related variables and acceptability. After pretesting, an interviewer-administered questionnaire was used for final data collection. The questionnaire included questions on socio-demographic characteristics, consumption of soft drinks and related risk elements including the anthropometric measurement of the students. The consumption of soft drinks was considered as never (not consumed during last 30 days) and regular (consumed at least 3 to 5 days/week).
Data were collected individually by four (4) data collectors. Extensive training was given to the collectors (such as student and teacher counselling, nutritional information, anthropometric measurement, and crosschecking of answers) for standardized data collection. Anthropometric measurements (height, weight, mid-upper arm circumference) were done using standard techniques.17 BMI of each participant was calculated as the ratio of the body weight to the square of body height (kg/m2) and graded in different grades of nutritional status according to CDC guideline.18
Operational Definitions
Soft drink: A “soft” drink is one that does not contain alcohol.
Juice: Any natural or artificially flavoured juice like apple juice, orange juice etc.
Cold drink: A “cold drink” is simply any soft drink in cold form. In Bangladeshi context usually this refers to carbonated, flavored drinks like Coca-Cola (Coke), Sprite, Fanta are usually referred to cold drinks.
Energy drink: An energy drink is a type of drink containing sugar and stimulant compounds.
Daily activities: Normally do in daily living including perform any activity (such as feeding, bathing, dressing, work, homemaking and leisure)
Sleep patterns: time and duration of sleeping time
Inability to cope with daily problems and activities: Reduced ability to do daily activities
Excessive complaints of physical ailments: Excessive worry over physical health and complains of pain.
Frequency to visit fast food restaurants: Categorized as; 1-3 times/week, 3-5 times/week, more than 5 times per week.
Regular consumption of soft drinks: Consume nonalcoholic beverages or any kind of soft drinks (carbonated drinks such as coke, sprite, fanta etc and energy Drinks- such as tiger, speed, power etc) almost every day
Ethical Issues
Before starting the data collection, the participants were briefly informed about the objectives of the research by the interviewers. A written informed consent was taken from the respondents before the interview and confidentiality maintained. Approval from National Research Ethics Committee under Bangladesh Medical Research Council (BMRC) was obtained to implement the study.
Statistical Analysis
Data editing was carried out by checking and verifying the completed questionnaire at the end of the interview, as well as at the end of survey and before the data analysis. The data analysis was performed using Statistical Package for Social Science (SPSS) version 20.0. Respondent’s socio-demographic characteristics were stated using descriptive statistics. Means, standard deviations, and proportions were generated to describe the overall sample characteristics (age, gender, living area, parent’s monthly income, and education), BMI, academic performance and different behavioral attitude of different consumer groups. The t-test and χ2–test were used to test the equality of means between genders and to find associations between regular consumers and non-consumers, respectively. Associations were considered significant at the alpha level of 0.05.
Results
Results shows that majority of the respondents (68%) belonged to 10-14 years of age group. Overall mean age was 12.51± (2.69) years. Half of the respondents (50%) belonged to class 6 to 8. About 49.5% respondents’ monthly family income was Bangladeshi Taka (BDT) 25001 to 50000 while only 14.5% had above one lac taka per month. (Table 1)
Table 1: Distribution of respondents by their demographic characteristics (n=600)
| Variables | Number (%) |
| Age (yrs.) | |
| < 10 | 90 (1.5) |
| 10 to 14 | 410 (68.3) |
| 15 & Above | 100 (16.7) |
| Age (mean ± SD) | 12.51±2.69 |
| Gender | |
| Boy | 300 (50) |
| Girl | 300 (50) |
| Education (on going, class) | |
| 1 to 5 | 116 (19.3) |
| 6 to 8 | 300 (50) |
| 9 to 10 | 184 (30.7) |
| Monthly family income (BDT) | |
| Up-to 25000 | 116 (19.3) |
| 25001 to 50000 | 297 (49.5) |
| 50001-100000 | 100 (16.7) |
| Above one lac | 87 (14.5) |
Table 2 shows that approximately half of the (48%) of the respondents consumed soft drinks on a regular basis. Results also indicated that most of the respondents (62.5%) preferred carbonated drinks alongside juice (27.7%) and energy drinks (7.8%). It indicates that carbonated soft drinks consumption is higher among school children.
Table 2: Pattern of natural or artificial soft drinks consumption among respondents (N=600)
| Variables | Number (%) |
| Consumed artificial color soft drinks | |
| Never | 312 (52.0) |
| 288 (48.0) | |
| Type of soft drinks consumed (n=288) | |
| Juice ( or Artificial flavored) | 166 (27.7) |
| Carbonated Drinks (Coke, Sprite, Fanta etc) | 375 (62.5) |
| Energy Drinks (Tiger, Speed, Power etc) | 46 (7.8) |
Distribution of respodents by who consumed soft drinks by gender is shown in Figure 1. The consumption was higher among girls (49%) compared to boys (30%).
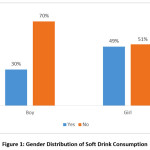 |
Figure 1: Gender Distribution of Soft Drink Consumption Click here to View figure |
Association between gender and their opinion on various factors that influenced consumption of soft drinks by school students were portrayed at Table 3. The factors such as the availability and accessibility of soft drinks (p<0.01), percentage of peer influence (p<0.01), lower price of soft drinks (p<0.01) and influence of advertisement (p<0.01) were significantly higher among girls compared to their counterparts.
Table 3: Factors influencing consumption artificial soft drinks (n=600)
| Statements on influencing factors | Gender | p-value | |
| Boy n (%) | Girl n (%) | ||
| Availability of artificial color soft drinks | 0.001 | ||
| Yes | 101 (33.7) | 165 (55) | |
| No | 199 (66.3) | 135 (45) | |
| Accessibility of artificial color soft drinks | 0.001 | ||
| Yes | 96 (32) | 158 (52.7) | |
| No | 204 (68) | 142 (47.3) | |
| Support from elderly people in the family | 0.704 | ||
| Yes | 130 (43.3) | 163 (54.3) | |
| No | 170 (56.7) | 137 (45.7) | |
| Peer Influence | 0.001 | ||
| Yes | 157 (52.3) | 197 (66) | |
| No | 143 (47.7) | 103 (34) | |
| Lower Price of soft drinks | 0.001 | ||
| Yes | 110 (36.7) | 187 (62.3) | |
| No | 190 (53.3) | 113 (37.7) | |
| Advertisement | 0.001 | ||
| Yes | 72 (24) | 154 (51) | |
| No | 228 (76) | 146 (49) | |
χ2 were calculated and p-values were considered at 5% significant level
The anthropometric measurements of consumer and non-consumers are shown in Table 4. Mean height of consumer and non-consumer was 149.5 cm and 159.3 cm respectively and found significantly (p<0.05). The mean weight of non-consumer was less as compared to consumer (37.39 kg and 47.7 kg, p<0.05). The mean BMI of regular consumer was 23.39±3.01 and non-consumer was 20.06±2.18 respectively (p<0.05).
Table 4 depicted that the percentage of academic performance was higher among never consumers compared to their counterparts. The regular consumption of soft drinks was significantly associated with poor academic performance (p<0.01), sleeping time hours (p<0.01), inability to cope with daily problem and activities (p<0.01), excessive complaints (p<0.01), skipping school (p<0.01), frequency to visit fast food restaurant (p<0.01) and screen time per day (p<0.01).
Table 4: Association between anthropometric and daily activities and consumption of soft drinks among school going children
| Characteristics | Regular Consumers n= 288 (%) | Never Consumers n= 312(%) | p value | |
| Anthropometric | Height(cm) | 149.5±11.47 | 159.3±15.09 | p<0.001p<0.001p<0.001 |
| Weight(kg) | 47.7±10.6 1 | 37.39±8.2 | ||
| BMI | 23.39±3.01 | 20.06±2.18 | ||
| Academic performance | less than 40% | 104 (36) | 37 (12) | p<0.001 |
| 40-60% | 177 (61) | 247 (79) | ||
| more than 60% | 7 (3) | 28 (9) | ||
| Sleeping time/day (hrs.) | ≤ 5 | 69 (24) | (2.1) | p<0.001 |
| 5-7 | 126 (43.8) | (59.4) | ||
| 7-10 | 88 (30.4) | (36.2) | ||
| ≥10 | 5 (1.8) | (2.3) | ||
| Inability to cope with daily problems and activities | Yes | 233 (81) | 67 (21.5) | p<0.001 |
| No | 53 (18.5) | 228 (73.2) | ||
| Do not know | 2 (0.5) | 17 (5.3) | ||
| Excessive complaints of physical ailments | Yes | 47 (16.5) | 63 (20.1) | p<0.001 |
| No | 241 (83.5) | 249 (79.9) | ||
| Skipping school | Yes | 42 (14.7) | 18 (5.7) | p<0.001 |
| No | 246 (85.3) | 294 (94.3) | ||
| Frequency to visit fast food restaurants | 2-3 times/week | 147 (51) | 7 (2.1) | p<0.001 |
| 1 times/ week | 95 (33) | 23 (7.3) | ||
| 1times/month | 46 (16) | 282 (90.6) | ||
| Screen time/day | More than 8 hours/day | 187 (65) | 122 (39) | p<0.001 |
| Less than 8 hours/day | 101 (35) | 190 (61) | ||
Discussion
The current study investigated the soft drink consumption and its influence on BMI and academic performance among selected school children in Dhaka City of Bangladesh. This study showed that about half of the respondents regularly consumed artificial soft drinks. Various studies reported that regular soda is the major type of drinks consumed particularly by adolescents.19 Most of them were consumed cold drinks as artificial color soft drinks.
In this study we observed that height, weight and BMI showed a significant association with the consumption of soft drinks. A study in India20 also found the significant association among height, weight and BMI with the consumption of soft drinks. Another study found a strong relationship between the consumption of soft drink and body weight with increasing the risk of obesity 1.6 times. According to the research findings reducing consumption of sugar-sweetened beverages helped in reduction of weight in the heavy teenager.21 Consumption of carbonated beverages was likely to be higher among the respondents who were unable to cope up with daily activities.
This present study showed a positive association between gender and soft drink consumption which is supported by the study of Foresheet RA and Story ML.22 On the contrary, a cross-sectional survey was conducted in eight European countries among 10 to 12 years children, where three family-related factors such as permissiveness, availability, and family consumption were found to be positively associated with children’s fruit drink/juice and soft drink intake.23 In our study, availability of soft drinks, support from elders and sibling and family members encouraging respondents to drink which influenced consumption of soft drinks. The study results also revealed that daily soft drinks consumption in children seems to be part of a complex configuration of unhealthy lifestyle behaviors. The study showed that there is a significant association between academic performance and consumption of soft drinks where annual academic performance was satisfactory among non- consumer than regular consumer. These findings are in line with another study conducted in India20
It is evident from the study results that the consumption of carbonated beverages is alarming among school children and higher among girls which are significant findings in the context of Bangladesh. The study did not include students from all types of schools.
Strengths and Limitations
This is the first study that we are aware of to compare relationships between soft drink consumption, and, its influence on BMI and academic performance among selected school children in Dhaka City of Bangladesh. However, there were some limitations to this study. First, the findings of this study may not be representative of all Bangladeshi children in general. This study was limited to Dhaka city; interviewing children from different cities might provide different findings on the consumption of soft drinks. Second, because of the cross-sectional design of the survey, implications regarding cause and effect are not possible. Longitudinal data are needed to study causal relationships and long-term consequences. Lastly, there are other factors that are important indicators of consumption of soft drinks, for example- snack consumption, television during meal that have not addressed in this study.
Conclusion
The overall consumption of soft drinks is increasing among school children. Its influence on increase of BMI and decrease of academic performance deserve due attention to prevent different non-communicable diseases. To limit the consumption of soft drinks among school children, coordinated educational campaigns are strongly recommended.
Acknowledgement
We are indebted to the parents of the young school children of the selected schools of Dhaka City who took part in the study. Special thanks to Research Assistants (data collectors) for their tremendous effort to collect quality data from the field.
Funding
Special thanks to the Bangladesh Medical Research Council (BMRC) for financial support to conduct this study under World Bank Research Program.
Conflict of Interest
The authors have no conflicts of interest to declare.
Reference
- Oxford Dictionaries English, 2017
- The Daily Star. May 17, 2019
- Unesda. (2017). Consumption -Unesda. [online] Available at: http://www.unesda.eu/products-ingredients/consumption/ [Accessed 25 Oct. 2017].
- Silva, G.M.S.W., U.L.R.R.W.P. Factors Associated with Soft Drink Consumption in Pre-school Aged Children in Sri Lanka. IJIRT. 2016; 3(7).
- News System (2011) Global soft drink consumption increases in 2010. http://www.ceepackaging.com/2011/08/09/globalsoft-drinks-consumption
- Jyothi, T.M., Research Article. Health risks of soft drinks-a review. Asian Jour of Sci and Tech. 2016; 7(6):3059-3064.
- Vartanian, L.R., M.B. Schwartz, K.D. Brownell. Effects of soft drink consumption on nutrition and health: a systematic review and meta-analysis. Ame jour of pub heal. 2007; 97(4): 667-675.
- Chandro, Nagaraja S. T. A food poisoning outbreak with chemical dye–an investigation report. Med Jour of Arm For Ind. 1987; 43:291-293.
- Power, J., et al. Lead poisoning in Gurkha soldiers in Hong Kong. Br Med J. 1969; 3(5666):336-337.
- Sachdeva, S., et al. Acquired toxic methaemoglobinaemia. The Jour of the Asso of Phy of Ind. 1992; 40(4):239-240.
- Guthrie, Morton J.F. Food sources of added sweeteners in the diets of Americans. Jour of the Ame Diet Asso. 2000; 100(1):43-51.
- Ballew C, K.S., Gillespie C, Beverage chices affect adewuacy of childrens nutritional intake. Arch Pediatr Adoles Med. 2000; 154:1148-1152.
- Johnson, Frary R.K. and C. Choose beverages and foods to moderate your intake of sugars: the 2000 dietary guidelines for Americans—what’s all the fuss about? The Jour of nutri. 2001; 131(10):2766S-2771S.
- Harnack, L., Stang J, Story M. Soft drink consumption among US children and adolescents: nutritional consequences. Jour of the Ame Diet Asso. 1999; 99(4):436-441.
- Author(s). Soda Companies Turning to Low- and Middle-Income Countries to Replace Sagging U.S. Soda Sales. “Carbonating the World” Tracks Soda Industry in Big Tobacco’s Global Footprints. Centre for Science in the Public Interest. https://cspinet.org/new/201602091.html. Published date. Accessed on 01 October 2019.
- Sample size and design effect- OIT Web Services. http://faculty.smu.edu/slstokes/stat6380/deff%20doc.pdf
- Jaswant S, Nitish M. Use of Upper-Arm Anthropometry as Measure of Body-Composition and Nutritional Assessment in Children and Adolescents (6–20 Years) of Assam, Northeast India. Ethiopian Journal of Health Sciences. 2014; 24(3): 243-252
- Centers for Disease Control and Prevention (CDC). Assessing Your Weight. https:// www.cdc.gov/healthyweight/assessing/ (accessed June 2016)
- Wang, Y. C., Bleich S.N, Gortmaker S.L. Increasing caloric contribution from sugar-sweetened beverages and 100% fruit juices among US children and adolescents, 1988–2004. Pediatri. 2008; 121(6):e1604-e1614.
- Arora T., Anand K. A study on effect of consumption of carbonated beverages on nutritional status and academic performance among school going children (13-17 years). Int Jour of Food and Nutr Sci. 2014; 3(4):119-124.
- Bhuvaneswari J. Nazni P. Impact of breakfast bar supplementation on nutritional and academic performance of adolescence. Int Jour of Dev Res. 2011;1(3):018-021.
- Forshee, Storey R. A. and M.L. Total beverage consumption and beverage choices among children and adolescents. Int Jour of Food Sci and Nutr. 2003; 54(4):297-307.
- Lippevelde V., W., et al. Associations between home-and family-related factors and fruit juice and soft drink intake among 10-to 12-year old children. The ENERGY project. Appeti. 2013; 61:59-65.
Scopus Citation(s): 6
Accepted on: 17/12/2019
Second Review by: Dr. Erik Albert Karlsson Cambodia
Final Approval by: Prof. Suhad Maatoug Bahijri


Web of Science Coverage
Emerging Sources Citation Index (ESCI)
2024 Journal Impact Factor: 1.1
Scopus Journal Metrics
CiteScore 2025: 2.6
CiteScore Details
Sustainable Nutrition: Food Systems, Nutrient Retention, and Public Health Impact
![]()
This journal is a member of, and subscribes to the principles of, the Committee on Publication Ethics (COPE)


