Significance of Health Related Predictors of Diabetes in Pima Indians Women
Ilham A Bashir1*
, Rasitha Banu4, Tahani Babiker Elyas4 1Jazan University – Faculty of Public and Tropical Medicine – Kingdom of Saudi Arabia.
2Indeginous Knowledge and Heritage Centre, Ghibaish College of Science and Technology, Ghibaish, Sudan.
3Department of Biology, College of Science and Arts, University of Jeddah, Alkamil, KSA.
4Jazan University – Faculty of Public and Tropical Medicine – Kingdom of Saudi Arabia.
Corresponding Author Email: ilhambashier@gmail.com
DOI : http://dx.doi.org/10.12944/CRNFSJ.7.2.05
Download this article as:
![]()
This study was carried out to investigate the significance of health-related predictors of diabetes in Pima Indians Women. The study population was the females 21 years and above of Pima Indian heritage patients of diabetes and digestive and kidney diseases. The research question was: what are the health predictions that associated with the presence of diabetes in Pima Indians? The study aimed at testing the significance of health-related predictors of diabetes in Pima Indians women. That was according to World Health Organization criteria (i.e. if the 2-hour post-load plasma glucose was at least 200 mg/dl at any survey examination or if found during routine medical care). A total of 768 women were registered in the database. (268:35%) were having diabetes, while (500:65%) were not. The average number of pregnancies was higher (4.9) in diabetic in comparing to (3.3) in non-diabetic women with a significant difference (P < 0.05) between them. Significant (P < 0.05) positive correlation (41.7) was found between plasma level and occurrence of diabetes and that patients with a normal range of plasma level were at higher risk of being diabetic. OR = 2.479, [95% CI =1.999, 3.073], P=0.00. The Body Mass Index (BMI) showed a significant association (P < 0.05) with the occurrence of diabetes and that even the normal weighted women were at almost 8 times risk of being diabetic in comparison to the overweight, OR = 7.876, [95% CI= 3.557, 17.439]; P=0.00. Significant inverse relation (P < 0.05) was seen between the age distribution and diabetic occurrence. Women at age group < 25 years were at higher risk to contract diabetes in comparison to the older age group. OR = 6.616, [CI= 4.145, 10.561], P=0.00. The study concluded that the genetic component is likely to contribute more to the emergence of diabetes in the Pima Indians and their offspring. The study recommended that there should be more preventive input and periodic follow-up especially during pregnancy in this ethnic group to reduce the risk and complications of type II diabetes. Besides, the provision of intervention for weight reduction.
KEYWORDS:Body Mass Index (BMI); Obesity; Pima Indians; Plasma Level; Type II Diabetes
Introduction
Diabetes is a group of metabolic diseases that have high levels of sugar in the blood over a long period of time, so it is known as a chronic illness.1 Glucose enters the body through the intestines treated by the patient, and here comes the role of insulin which is a hormone that helps glucose to enter the cells to give energy. In the case of type II, the most common, the body may also not be able to produce insulin or may be able to produce enough or the body may not be able to use the amount produced from it, thus remains glucose in the blood. There is also a rise in glucose in pre-diabetes. This means that blood sugar is above normal but not too high to name diabetes. Prevalence of glycoside increases the risk of type 2 diabetes. Gestational diabetes develops during pregnancy (gestation). Like other types of diabetes, gestational diabetes affects how the cells use sugar (glucose). Gestational diabetes causes high blood sugar that can affect the pregnancy and the baby’s health.2 Results indicate that the highest prevalence of diabetes is found in high rates in Indian Pima, and this is shown by comparing natural groups with hyperglycemic on the basis of the relative distribution of glucose levels after pregnancy for two hours.2 Pregnant women are more susceptible to this type. An A1C test is a blood test that reflects the average blood glucose levels over the past 3 months.4 The A1C test is sometimes called the hemoglobin A1C; Hemoglobin is the part of a red blood cell that carries oxygen to the cells.5 Blood glucose levels should be monitored if the drug is prescribed. Diabetes is quite prevalent in a group of Native Americans living in Arizona (US) and Sonora (Mexico). The aim of this study is to study the cause of diabetes in this ethnic group. Diabetes was uncommon in Pima Indians until the second half of the 20th century. As King et al., report. In 1993, the highest prevalence of type 2 diabetes (NIDDM) in the world was found in Pima Indians living in Arizona.4 In 1990, Knowler et al., reported that more than half of the 35-year-olds suffer from this disease.5 This phenomenon has been studied for more than 30 years by Scientists from the National Institutes of Health (NIH) studied. Most of the results indicate that both acquired (environmental) and family (genetic) factors play a critical role in causing type 2 diabetes (NIDDM) in this population.8 Knowler WC, Saad MF et al., reported that the disease complications in this group are disruptive or fatal and will benefit from continued research on causing disease and preventing disease.9 One of the aims of this study that was conducted in the year 1998 was to measure the appearance in the subsequent generation of mothers with pregnant diabetes. A 75 mg oral glucose tolerance test was administered to women during each pregnancy. Their children since the age of five years were followed every two years with a standardized examination includes measurements of height and weight and test the measurement of glucose oral 75 grams standard taken in the morning after the fast overnight. Having diabetes while being pregnant, is the main risk issue for the onset of diabetes and high blood sugar in the new generation. In the following cohort, diabetes was not quite apparent in breastfed infants than in non- diabetic women (6.9%) than in those who had diabetes (30.1%).10 Subsequent studies showed that Pima Indians had high insulin and insulin resistance comparisond to other ethnic groups and that people with diabetes, even those at an early age did not appear antibodies to anti-toxin cells.9 Thus, in Pimas, almost all patients with diabetes can be classified as NIDDM patients. The later studies concluded the high prevalence of diabetes in the Pimas for other populations and the knowledge of the disease and its originates strongly suggest a significant genetic basis. Future progress in the study of the genetics of NIDDM and other complex diseases will not only come from technical progress being developed, but also from advances in understanding the path physiology of the disease and the role of genetic interactions and the renewed emphasis on accurate clinical characterization of the subjects involved in these studies.12 Further studies reported increasing Gestational diabetes (GDM) in PIMA women where those without diabetes develop high blood sugar levels during pregnancy. GDM prevalence suggests that diabetes in pregnancy initially described in Pima Indians may also be occurring in the same pattern in other U.S. ethnic groups.12 Obesity was also seen to be high in Pima Indians population, average body mass index was higher in young people according to BMI estimates and there have been modest increases in BMI averages for age and sex over the last 25 years. These observations indicate that older people were less likely to be exposed to factors leading to obesity than younger adults. People with diabetes rarely have a tendency to lose weight. So obesity should not be studied in these populations without also considering diabetes, which tends to reduce the degree of obesity.14 Others concluded that diabetes during pregnancy, in addition to what could affect the new baby, had subsequent effects on growth and on glucose metabolism in future generations. These effects are due to genetic traits as well.15 A study, carried from 1982 through 1992, in 200 healthy, non-diabetic Pima Indians, including 87 women and 113 men, showed that the etiologic factors for NIDDM in Pima Indians are likely to be similar to that of other racial groups but the genes that determine susceptibility to the disease are more common in Pimas.16
Methods and materials
The data were obtained from the National Institute of Diabetes and Digestive and Kidney Diseases. The donor of the database was Vincent Sigillito (vgs@aplcen.apl.jhu.edu), Research Center, RMI Group Leader, Applied Physics Laboratory, The Johns Hopkins University, Johns Hopkins Road, Laurel, MD 20707, (301) 953-6231, and 9th May 1990.16
The scope of this study was sought from the cross-sectional retrospective study database of the conducted On May 9th 1990 carried by the National Institute of Diabetes and Digestive and Kidney Diseases. The Study Population was all females at least 21 years old of Pima Indian heritage patients of Diabetes and Digestive and Kidney Diseases. Sample size: A total of 768Patient women were investigated and classifies as 500 not having diabetes while a total of 268 patients were diabetics.The diagnostic was of binary-valued variable investigating whether the patient shows signs of diabetes according to World Health Organization criteria (i.e., if the 2-hour post-load plasma glucose was at least 200 mg/dl at any survey examination or if found during routine medical care).
The Main study variables
8 predictive variables and a response variable. The variables were age, ever pregnant, number of pregnancies, 2 hour serum insulin (mu U/ml), Body Mass Index (BMI) (weight in kg/(height in m)^2, diastolic blood pressure (mm Hg) (BP), plasma glucose concentration a 2-hour glucose tolerance test and triceps skin-fold thickness (mm). A value used to estimate body fat, measured on the right arm halfway between the olecranon process of the elbow and the acromial process of the scapula[i]. The PEDIGREE predictor was excluded from the analysis.
Missing Attribute Values
The missing values were replaced by the mean value of the intended variable (after controlling the number of missing values).
Data analysis and presentation
This data was re-analyzed to identify the causes and risk predictive factors associated with type II diabetes in PIMA women using the Statistical Package of Social Science SPSS program. Descriptive analysis, odds ratios, and regression analysis were produced with the use of the SPSS computer programme. Graphic presentations of the findings were produced with the use of the Excel Microsoft Office software.
Results
Results showed that a total of 768 women were registered in the database. (268:35%) were having diabetes, while (500:65 %) don’t. The average number of pregnancies was significantly (P <0.05) higher (4.9) in diabetic in comparison to (3.3) in non-diabetic women.
Table 1: Significance of Predictive Instances Associated with Diabetes in the Pima Indians Women.
| Predictive Instances | Indicators | Non -diabetic | % | Diabetic | % | Total | % | P value |
| 1-Age group | < 25 years | 188 | 37.6 | 31 | 11.6 | 219 | 28.5 | P< 0.05 |
| 25 < 30 years | 124 | 24.8 | 53 | 19.8 | 177 | 23.0 | ||
| 30<35 | 50 | 10 | 42 | 15.7 | 92 | 12.0 | ||
| 35<40 | 39 | 7.8 | 34 | 12.7 | 73 | 9.5 | ||
| >40 | 99 | 19.8 | 108 | 40.3 | 207 | 27.0 | ||
| Total | 500 | 100 | 268 | 100.0 | 768 | 100.0 | ||
| 2-Ever Pregnant | Yes | 427 | 85.4 | 230 | 85.8 | 657 | 85.5 | P>0.05 |
| No | 73 | 14.6 | 38 | 14.2 | 111 | 14.5 | ||
| Total | 500 | 100 | 268 | 100.0 | 768 | 100 | ||
| 3-No.of pregnancies | 0-No pregnancy | 73 | 14.6 | 38 | 14.2 | 111 | 14.5 | P<0.05 |
| 1-3 pregnancies | 238 | 47.6 | 75 | 28.0 | 313 | 40.8 | ||
| 4-6 pregnancies | 115 | 23 | 60 | 22.4 | 175 | 22.8 | ||
| 6+ pregnancies | 74 | 14.8 | 95 | 35.4 | 169 | 22.0 | ||
| Total | 500 | 100 | 268 | 14.2 | 768 | 100.0 | ||
| (200+ mg/dL) | 42 | 8.4 | 47 | 17.5 | 89 | 11.6 | ||
| 4-InsulinLevel | (<200 mg/dL). | 458 | 91.6 | 221 | 82.5 | 679 | 88.4 | P<0.05 |
| Total | 500 | 100 | 268 | 100.0 | 768 | 100.0 | ||
| 5-Body Mass Index | Normal | 108 | 21.6 | 7 | 2.6 | 115 | 15.0 | P<0.05 |
| Overweight | 239 | 47.8 | 122 | 45.5 | 361 | 47.0 | ||
| Obese | 153 | 30.6 | 139 | 51.9 | 292 | 38.0 | ||
| Total | 500 | 100 | 268 | 100.0 | 768 | 100.0 | ||
| 6- Blood Pressure | Hypotension and low normal (<65) | 155 | 31 | 46 | 17.2 | 201 | 26.2 | P<0.05 |
| Normal (65-85) | 288 | 57.6 | 173 | 64.6 | 461 | 60.0 | ||
| Hypertension Stage (85+) | 57 | 11.4 | 49 | 18.3 | 106 | 13.8 | ||
| Total | 500 | 100 | 268 | 100.0 | 768 | 100.0 | ||
| 2-hour plasma glucose concentration | Normal ( lower than 140 mg/dL) | 438 | 87.6 | 131 | 48.9 | 569 | 74.1 | P<0.05 |
| Impaired tolerance (140 and 199 mg/dL ) | 62 | 12.4 | 137 | 51.1 | 199 | 25.9 | ||
| Total | 500 | 100 | 268 | 100.0 | 768 | 100.0 | ||
| 8- Triceps skin-fold thickness | < 20 mm | 235 | 47 | 103 | 38.4 | 338 | 44.0 | P<0.05 |
| 20 < 40 mm (Normal range) | 217 | 43.4 | 123 | 45.9 | 340 | 44.3 | ||
| 40+ mm | 48 | 9.6 | 42 | 15.7 | 90 | 11.7 | ||
| Total | 500 | 100 | 268 | 100.0 | 768 | 100.0 |
1- Age group
The age < 25 years constituted 188 (37.6%) of non-diabetic while 31 (11.6%) of diabetic Pima women. As for the older age group (>40 years); it constituted 99 (19.8%) of the non-diabetics while 108 (40.3%) of diabetic women. Significant inverse relation (P<0.05) was seen between the age distribution and diabetic occurrence. Figure (1) shows that reverse relation where the younger the age group the higher percent of those having diabetics while decreased with the age mounting.
2-Ever got pregnant
Table (1) shows that a total of 427 (85.4%) non-diabetic were got pregnant at least one time while 230 (85.8%) of diabetic. pregnancy shows no significant effect (P>0.05) on diabetes occurrence;
3- Number of children
Table (1) shows that 74 (21.6%) of non-diabetic were got pregnant more than 6 times while 95(35.4%) of the diabetics. The number of children is significantly (P<0.05) vary between diabetic and non-diabetic women. Figure (2) illustrates that variation in the number of children in them.
4-Insulin Level
The average level of insulin was (142.4mg/dl- SD = 75.5) in non-diabetic while (180.7mg/dl – SD= 95.7) in diabetic women. Insulin level (200 + mg/dL) is significantly (P<0.05) higher in diabetic 47(17.7%) in comparison to non-diabetic women 42(8.3%). Figure (3) illustrates the difference in insulin levels between diabetic and non-diabetic women.
5-Body Mass Index
Table (1) shows that the body mass index is significantly (P<0.05) vary between the diabetics and non-diabetics. The percent of obese diabetics was 139 (51.9%) while 153 (30.6%) in non-diabetic women. Figure (4) illustrates the difference in body mass index (BMI) in the diabetics and non-diabetics.
6- Diastolic Blood Pressure
Table (1) shows that diastolic blood pressure is significantly (P<0.05) vary between the diabetics and non-diabetic women. A total of 49 (18.3%) diabetic shows diastolic blood pressure (85+) in comparison to non-diabetic women were 57 (11.4%) of non-diabetic. Figure (5) illustrates the difference in diastolic pressure between diabetics and non-diabetics.
7- Plasma glucose concentration
The mean range of the 2-hours fasting was (112.1 mg/dL , SD = 21.4 ) in the normal level reading women while (175 mg/dL, SD = 12.6) in women of out of normal range plasma level. Table (1) shows that the plasma range significantly differs (P< 0.05) between the diabetic and non-diabetic women; plasma normal range was seen in 477 (95.4%) of non-diabetic while in 172 (64.2%) of the diabetic women. Figure (6) illustrates the difference between plasma levels in diabetics and non-diabetics.
8-Triceps skin-fold thickness
Table (1) shows that the triceps skin-fold thickness is significantly (P<0.05) differ between diabetic and non-diabetic women. The skin thickness 40+ mm was seen in 48 (9.6%) non- diabetic w48 (9.6%) non- diabetic while in 42 (15.7%) of diabetic women. Figure (7)
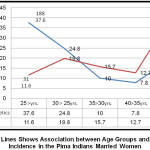 |
Figure 1: Lines Shows Association between Age Groups and Diabetes Incidence in the Pima Indians Married Women Click here to View figure |
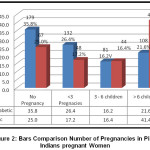 |
Figure 2: Bars Comparison Number of Pregnancies in Pima Indians pregnant Women Click here to View figure |
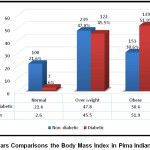 |
Figure 3: Bars Comparisons the Body Mass Index in Pima Indians Women Click here to View figure |
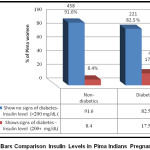 |
Figure 4: Bars Comparison Insulin Levels in Pima Indians Pregnant Women Click here to View figure |
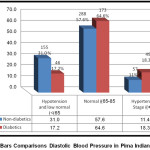 |
Figure 5: Bars Comparisons Diastolic Blood Pressure in Pima Indians Women Click here to View figure |
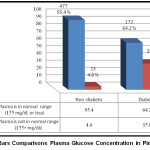 |
Figure 6: Bars Comparisons Plasma Glucose Concentration in Pima Women Click here to View figure |
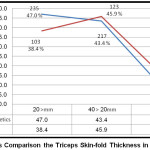 |
Figure 7: Bars Comparison the Triceps Skin-fold Thickness in Pima Women Click here to View figure |
Table 2: Risk Estimate – Multiple Logistic Regression Model and Odd Ratio of Diabetes in Pima Women.
| Dependent variable Independent variables |
95% Confidence Interval for Exp. (B) | ||||||
| Contracting Diabetes | Risk estimate | ||||||
| Indicators | B | Exp (B) | Lower Bound | Upper Bound | |||
| Age group | >40 years | 1 | 1 | Reference | |||
| < 25 years | -1.248- | 6.616 | 4.145 | 10.561 | 0.000 | ||
| 25 < 30 years | -.712- | 2.552 | 1.674 | 3.891 | 0.000 | ||
| 30<35 | -.944- | 1.299 | 0.794 | 2.125 | 0.000 | ||
| 35<40 | -1.156- | 1.251 | 0.733 | 2.136 | 0.000 | ||
| Ever pregnant | Ever pregnant | .995 | .9370 | 1.057 | 0.483 | ||
| Never pregnant | 1.030 | 0716 | 1.480 | ||||
| No. of pregnancies | 0-No pregnancy | 1 | 1 | Reference | |||
| 1-3 pregnancies | 0.68 | 1.652 | 1.032 | 2.643 | 0.001 | ||
| 4-6 pregnancies | 0.457 | 0.998 | 0.604 | 1.647 | 0.028 | ||
| 6+ pregnancies | 0.916 | 0.405 | 0.247 | 0.666 | 0.000 | ||
| Insulin level | Insulin level (200+ mg/dL) | 1.458 | 1 | Reference | |||
| Insulin level (<200 mg/dL) | .841 | 2.319 | 1.485 | 3.623 | 0.000 | ||
| Body Mass Index | Overweight | 1 | 1 | Reference | |||
| Normal | -2.858- | 7.876 | 3.557 | 17.439 | 0.000 | ||
| Obese | 0.13 | 0.562 | 0.409 | 0.771 | 0.293 | ||
| Hypertension | Hypertension | 1 | 1 | Reference | |||
| Hypotension and low normal | -1.325 | 2.897 | 1.75 | 4.795 | 0.000 | ||
| Normal | -1.261 | 1.431 | 0.935 | 2.191 | 0.000 | ||
| 2-hours blood glucose level | Impaired glucose tolerance (140 – 199 mg/dL ) | 1 | 1 | Reference | |||
| Normal ( lower than 140 mg/dL) | -.045- | 7.388 | 5.165 | 10.567 | 0.000 | ||
| Triceps skin-fold thickness | 20 < 40 mm (Normal) | 1 | 1 | Reference | |||
| < 20 mm | -.177- | 1.293 | 0.939 | 1.781 | 0.184 | ||
| 40+ mm | -1.075- | 0.648 | 0.405 | 1.036 | 0.000 | ||
Table (2) shows that the risk of diabetes is increased in younger age groups. The (OR = 6.616, [ 95% CI= 4.145, 10.561)] in age group < 25 years shows higher risk to contract diabetes in comparison to the older age groups. Non-pregnancy could act as a protective factor for getting diabetes. (OR= 0.988, [ 95% CI = 0.854, 1,143)]. It also shows that women get through 1 to 3 pregnancies were at higher risk of contracting diabetes (OR=1.652, [95% CI = 1.032, 2.643)] of contracting diabetes. Women with insulin level (<200 mg / dL) showed a significant risk ratio of being diabetic in comparison to women who had insulin level (200+ mg / dL). (OR=2.319, [95% CI = 1.485, 3.623)]. The normal weighted women were at almost 8 times risk of being diabetic in comparison to overweight (OR = 7.876, CI= 3.557, 17.439). Women with hypotension and low normal diastolic blood pressure are of almost at 3 times the risk of being diabetic in comparison to women with hypertension (OR=2.897,[95% CI=1.75, 4.795]). Women who showed normal glucose level for the 2-hour glucose test have about 7 times the probability of developing diabetes in comparison to those who showed impaired glucose tolerance. Women of <20mm skin-fold showed significant higher odds (OR=1.3 [95% CI=0.939, 1.781]) in comparison to those of normal range (20 < 40 mm. The thing that implies this group was at a higher risk of contracting diabetes.
Discussion
Bennett, et al., (1971) concluded that the use of traditional conservative criteria pointed out that 50% prevalence of diabetes in the aged 35 years and above. However, our study showed that younger women <25 years had a 6.6-fold risk of developing diabetes comparison with older age groups. In parallel with Pettitt, D. J., et al., (1998), a paper on the long-term effects of the intrauterine environment, birth weight, and breastfeeding in Pima Indians revealed that diabetes during pregnancy is a major risk factor for diabetes and high blood sugar In offspring. And that the baby of a woman with diabetes during pregnancy is at risk of obesity and the development of type 2 diabetes at an early age. This could be supported by the result of this study, which showed that women who had a 1 to 3 pregnancy were at 1.7 times likely to develop diabetes in comparison to those not being pregnant. Heredity in relation to diabetes onset was reported by Knowler, et al., they reported the obesity in the Pima Indians: its magnitude and relationship with diabetes, Besides, Pratley, et al., (1998) reported Gene-environment interactions in the pathogenesis of type 2 diabetes mellitus they reported that obesity is more common in both males and females in Pima Indians than in the population of the United States1980s in comparison to the 70s, suggesting that family obesity has an effect on the obesity of subsequent generations and hence may be associated with the onset of diabetes and gestational diabetes. These findings supporting the findings of this study that the normal weight of women was at risk of contracting diabetes approximately 8 times higher than the overweight women. In this case, the genetic factor may be more pronounced than other factors in the occurrence of diabetes. Lillioja, et al., in their study about Insulin resistance and insulin secretion dysfunction Pima Indians Their study resulted in the appearance of diabetes in 38 males and females subjects followed for 5.3 years. They concluded that Insulin resistance is a major risk factor for the development of NIDDM. Low acute insulin response to glucose. That support the findings of this study that even the women who showed normal glucose level for the 2-hour glucose test have about 7 times the risk of developing diabetes in comparison to those who showed impaired glucose tolerance.
Conclusion
This study concluded that Pima women even being in younger age, with normal body weight, having a fewer number of children and with hypotension, low or normal diastolic blood pressure were at higher risk for contracting diabetes in comparison to the older age, overweight, with more number of children and hypertensive women. Hence, hereditary in more likely to contribute to diabetes onset in the Pimas offspring generation.
Recommendation
- Early diagnosis through relatively inexpensive calculation methods.
- Continuing genetic research to prevent disease and reduce its complications. Especially the gestational diabetes.
- Control of gestational diabetes to avoid complications of fetal uterine growth.
- Use of automated learning, artificial intelligence branch to analyze and predict a predictive diabetes model.
- To detect more diabetes algorithms in the Indian Pima population .
Acknowledgement
Here, the study groups are acknowledging the donor of the database Vincent Sigillito (vgs@aplcen.apl.jhu.edu), Research Center, RMI Group Leader, Applied Physics Laboratory, The Johns Hopkins University, Johns Hopkins as well as the UCI Machine Learning Repository for maintaining data sets as a service to the machine learning community. Availing of data on the web has made it easier to analyze and know more about the prevalence of diabetes in different groups.
Conflict of Interest
The author(s) declare no conflict on interest.
References
- About diabetes". World Health Organization. Archived from the original on 31 March 2014. Retrieved 4 April 2014.
- Gestational diabetes https://www.mayoclinic.org/diseases-conditions/gestational-diabetes/symptoms-causes/syc-20355339
- Bennett, P., Burch, T., & Miller, M. (1971). Diabetes mellitus in American (Pima) Indians. The Lancet, 298(7716), 125-128.
CrossRef - What Does A1C Stand For https://www.diabetesselfmanagement.com/blog/what-does-a1c-stand-for/
- The A1C Test & Diabetes https://www.niddk.nih.gov/healthinformation/diabetes/overview/tests-diagnosis/a1c-test
- King H & Rewers M for the WHO Ad HOC Diabetes Reporting Committee (1993) Global estimates for the prevalence of diabetes mellitus and impaired glucose tolerance in adults. Diabetes Care 16, 157-177
CrossRef - Knowler, W. C., Pettitt, D. J., Saad, M. F., & Bennett, P. H. (1990). Diabetes mellitus in the Pima Indians: incidence, risk factors and pathogenesis. Diabetes/metabolism reviews, 6(1), 1-27.
CrossRef - Pima Indians Diabetes Database https://raw.githubusercontent.com/jbrownlee/Datasets/master/pima-indians-diabetes.names
- Knowler WC, Saad MF, Pettitt DJ, Nelson RG, Bennett PH. Determinants of diabetes mellitus in the Pima Indians. Diabetes Care. 1993;16:216-227.
CrossRef - Pima Indians Diabetes Database-Predict the onset of diabetes based on diagnostic measures https://www.kaggle.com/uciml/pima-indians-diabetes-database
Accepted on: 28-05-2019
Second Review by: Dr. Siva Rami Reddy E India
Final Approval by: Prof. Min-Hsiung Pan


Web of Science Coverage
Emerging Sources Citation Index (ESCI)
2024 Journal Impact Factor: 1.1
Scopus Journal Metrics
CiteScore 2025: 2.6
CiteScore Details
Sustainable Nutrition: Food Systems, Nutrient Retention, and Public Health Impact
![]()
This journal is a member of, and subscribes to the principles of, the Committee on Publication Ethics (COPE)


