Nutritional composition, sensory evaluation and Halal perspective African Catfish (Clarias gariepinus) fed with diets containing najasa (impurities)

1Fisheries Research Institute, Batu Maung, Penang, Malaysia.
2Fisheries Biosecurity Lab, Lot 82, Jalan Caruthers, off Jalan Sultan Salahuddin, Kuala Lumpur, Malaysia.
3Faculty of Social Sciences, University College Bestari, Bandar Permaisuri, Setiu, Terengganu Darul Iman, Malaysia.
4Faculty of Food Science and Nutrition, Universiti Malaysia Sabah, Kota Kinabalu, Sabah, Malaysia.
Corresponding Author Email: drnurulhuda@ums.edu.my
DOI : http://dx.doi.org/10.12944/CRNFSJ.7.2.13
Download this article as:
![]()
Lately, Muslim consumers in Malaysia, are avoiding catfish (Clarias gariepinus) owing to the uncertainty of its halal status. This is due to the use of unclean/impure substances (najasa in Islamic law) as feed from animal carcasses or feed incorporated with animal waste (fat, blood or bone). Under the islamic law, animals which consume large quantities of najasa and led to noticeable changes of its odour, colour and taste of the meat are haram (forbidden) or makruh (undesirable). To our knowledge there is no investigation on whether the feed could alter the odour, taste or colour of the catfish from this perspective. Thus a study was undertaken to evaluate if feeding diets comprising of najasa will affect the nutritional composition and sensory characteristics of catfish.The fish were fed with imported pellets (consisting of 10-15% blood meal with porcine DNA detected), local pellets and 100% chicken offal for 12 weeks. The results showed treatment with imported pellets do not have a significant (p < 0.05) effect on the nutritional composition (proximate composition, amino acids and fatty acids profiles), colour, odour and flavour of catfish fillet, but significantly (p < 0.05) change the odour and flavour.
KEYWORDS:Catfish; Colour; Feed; Halal; Nutritional Composition; Sensory Evaluation
Introduction
African catfish (Clarias gariepinus), which in Malaysia locally known as ikan keli is one of the most popular fish species cultured, with approximately 36,534 metric tonnes produced in 2016.1 It is among the cheapest fish, fetching a retail price of as low as USD 2.00/kg (about RM 8/kg). Catfish used to have high demand in Malaysia, however lately, the Muslim consumers, are avoiding catfish due to its doubtful halal status. This is due to the professed feeding of catfish with carcases or wastes from pig or commercial feeds mixed with pig by-products (meat, fat, blood, or bone). Pig (Sus sp.) and its by-products are forbidden in Muslim consumer products as mentioned in the Quran Al-Baqarah verse 173, Al-Maidah verse 3 and Al-Nahl verse 115.
From the avalaible reports, we could say that the allegation has some basis. Local newspapers have reported on catfish being fed with wastes from poultry, cattle or pig industry and carcasses of animals. The practice of feeding catfish with intestine of pig had been reported in Thailand2 and Taiwan3 while the use of re-cycled dead chicken had been described in Africa.4 In addition, fish feed industries are using alternative protein including animal by-products (meat and bone meal, blood meal) and alternative fats such as lard in fish feed to overcome the insufficient quantity of fishmeal at economical prices.5 The results from the DOF, Malaysia monitoring program of fish feed have showed positive presence of porcine DNA in some of the imported and locally produced fish feed.1
Under the islamic regulation, otherwise halal animal, which consume najasa in quantities greater than the quantity of clean food resulting in noticeable changes in its odour, colour and the taste of the meat are known as al-jallālah.6,7 Najasa refers to unclean or impure substances including faecal materials, blood, carcasses, pigs and any of its derivatives. The islamic regulation prohibits the consumption of product of al-jallālah animals. The jurists however have differing opinions on the strength of this prohibition. Some of the islamic jurists from the Syafi’e (as applied in Malaysia) and Ahmad school of thoughts prohibit the consumption of al-jallālah8,9 while scholars of the Maliki and Hanafi schools of thoughts render the prohibition as mild and only makruh (undesirable). In contrast, animals that eat filth or impurities in small quantities and do not experience physical changes in color or smell remain halal.
Based on the explanation above, the African catfish could be categorised as al-jallālah based on its dietary habits but the changes in its odour, colour and the taste of the fish due to eating najasa have never been described. A study is needed to verify whether feeding with diets containing najasa will affect the taste, odour or colour of the catfish. Thus the study was carried out to determine the effects of feeding three different diets (imported pellets mixed with 10-15% porcine blood meal; locally produced pellets; fresh chicken offal) commonly used by the local farmers on the nutritional compositions (proximate, amino acid and fatty acid profiles), colour (lightness, yellowness and redness) and the sensory attributes (with focus on taste, odour and colour) of the catfish fillet. The results of this study is expected to appease the Muslim consumers’ uncertainties, provide them with informed choices and avoid unnecessary deprivation of a relatively cheap protein source.
Materials and Methods
Fish, Rearing Facility and Diets
Juvenile African catfish (mean length ~ 4.00 cm) were obtained from a private hatchery in Kepala Batas Penang, Malaysia. After transportation to the Fisheries Research Institute, Batu Maung, Penang, the fish were acclimatised to the new environmental conditions for a week, during which they were fed a commercial diet used in the farm.
White rectangular fiberglass tanks (L=2 m, W=0.5 m, D=1.0 m) were used for the experiment. The tanks were exposed to natural daylight and were partly covered with a polyethylene net to reduce natural light intensity. The water temperature in the tanks ranged from 27.0-32.5˚C throughout the experiment. For each treatment, triplicate groups of about 400 juveniles (mean initial body weight: 4.7 ± 2.1 g) were distributed in three tanks, providing a fish density of around 140 fish/m3. The fish were hand-fed with three different diets twice daily at 08 am and 08 pm for 12 weeks. Grading was carried out every three weeks to remove the bigger sized fish in each tank to avoid cannibalism.
Three types of feeds were used in this study; imported pellets (claimed to consist of 10-15% porcine blood meal), locally produced catfish pellets and fresh chicken offal either obtained free or bought at less than USD 0.10/kg (RM 0.42/kg) daily from a wet market. The chicken offal used in this study were not cleaned prior to feeding and comprised mainly of chicken intestine, fat, skin, head and feet. The intestines also contained faecal materials. The ingredients of the commercial diet were not revealed by the manufacturer except for the crude composition displayed on the packaging. The diets used in this experiment were analysed for protein, crude fat, carbohydrate, moisture, ash, crude fibre and the results are presented in Table 1.
Table 1: Proximate composition of the three diets used in this study
| Imported feed | Local feed | Chicken offal | |
| Crude Protein (g 100g-1) | 45.75 | 30.55 | 4.26 |
| Fat (g 100g-1) | 7.78 | 2.54 | 9.28 |
| Carbohydrate (g 100g-1) | 26.3 | 51.4 | 16.02 |
| Ash (g 100g-1) | 12.20 | 7.05 | 0.87 |
| Moisture (g 100g-1) | 7.34 | 6.89 | 69.55 |
| Energy Kcal 100g-1 | 359 | 357 | 165 |
| Crude Fibre | 0.61 | 1.16 | 0.00 |
Sampling
Fish was harvested when they attained marketable size (mean weight 200g/fish) and was not fed for 48 hours prior to harvesting. As commonly practice, the fish were immersed in slurry of ice-saltwater until death before being used for the analysis. Ten fish per tank (30 from each diet treatment) were used for each analysis i.e., nutritional composition, colour analysis and sensory evaluation.
Porcine DNA detection of imported and local commercial formulated feed
The commercial pellets used were screened for the presence of porcine DNA. DNA was extracted from feed samples using a commercial DNA extraction kit and Real Time PCR Porcine Detection Kit (Applied Biosystem) (Manufacturer’s Protocol). The real-time PCR machine (Eppendorf, ep Gradient S) was used for detection of porcine DNA10. The primer pair used in this study was designed to amplify a fragment of the pig’s (Sus scrofa) mitochondrial Cytochrome b region. The internal control of 18S rRNA primers (endogenous) and probe (no. 4319413E, Applied Biosystems) were labelled with fluorescent. The 5’-CTTGCAAATCCTAACAGGCCTG-3’ is the sequence of forward primer and 5’-CGTTTGCATGTAGATAGCGAATAAC-3’ is the sequeance of reverse primer, meanwhile 5’-(FAM)-ACAGCTTTCTCATCAGTTAC-(NFQ)(MGB)-3’ is the sequence of TaqMan MGB Probe.
The negative control for analysis (NTC, no-template control) was also prepared. Mastercycler ep realplex (Eppendorf) was used to perform Real-time PCR. All reactions were run in triplicates in SnapStrip II PCR tubes (SSI). The PCR mixtures (2.5 µl of template DNA, 12.5 µl of universal PCR master mix (Applied Biosystem), 0.75 µl of primer pair (10 µM each) and 0.5 µl of TaqMan Probes (10 µM)) were placed in a 25 µl final volume. The results are shown in Fig. 1. As clearly indicated in Fig. 1, signals from positive control and imported feed passed the threshold, indicating detection of porcine genetic sequence. The threshold level or referred as cycle threshold level (Ct) in real time PCR is calculated based on detection of fluorescence signal that is accumulated during the reaction. It is the number of cycles required for the fluorescence signals to exceed the background level (threshold). The amount of target nucleic is inversely proportionate to the amount of target nucleic acid.Lower Ct values (typically below 29 cycles) indicate high amounts of target sequence. Higher Ct values (above 38 cycles) mean lower amounts of your target nucleic acid.10 Signals from NTC, blank and other feed samples did not pass the threshold indicating no detection of porcine genetic sequence.
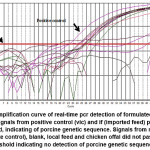 |
Figure 1: Amplification curve of real-time pcr detection of formulated fish feed samples. Signals from positive control (vic) and if (imported feed) passed the threshold, indicating of porcine genetic sequence. Signals from ntc (no-template control), blank, local feed and chicken offal did not pass the threshold indicating no detection of porcine genetic sequence. Click here to View figure |
Nutritional Composition
Proximate composition (protein, fat, carbohydrate, ash and moisture) was done in triplicate based on the method of the Association of Official Analytical Chemist (AOAC).11 Kjeldahl method was used to determine protein content using an automatic Gerhard, Vap50 (Germany) Kjeldhal system. Fat content was extracted using mixture of chloroform/:methanol at ration 2:1 (v/v). Moisture content was determined by oven drying (105˚C). Ash content was determined by heating at 550˚C in a muffle furnace. Carbohydrate content was determined by the difference.
For the determination of amino acid (AA) profiles, a total of 0.1-0.2 g catfish muscles were hydrolysed in 5 mL of 6 N HCl (110˚C for 24 h) and filtered using 0.45 mm membrane filter. Amino acid (AA) profiles of samples were determined according to manufacturer’s instruction manual of HPLC Waters 2475 (Waters Co., Milford, USA), fluorescence detector and AccQ Fluor Reagent. All determinations were carried out in triplicate. Fatty acid (FA) profiles was measured as fatty acid methyl ester (FAME)12 The FAME was separated by gas liquid chromatography on a HP 5890 which equipped with an auto-sampler and detector of flame ionization. The separation was carried out with hydrogen as the carrier gas in capillary column DB2 (Agilent, USA) at flow rate of 1.3 ml/min. The temperature of injector and detector were at 240°C and 250°C, respectively with total run 30 min. The FA profiles was identified by comparison with standard reference of component FAME mix (Supelco 37) and expressed as percentage of total lipid.
Colour Determination
Instrumental colour determinations were performed on the skin along the lateral line of the fresh fish just below the dorsal fin, on each side of the fish body using a Minolta Chroma Meter CR400 (Minolta, Osaka, Japan). Determinations were carried out on 30 fishes from each group immediately after harvesting. The coordinates of L* (lightness; 0 for black and 100 for white), a* (redness; -100 for green and +100 for red) and b* (yellowness; -100 for blue and +100 for yellow) were measured. The colour of the muscle/fish tissue was also measured.
Sensory Evaluation
The sensory panellists comprised of 10 trained individuals (2 males and 8 females) aged from 20-58 years from the Malaysian Fisheries Research Institute (FRI), Malaysia and the Food Technology Program, Universiti Sains Malaysia (USM). They were non-smoking individuals who consumed fish regularly including farmed fish. They were selected based on their availability and ability. Their acceptability of catfish was either moderate or high.
The panellists had undergone proper training (3 sessions per week for 2 weeks), assessing 2 important attributes (aroma, flavour).14,15 A commercially obtained pond and tank-raised fish samples were chosen as “standard” and evaluated. The training session started with all the panel members generating the sensory attributes/descriptors that they considered to be important in describing the aroma and flavour of catfish for use in sensory profiling. About 49 sensory terms were successfully generated from the panellists’ opinions of the fresh and cooked catfish fillet and later by consensus agreed to select 2 and 4 main descriptors for raw and cooked catfish fillet, respectively. A simple terminology was developed and intensity was defined. They are 1) typical fresh aroma (the aromatics associated with cooked fish that distinctively characterise it as fish yet fresh); 2) off-odour (every perceptible non-characteristic odours of fresh fish including earthy, muddy, fatty, rancid); 3) typical fresh flavour (the total oral impression of fresh cooked fish as perceived by smell, taste and feeling); 4) off-flavour (every perceptible non-characteristic flavours of catfish including nutty, fatty, sweet). The training ended with a duo-trio test to make sure that the panellists were able to differentiate and identify pork among two other meat samples.
The sensory evaluation was carried out in designed room equiped with partitions between subjects. The evaluation was performed on fresh samples immediately after harvesting. To reduce the variability between fillets, the fish of about the same weight and size were used. The skin on fillets were removed, wrapped with aluminium foil, cooked in a steamer (6 min at 100°C) and immediately served. Cooked fillets were presented to the panellists (white ventral skin facing upward) sequentially in coded white dishes. The four selected attributes were assessed on a 12 cm unstructured line scale with two anchor points located at 1.0 on the left end which indicated no intensity/weak while the right end (9.0) represented the extreme/highest intensity. Intensity score for farm-raised catfish (reference) flavour and odour were less than 9 on this scale. The panellists were also asked to describe the off- flavour and off-odour detected. All samples were analysed in duplicates.
Statistical Analysis
Standard deviation and average values were calculated in EXCEL (Windows 7, Microsoft Office, Redmond, Washington, USA). The data was subjected to Analysis of Variance (ANOVA) using SPSS 12 (SPSS Inc., Illinois, USA). Means were compared by Tukey’s honest significant test (HSD) and significance was accepted at p<0.05.
Results and Discussion
Fish Sample
In this study, we used formulated feeds (import and locally manufactured) which were commonly used by the farmers to reflect the real practice in the industry. We also included 100% unprocessed chicken offal as control feed although it does not reflect what is usually being practiced in the field. However, the small scale farmers are known to use 100% chicken offal or chicken offal mixed with rice bran or broken rice with coconut husks as feed. Even though chicken offal is not totally considered as najasa, it could contain faecal material. In this study, we consider chicken offal as najasa and used this to simulate whether using 100% najasa as feed could affect the odour, flavour and colour of the catfish.
Mortality during feeding trial was fairly low (<5%). The final mean weights of the catfish fed with imported feed (216.67 ± 32.14g ) and local commercial feed (211.67 ± 18.86g) were significantly higher (p < 0.05) compared to the fish fed on chicken offal (183.33 ± 28.86g). The final mean lengths of catfish fed with imported feed, locally produced feed and chicken offal were 30.3 ± 1.1, 30.6 ± 1.2 and 31.2 ± 1.1 cm, respectively with no significantly different (p > 0.05) found among treatments.
Nutritional Composition
The proximate composition of catfish fillet is summarized in Table 2. In general the protein, lipid, moisture and energy contents in the fillet were significantly different (p< 0.05) influenced by the diet. The protein and moisture contents of fish fed on imported feed and local feed had significantly higher (p< 0.05) as compared to the catfish fed with chicken offal. However, catfish fed chicken offal gave significantly higher (p< 0.05) lipid and energy content as compared to the imported and local feeds. There were no significant differences (p>0.05) in carbohydrate and ash contents among the catfish fed with the three different diets. The major essential amino acids (EAA) detected in all catfish samples were similar regardless of the types of feed (Table 2). Leucine, lysine, valine and threonine were the main EAA while glutamic acid and aspartic acids were the major non-EAA detected in the catfish fillet. The FA profile of catfish fed the three dietary treatments is shown in Table 3. The values are expressed as weight percentages of the total methyl acid esters. The major FA categories of catfish fillet were significantly different (p < 0.05) among treatments. The FA in the muscle of catfish fed with imported and local pellets was dominated by saturated fatty acid (SFA), while in catfish fed with chicken offal was dominated by monounsaturated fatty acid (MUFA). Polyunsaturated fatty acid (PUFA) was the lowest FA found in all the catfish muscles. The FA found in the catfish fillet, in order of amount were palmitic acid (C16:0), oleic acid (C18:1n9c), stearic acid (C18:0) and palmitoleic acid (C16:1). Regardless of the diets, docohexaenoic acid, DHA (C22:6n3) and linoleic acid, ALA (C18:2n6c) were the dominant PUFA detected in all catfish fillets.
Table 2: Proximate composition (% wet basis) and amino acid profile (g 100g-1) of fillets from catfish fed with three diets for 12 weeks
| Composition | Imported feed | Local feed | Chicken offal |
| Protein | 18.60 ± 1.93 a | 17.46 ± 0.64 a | 14.72 ± 2.65 b |
| Fat | 3.65 ± 0.28 a | 3.93 ± 0.58 a | 16.10 ± 0.79 b |
| Carbohydrate | 0.08 ± 0.11 | 0.68 ± 0.57 | 0.51 ± 0.51 |
| Ash | 1.13 ± 0.03 | 1.12 ± 0.06 | 1.17 ± 0.33 |
| Water | 76.54 ± 2.07a | 76.80 ± 1.00a | 67.49 ± 1.39b |
| Energy (Kcal 100g-1) | 107.5a | 108a | 207b |
| Essential amino acidsLeucineLysineValineThreoninePhenylalanineIsoleucine
Methionine Tryptophan |
1.75 ± 0.211.55 ± 0.040.93 ± 0.080.89 ± 0.130.71 ± 0.140.90 ± 0.100.38 ± 0.09
N.D |
1.18 ± 0.301.17 ± 0.230.61 ± 0.140.61 ± 0.130.49 ± 0.110.60 ± 0.140.25 ± 0.04
N.D |
1.07 ± 0.311.25 ± 0.190.57 ± 0.130.59 ± 0.070.64 ± 0.250.55 ± 0.150.25 ± 0.08
N.D |
| Non-essential amino acidGlutamic acidAspartic acidGlycineArginineProlineAlanine
Serine Thyrosine Histidine Cysteine |
2.84 ± 0.231.71 ± 0.170.87 ± 0.411.35 ± 0.250.56 ± 0.070.94 ± 0.110.77 ± 0.11
0.65 ± 0.24 0.76 ± 0.19 N.D |
1.85 ± 0.441.11 ± 0.270.57 ± 0.070.96 ± 0.240.38 ± 0.080.67 ± 0.160.54 ± 0.11
0.31 ± 0.06 0.55 ± 0.09 N.D |
1.48 ± 0.780.90 ± 0.530.44 ± 0.160.85 ± 0.280.37 ± 0.060.54 ± 0.250.54 ± 0.08
0.43 ± 0.17 0.64 ± 0.12 N.D |
a Values are means ± standard deviations of three replicates experiments.
b Mean values within rows with the same superscript are not significantly different (p > 0.05)
N.D-not determined
Table 3: Fatty acid (FA) profile (expressed as % lipid) from fillets of catfish fed with three diets for 12 weeks
| FA profile | Imported feed | Local feed | Chicken offal |
| Saturated fatty acid (SFA) | |||
| C 4:0 | 0.02 ± 0.01 | 0.01 ± 0.01 | 0 |
| C 6:0 | 0.01 ± 0.01 | 0.02 ± 0.00 | 0.12 ± 0.16 |
| C 8:0 | 0.08 ± 0.01 | 0.15 ± 0.01 | 0.22 ± 0.03 |
| C 10:0 | 0.02 ± 0.00 | 0.06 ± 0.03 | 0.36 ± 0.50 |
| C 11:0 | 0.02 ± 0.02 | 0.06 ± 0.02 | 0.23 ± 0.06 |
| C 12:0 | 0.20 ± 0.03 | 0.54 ± 0.33 | 0.51 ± 0.14 |
| C 13:0 | 0.09 ± 0.04 | 0.09 ± 0.03 | 0.05 ± 0.01 |
| C 14:0 | 4.18 ± 0.37a | 2.43 ± 0.27b | 1.10 ± 0.08c |
| C 15:0 | 0.55 ± 0.01 | 0.49 ± 0.09 | 0.32 ± 0.02 |
| C 16:0 (Palmitic acid) | 26.13 ± 1.94 | 33.69 ± 2.51 | 27.70 ± 1.12 |
| C 17:0 | 0.55 ± 0.04 | 0.38 ± 0.06 | 0.23 ± 0.01 |
| C 18:0 | 8.94 ± 0.89 | 10.66 ± 1.37 | 7.02 ± 0.31 |
| C 20:0 | 0.55 ± 0.18 | 0.41 ± 0.10 | 0.23 ± 0.08 |
| C 21:0 | 0.05 ± 0.08 | 0.54 ± 0.04 | 0.19 ± 0.13 |
| C 22:0 | 3.65 ± 0.33 | 2.78 ± 0.79 | 1.46 ± 0.45 |
| C 23:0 | 3.93 ± 1.74 | 2.82 ± 1.51 | 2.36 ± 0.57 |
| C 24:0 | 3.88 ± 1.22 | 3.13 ± 2.10 | 1.41 ± 0.32 |
| Total SFA | 52.85a | 58.27a | 43.53b |
| Monounsaturated fatty acid (MUFA) | |||
| C 14:1 | 0.49 ± 0.27 | 0.52 ± 0.17 | 0.73 ± 0.11 |
| C 15:1 | 0.05 ± 0.03 | 0.08 ± 0.02 | 0.07 ± 0.02 |
| C 16:1 | 4.28 ± 0.26a | 2.17 ± 0.24b | 5.19 ± 0.06c |
| C 17:1 | 0.27 ± 0.02 | 0.13 ± 0.02 | 0.08 ± 0.01 |
| C 18:1n9c (Oleic acid) | 25.60 ± 1.91a | 25.95 ± 1.60a | 36.91 ± 1.30b |
| C 20:1n9 | 2.41 ± 1.00 | 1.15 ± 0.29 | 0.54 ± 0.03 |
| C 22:1n9 | 2.36 ± 0.57 | 1.84 ± 0.39 | 1.56 ± 0.31 |
| C 24:1 | 2.98 ± 1.65 | 1.76 ± 1.36 | 2.95 ± 1.93 |
| Total MUFA | 38.44a | 33.59a | 48.03b |
| Polyunsaturated fatty acid (PUFA) | |||
| C 18:2n6t | 0.16 ± 0.01 | 0.02 ± 0.04 | 0.08 ± 0.02 |
| C 18:2n6c (Linoleic acid cis) | 3.31 ± 0.92 | 2.37 ± 0.40 | 4.19 ± 1.00 |
| C 18:3n6 | 0.06 ± 0.03 | 0.05 ± 0.01 | 0.06 ± 0.01 |
| C 18:3n3 | 0.34 ± 0.05 | 0.19 ± 0.02 | 0.10 ± 0.01 |
| C 20:2 | 0.11 ± 0.02 | 0.09 ± 0.01 | 0.06 ± 0.01 |
| C 20:3n6 | 0.08 ± 0.07 | 0.05 ± 0.01 | 0.05 ± 0.01 |
| C 20:3n3 | 0.06 ± 0.06 | 0.07 ± 0.01 | 0.08 ± 0.02 |
| C 20:4n6 (Arachidonic acid) | 0.50 ± 0.08 | 0.10 ± 0.03 | 0.22 ± 0.12 |
| C 20:5n3 (EPA) | 0.17 ± 0.17 | 0.05 ± 0.05 | 0 |
| C 22:2 | 0.65 ± 0.32 | 0.48 ± 0.13 | 0.25 ± 0.12 |
| Total PUFA | 8.71 | 8.14 | 8.81 |
a Values are means ± standard deviations of three replicate experiments.
b Mean values within rows with the same superscript are not significantly different (p > 0.05)
The general Muslim consumers are worried that feeding fish with najasa will alter the nutritional composition of the fish to be similar to that of najasa. This doubt has been answered in this study. The results of the proximate composition analysis of the diets used and catfish fillet indicated that the feed used may influence the composition of the catfish. The proximate composition of catfish fillet fed with 100% chicken offal was significantly different (p < 0.05) from that of catfish fed with formulated feeds (both imported and locally produced). The chicken offal diet gave significantly (p < 0.05) higher lipid and energy but lower protein content in catfish fillet compared to the imported and local feed diets. There was no significant difference (p > 0.05) in carbohydrate and ash content among the catfish fed with different diets. The results indicated that the proximate composition of the fillet was contributed by the main composition of the feed they consumed. On the other hand, there was no significant difference (p > 0.05) in proximate composition of the fillets between catfish fed with imported feed and locally produced feed. The results showed that feeding catfish with feed containing smaller percentages of najasa material (10-15% blood meal) has no effect on the proximate composition of the catfish fillet.
The protein content of fillets from catfish fed with chicken offal in this study (14.72%) is in accordance with Pongchawee et al.,2 who reported 15.23% protein content in catfish fed with chicken offal in Bangkok, Thailand. However the lipid content in catfish fed with chicken offal in this study was much higher (16.16%) as compared to the same study (5.08%). The protein content in catfish fillet fed with 10-15% najasa material (18.60%) was also comparable to the fillet of catfish (17.46%) fed with local pellet which claimed not to have najasa (porcine derivative of any form) as ingredients. The protein content of catfish fed with imported pellet (18.60%) in this study was also comparable to the protein content (19.64%) of wild catfish in Lekki Lagoon, Nigeria,15 catfish fed with housefly larvae meal (19%),16 farmed catfish from Holland (16.8%)17 and hybrid catfish fed with ground chicken carcass, rice brown powder, fish meal, soy bean meal and fish oil in Thailand (17.28%).2 Similarly, the lipid content (3.65%) of catfish fed with imported feed was almost equivalent to catfish fed with locally manufactured feed (3.93%) with no najasa material and was within the range (5.70%) reported by Rosa et al.,17 Osibona et al.,15 reported much lower lipid content (1.15%) in captured catfish from Nigeria. This is not surprising as lipid content of wild fish is known to be lower as compared to farmed fish. These findings strengthen the fact that feeding catfish with feed incorporated with small percentages of najasa material (10-15% blood meal) has no effect on the protein and lipid composition of the catfish fillet.
The major essential amino acids (EAA) detected in all catfish samples were similar regardless of the feed type. In the present study, leucine, lysine, valine and threonine were the main EAA while glutamic and aspartic acids were the major non-EAA detected in catfish fillets regardless of feeds. Rosa et al.,17 reported lysine, leucine and arginine as the most important EAA in catfish from Holland and glutamic acid and aspartic acid were the major non-EAA. Cruz et al.,18 found amino acids in greater proportion in the flesh, in the order of: lysine, leucine, tyrosine, arginine and threonine. The results suggest that the diet given had no remarkable impact on the AA profiles of catfish.
The interest of studying the AA and FA profiles of the catfish fillet in the present study is to further confirm as to whether the composition of the najasa will be incorporated into catfish tissue. From the present study, we found that the FA profiles of catfish was partially modified by the lipid sources with SFA being the predominant FA in catfish fed with formulated feed but not in catfish fed with chicken offal. PUFA was the least of the fatty acids found in all catfish muscles regardless of the of diet type. Cruz et al.,18 reported relative equivalence of MUFA and SFA in all species of catfish in their review on the nutritional quality of the meat in Catfish species. They also noted lesser extent of PUFA. MUFA was the predominant FA in catfish fed with chicken offal. This is understood as MUFA is also the main FA group in chicken fat.19 The results obtained in this study are in agreement with Glencross20 who found that the dietary FA profiles had a tramendeous impact on the nutritional composition of the fish flesh.
Generally, the FA profiles of catfish fillet obtained in this study are similar to previous reports on both wild and farmed catfish.15, 18, 21 The only substantial difference was observed in the palmitic acid (C16:0) being the predominant FA in catfish fed with formulated feeds (both imported and local) while oleic acid (C18:1n9c) was the major FA in catfish fed with chicken offal. This is not surprising as chicken fat is demonstrated to be a predominant source of oleic acid.19 In the present study, palmitic acid was the main SFA found in catfish irrespective of diet. Similar observations had been made by others on farmed and wild catfish elsewhere.15, 17, 21, 22 This FA is considered to be the key for metabolic processes of aquatic animals including fish and the level is not influenced by the diet.23 On the other hand, oleic acid which is the major MUFA in catfish is considered to be of exogenous origin and usually reflects the type of fish diet.24 The principle acids in the PUFA group were linoleic acid (18:2) and docosahexaenoic acid. (C22:6). Similar findings were reported by Rosa et al.,17 Nur and Mohamad21 and Okonji and Daniel.25 EPA was not detected in the fillet from catfish fed with chicken offal. This was expected as the feed did not contain any fish meal in them.
Colour Determination
The catfish colour was found to be affected by dietary treatments (Table 4). Significant differences (p<0.05) were observed when catfish skin and flesh were determined colorimetrically. Fish fed with chicken offal had lighter skin colour or higher L* value (48.34) as compared to catfish fed with formulated feed (37.69-39.75). Regardless of the type of feed, there was no significant (p > 0.05) difference in the L* value of catfish flesh. Fish fed with chicken offal recorded significantly (p < 0.05) highest a* value (redness) in flesh but lowest in skin and significantly (p < 0.05) highest b* value (yellowness) both on skin and muscle than to fish fed with formulated feed.
Table 4: Colour measurement of flesh and skin of catfish fed with three diets for 12 weeks
| Diets | Imported feed | Local feed | Chicken offal |
| Colour (flesh)Lightness, L*Redness, a*Yellowness, b* | 36.03 ± 1.53a-0.47 ± 1.06a4.02 ± 1.63a | 35.84 ± 2.20a0.31 ± 1.43a4.20 ± 1.36a | 36.64 ± 3.97a1.64 ± 1.29b7.49 ± 3.82b |
| Colour (skin)Lightness, L*Redness, a*Yellowness, b* | 39.75 ± 5.55a-0.35 ± 0.79a0.56 ± 1.44a | 37.69 ± 4.87b-1.14 ± 0.77b1.45 ± 1.09b | 48.34 ± 6.52b-1.89 ± 0.56c2.18 ± 1.90b |
a Values are means ± standard deviations of three replicate experiments (n=30/diet).
b Mean values in the same row with the same lowercase letters are not significantly different (p > 0.05)
Colour is another important features that determines the Jallalah status. In this study, we used instrumental colour determination rather than sensory evaluation to evaluate the colour differences because it is difficult to gauge the small colour differences with the naked eye. Colour determinations were taken immediately after harvesting (within 1 min) to prevent darkening of the tissue as a result of capture. The instrumental colour measurements recorded a significant difference (p<0.05) in lightness L* value of the skin of catfish fed with different diets and not the flesh or muscle. However, the a* and b* (redness and yellowness) values of muscle and skin colour were significantly (p<0.05) affected by the diets. In particular, the chicken offal fed catfish appeared to have marked yellowness on the muscle and skin and lighter colour of the skin. The L*, a* and b* value of the catfish muscle fed with formulated feed in this study (L* (35.84 to 36.03), a* (-0.47 to 0.31) and b* (4.02 to 4.20) were comparable to those reported by Baghwetah et al.22 on catfish muscle fed with fish and vegetable (palm and coconut) oils (L* (39.88 to 44.28), a* (-2.40 to -1.43) and b* (3.21 to 3.70). The b* value of fillet of catfish fed with chicken offal (7.49) was much higher than the value reported by the same author (4.02 to 4.20) which could be due to several reasons. According to Dong et al.,26 the pigment absorption, transportation and deposition in the fish cells influenced by the fat content in the feed. With bad quality fats, the the transportation and absorption of pigment granules in the fish body cannot be done normally. Furthermore, oxidised fat such as those found in chicken offal can generate whether oxygen free radicals or some other free radicals. This could causes fragmentation in the carotenoids allowing it to lose pigment function and lead to degeneration of fish body colour as explained by Dong et al.,26 Oxidised fat will also affects physiological functions of chromatophore cells and result in notable decrease in the fish skin showing white or yellow colouration.26 Additionally, Chinabut27 demonstrated that jaundice with symptoms including yellow coloration of the skin and other tissues developed in catfish fed with rancid chicken offal. The presence of rancid fats in diet will depletes the vitamin E and other antioxidants, resulting vulnerable to oxidation of biological membranes.
Sensory Evaluation
Mean intensity ratings for each of the attributes in the raw and cooked catfish fillet fed the three test diets are represented in Table 5. In general, the panellists found no significant differences (p > 0.05) in all attributes between catfish fed with imported or local formulated feeds. Fillets from catfish fed with formulated feed were more characterized by higher levels of typical fresh fish aroma and flavour than noted for fillets from fish fed with chicken offal. Off-flavour and off-odour were significantly lower (p<0.05) in fish fed with formulated feed relative to those fed with chicken offal diet. Non characteristic odours or flavour were not perceived by the sensory panel for fish groups fed with both imported and local formulated feeds.
Table 5: Sensory evaluation of raw and cooked fillets from catfish fed with three diets for 12 weeks
| Sensory scores | ||||
| Sensory descriptors | Imported feed | Local feed | Chicken offal | |
| Raw | Typical fresh aroma | 7.13 ± 1.22a | 6.93 ± 1.23a | 5.05 ± 0.74b |
| Off-Odour | 1.09 ± 0.04a | 1.16 ± 0.04a | 2.26 ± 0.91b | |
| Cooked | Typical fresh aroma | 8.06 ± 0.90a | 7.85 ± 1.26b | 6.09 ± 1.77c |
| Off-Odour | 1.45 ± 0.21a | 1.39 ± 0.11a | 4.01 ± 0.21b | |
| Typical fresh flavour | 7.07 ± 0.90a | 6.94 ± 1.69a | 4.05 ± 1.77b | |
| Off-flavour | 1.28 ± 0.16a | 1.33 ± 0.22a | 3.74 ± 0.90b | |
aValues are means ± standard deviations of three replicate experiments.
bMean values in the same row with the same lowercase letters are not significantly different (p > 0.05)
The sensory evaluation of catfish is the most important parameter investigated in this study. This is because the noticeable changes in the catfish odour, colour and taste are the main criteria that qualify catfish as al-jallalah. We demonstrated that feeding catfish with imported feed (consisting of 10-15% najasa materials) maintained the typical characteristic of fresh fish flavour and odour in catfish fillet and did not yield foreign aroma or flavour. On the other hand, catfish fed with 100% chicken offal caused the flesh of the fish to have a significantly elevated off-odour and off-flavour. Majority of the panellists noted the off-flavour and off-odour to be chickeny-aromatic associated with sweet cooked chicken meat (93%) and fatty – aromatic associated with dairy lipid products, and cooked chicken skin (5%). As the fish used during the sensory evaluation were freshly harvested, the off-odour and off-flavour detected may well be directly related to the diet given rather than the chemical compounds released during spoilage processes.
Since there are very limited studies on the sensory analysis conducted on catfish fed with different diets, we had to compare our results with other fish species. Our observation was similar to previous reports which suggested the fat in fish flesh affects the sense of flavour and the general sensation of cooked flesh in the mouth as well as odour.28, 29 Likewise Johansson30 indicated that odour could be affected by quantitative changes in FA profiles and/or in lipid oxidative status, and by intramuscular fat content. Feeding catfish with imported feed (contaminated with najasa at lower concentration) did not result in significant changes to the aroma and flavour and maintained the typical characteristic of fresh fish flavour and odour. On the contrary, catfish fed with 100% chicken offal resulted in the flesh of the fish to have a significantly elevated off-odour and off-flavour. However, it is worth mentioning that the off-odour and off-flavour detected in the present study was not offensive or bad but rather similar to the smell of chicken. Our results were in accordance with those reported earlier on other fish species. For instance, Izquierdo et al.,31 also did not find any effect of substituting 80% of the supplemental fish oil in the diet of gilthead seabream with flaxseed oil on their odour or flavour. Likewise, at the 60% replacement level, no effects of dietary treatments were found to affect taste, texture and aroma of the gilthead sea bream.32 As stated earlier, feeding catfish with 100% chicken offal caused the flesh of the fish to have a significantly elevated off-odour and off-flavour. Similarly turbot (Psetta maxima) fed 100% of the supplemental dietary lipid of flaxseed oil had the ventral fillets with a more intense odour and more fatty fishy odour than fish fed with marine fish oil.33
The mean intensity score for typical fresh flavour of catfish fillet is around 4.05-7.07. This is agreeable with Chambers and Robel13 who noted low intensity flavour notes in raceway-raised catfish as compared to pond raised catfish and other freshwater fish. Understandingly, the intensity score for typical fresh aroma is higher in cooked fish than raw fillet. This is due to the higher release of volatile aldehydes and alcohol compounds from the heat during cooking.
Besides the change in taste, smell and colour of the catfish, the general Muslim consumers are concerned that feeding fish with najasa will alter the nutritional composition of the fish to be similar to that of najasa. This concern has been explained in this study. The results generally suggested that the nutritional composition of the catfish in this study was contributed by the main composition of the feed they consumed.
Conclusion
The results of the study concluded that the incorporation of small amounts (10-15%) of najasa in the form of porcine blood meal does not have an effect on the odour, flavour, colour and nutritional composition (proximate composition, fatty acid and amino acid profiles) of catfish fillet. However 100% feeding of chicken offal (a type of najasa) have an effect on the odour, flavour, colour and nutritional composition of the catfish fillet. It also results in off-odour and off-flavour. Although the off-odour and off-flavour detected is not offensive but rather a trace smell of chicken meat which is derived from the chicken offal and not the fecal material.
Acknowledgements
We would like to thank the Department of Fisheries Malaysia for financing this project. Panellists from the Seafood Safety and Quality Section, Fisheries Research Institute (FRI) and Universiti Sains Malaysia (USM). Exceptional thanks are also due to the support staff of the FRI Batu Maung especially Ms. Faizah, Ms. Azam Hanim (FRI Batu Maung), Ms. Shifak and Ms Siti Rohaida (Fisheries Biosecurity Centre, Kuala Lumpur) for their assistance in the hatchery and laboratory.
References
- Department of Fisheries Malaysia. Annual Fisheries Statistic. http://www.dof.gov.my/en/perangkaan-perikanan-tahunan-2016. Accessed 20 June 2018.
- Pongchawee, K., Sombooyarithi, V., RaksakulthaI, N. Composition of hybrid catfish (Clarias macrocephalus x gariepinus) raised on different feeds”, ASEAN Food Journal. 1995;10:51-53.
- Chang, P.H., Kuo, S.T., Chen, M.H., Tu, C., Huang, S.H., Lau, T.M. Jaundice in cultured hybrid catfish (Clarias betrachus x Clarias fuscusi), Journal of Veterinary Clinical Science. 2008;1:47-51.
- Agbabiaka, L.A., Ezeafulukwe, C.F., Ekeledo, C.B. Recycled dead chicken meal in low cost practical diets for African catfish (Clarias gariepinus) fingerlings. Agriculture and Biology Journal of North America. 2013;4:181-185.
CrossRef - Lee, T.B. Fish on the menu-On our way to responsible fish farming: The future of fish feed. http://www.visbureau.nl/fileadmin/user_upload/ visbureau/Downloads/Evenementen/20130211_The_future_of_fish_feed_ Trygve_Berg_Lea.pdf. Accessed 20 December 2017
- Az Zuhayli, W. Ahkam al-Mawad al-Najisah wa al-Muharramah fi al-Ghiza’ wa al-Dawa’, Damsyiq: Dar al-Maktabi (in Arabic). 1997.
- Hammad, N. Al-Mawad al-Muharramah wa al-Najisah fi al-Ghiza’ wa al-Dawa’ bayna al-Nazariyyah wa al-Tatbiq. Damsyik: Dar al-Qalam. (In Arabic). 2004.
- Ibn Qudamah, ́A. M A. Al-Mughni, Dar al-Fikr , Beirut (In Arabic). 1984.
- Al-Shirbini, S.M. Mughni al-Muhtaj, Beirut, Lubnan; Dar al-Ma’refah, 1997;4: 408-409 (in Arabic).
- Tanabe, S., Hase, M., Yano, T., Sato, M., Fujimura, T., Akiyama, H. A Real-time quantitative PCR detection method for pork, chicken, beef, mutton, and horseflesh in foods, Bioscience, Biotechnology and Biochemistry. 2007;71(12): 3131-3135.
CrossRef - AOAC (Association of Official Analytical Chemists). Official Methods of Analysis 16th Gaithersburg, Maryland. 1988.
- Majid, M.I.A., Endarti, E., Hashim, R., Chong, A. Direct FAME synthesis for rapid total lipid analysis from fish oil and cod liver oil, Journal of Food Composition and Analysis. 2003;18:161-171.
CrossRef - Chambers, E.IV., Robel, A. Sensory characteristics of selected species of freshwater fish in retail distribution, Journal of Food Science. 1993;58: 508-512.
CrossRef - Webster, C.D., Tidwell, J.H., Goodgame, L.S. Growth, body composition and organoleptic evaluation of channel catfish fed diets containing different percentages of distillers’ grains with solubles, The Progressive Fish-Culturist. 1993:55:95-100.
CrossRef - Osibona, A.O., Kusemiju, K., Akande, G.R. Proximate composition and fatty acids profile of the African catfish Clarias gariepinus, Acta SATECH. 2009;3:85-89.
- Aniebo, A.O., Odukwe, C.A., Ebenebe, C.I., Ajuogu, P., Owen, O.J., Onu, P.N. Effect of housefly larvae (Musca domestica) meal on the carcass and sensory qualities of the mud catfish, (Clarias gariepinus). Advance in Food and Energy Security, 2011;1: 24-28.
- Rosa, R., Bandarra, N.M., Nunes, M.R. Nutritional quality of African catfish Clarias gariepinus (Burchell 1822): A positive criterion for the future development of the European production of Siluroidei, International Journal of Food Science and Technology, 2007;42:342-351.
CrossRef - Cruz, C.N.E., Crus, C. P.E., Mahecha, H.S. Characterization of the nutritional quality of the meat in some species of catfish: A review, Revista Facultad Nacional de Agronomía Medellín. 2012;65:6799-6809.
- Feddern, V., Kupski, L., Eliane, P.C., Giacobbo, G., Mendes, G.L., Badiale-Furlong, E., De Souza-Soares, L.A. Physico-chemical composition, fractionated glycerides and fatty acid profile of chicken skin fat, European Journal of Lipid Science and Technology, 2010;112:1277–1284.
CrossRef - Glencross, B.D. Exploring the nutritional demand for essential fatty acids by aquaculture species. Reviews in Aquaculture, 2009;1:71-124.
CrossRef - Nur, A. M., Mohamad, J. Fatty acids composition of selected malaysian fishes, Sains Malaysiana. 2012;41: 81–94.
- Baghwetah, A.M., Roshada, H., Mohammed, A. P. Effects of dietary lipid sources on growth and some muscles quality characteristics of African Catfish Clarias gariepinus. Asian Pacific Aquaculture Conference, 3-6th November 2009, Putra World Trade Centre, Kuala Lumpur, Malaysia.
- Ackman, R.G., Eaton, C.A. Some commercial Atlantic herring oils: Fatty acid composition, Journal of Fisheries Research, 1966;23: 991-1006.
CrossRef - Ackman, R.G. Fish lipids in Connel, J. J. (ed.) Advances in Fish Science and Technology, Fishing News Book Ltd. Farnha, Surrey, UK. 1980: 86-103.
- Okonji, V.A., Daniel, E. Fatty acids variation in Oreochromis niloticus and Clarias gariepinus from semi-intensive fish tank, World Journal of Fish and Marine Science, 2013; 5: 169-175.
- Dong, Q., Yong, Y., Su, S. Nutrition and changes in fish body colouration in catfish. AQUA Culture Asia Pacific Magazine, 2012;1:26-28.
- Chinabut, S. Jaundice disease in catfish, a case study demonstrating a decline in incidence as a result of research output, in Arthur, J.R., Phillips, M.J., Subasinghe, R. P., Reantaso, M.B., MacRae, I. H. (eds.) Primary Aquatic Animal Health Care in Rural, Small-scale, Aquaculture Development. FAO Fisheries Technical Paper No. 406, 2002:77-80.
- Grigorakis, K., Taylor, K.D.A., Alexis, M.N. Organoleptic and volatile aroma compounds comparison of wild and captured gilthead sea bream (Sparus aurata): Sensory differences and possible chemical basis. Aquaculture, 2003; 225:109-119.
CrossRef - Periagò, M.J., Ayala, M.D., Lòpez-Albors, O., Abdel, I., Martinez, C., Garcìa-Alcázar, A., Ros, G., Gill, F. Muscle cellularity and flesh quality of wild and farmed sea bass Dicentrachus labrax L, Aquaculture, 2005; 249:175-188.
CrossRef - Johansson, L. Eating quality of farmed rainbow trout (Oncorhynchus mykiss). In Kestin, S. C. and Warriss, P. D. (eds.), Farmed Fish Quality, Fishing News Books, Blackwell Science, Oxford, UK, 2001: 76-88.
- Izquierdo, M.S., Montero, D., Robaina, L., Caballero, M.J., Roselund, G., Gines, R. Alterations in fillet fatty acid profile and flesh quality in gilthead seabream (Sparus aurata) fed vegetable oils for a long term period: Recovery of fatty acid profiles by fish oil feeding, Aquaculture, 2005; 250: 431-444.
CrossRef - Izquierdo, M.S., Obach, A., Arantzamendi, L., Montero, D., Robaina, L., Rosenlund, G. Dietary lipid sources for seabream and seabass: growth performance, tissuecomposition and flesh quality, Aquaculture Nutrition, 2003;9:397-407.
CrossRef - Regost, C,, Arzel, J., Cardinal, M., Rosenlund, G., Kaushik, S.J. Total replacement of fish oil by soybean or linseed oil with a return to fish oil in turbot (Psetta maxima) 2. Flesh quality properties, Aquaculture, 2003; 220: 737-747.
CrossRef
Accepted on: 16/08/2019
Second Review by: Prof. Sogbesan OlukayodeNigeria
Final Approval by: Dr. Ardiansyah


Web of Science Coverage
Emerging Sources Citation Index (ESCI)
2024 Journal Impact Factor: 1.1
Scopus Journal Metrics
CiteScore 2025: 2.6
CiteScore Details
Sustainable Nutrition: Food Systems, Nutrient Retention, and Public Health Impact
![]()
This journal is a member of, and subscribes to the principles of, the Committee on Publication Ethics (COPE)


