Optimization of Process Parameters of Parboiled Black Rice Using Response Surface Methodology
 , Elvira Syamsir1*, Slamet Budijanto1
 1Department of Food Science and Technology, IPB University, Bogor, West Java, Indonesia
2Department of Agricultural Technology, Institute of Agricultural Stiper Yogyakarta, Sleman, Yogyakarta, Indonesia
Corresponding Author Email: elvira_tpg@yahoo.com
DOI : http://dx.doi.org/10.12944/CRNFSJ.7.1.11
Download this article as:
![]()
Black rice is well known as healthy food. Nowadays, some people try to change their diet with this rice. However, it still has a problem with long preparation time and hard texture. Parboiling is a hydrothermal process that changes rice starch from crystalline to amorphous. The parboiling process of rice consists of soaking in sodium citrate solution, high-pressure cooking, freezing-thawing and drying. The aim of this research was to find the optimum condition from three processing variables: concentration of sodium citrate (0, 2, 5 and 5%, w/v), cooking period in an autoclave (5, 10 and 15 min) and a number of freeze-thaw cycles (1, 2.5 and 4). The optimum condition was achieved with 3.8% sodium citrate concentration, 5 min cooking in an autoclave, and 3.8 freeze-thaw cycles. This optimum condition resulted in parboiled black rice with 25.84 min cooking time, 4.93 total colour difference 101.80 N hardness of cooked rice, 49.04 N chewiness of cooked rice, 5.32 kg rice grain hardness.
KEYWORDS:Black Rice; Cooking Time; Parboiled Rice; Process Optimization
Introduction
In this modern era, black rice has a big potential to become functional food. This rice contains many phenolic compounds which are accumulated on the bran layer.1 Phenolic compounds are well known associated with their ability to lower the risk of diabetes, cancer and cardiovascular diseases.2 Despite the potency as a functional food, this rice still has some problems. Black rice has a hard texture and needs more preparation time than white rice. The good cooking quality of black rice can be obtained by soaking this rice in water for an hour and then cooking for 20 minutes.3 Without soaking preparation, black rice needs 35.54 minute cooking time (in 3:1 water to rice ratio) using rice cooker but still has a hard texture. As a comparison, white rice takes only 22.49 minute in the same rice to water ratio. Therefore, the structure of black rice needs to be modified to parboiled rice for solving the problem.
Parboiling process is a hydrothermal process which converts rice starch from crystalline to amorphous.4 Basically, the process of parboiled rice consists of dehulling, soaking, steaming, drying, and milling.5 This basic process can be modified for specific purposes. Sodium citrate can be added in the soaking process to improve water penetration into the rice.6 The water penetration rate is important to obtain quick cooking time. In white rice, soaking in 5% sodium citrate solution for two hours resulted in quick cooking rice with 4 minute rehydration time.7 Use of pressure cooker in the steaming process resulted in more homogenous gelatinization and reduced the broken rice percentage.8 The addition of the freezing-thawing cycle process after steaming can give a positive impact. Freezing thawing cycles could improve the porous structure of rice so that increasing rice rehydration rate.9 Combination of soaking, steaming and freezing-thawing cycles has been already used to produce the instant (quick cooking) rice.4
In this study, the parboiling process modification with sodium citrate soaking, under pressure, steaming, and the freezing-thawing cycle was used to produce parboiled black rice. The goal of this research was to obtain the optimum process condition using response surface methodology (RSM) technique. The optimum condition consists of short cooking time, good quality of texture, colour, and rice grain hardness.
Materials and Methods
Materials
A sample of CempoIreng black rice variety was obtained from a local farmer in Ciampea, Bogor, West Java, Indonesia. The additional processing materials such as distilled water and sodium citrate were obtained from Setia Gunachemicals store, Bogor, West Java, Indonesia.
Process of Making Parboiled Black Rice
Parboiled black rice processing consisted of soaking, steaming under pressure, freezing, thawing, and drying. Soaking was done by using distilled water and sodium citrate solution at rice/water ratio of 1:2 (w/v) for 30 minutes. Steaming under pressure was carried out by using Hirayama Hiclave HVE-50 (Hirayama Manufacturing Corp., Saitama, JP) in 1.1 bar pressure. One cycles of freezing was performed with LG GR-M712YLA freezer (LG Corp., Seoul, KR) in -20 ± 2°C for 22 hours and thawing was done by using LG GR-M712 YLA refrigerator (LG Corp., Seoul, KR) in 4 ± 2°C for 40 minutes then left under running water in room temperature for 20 minute. The drying process was carried out with Memmert UF-110 universal oven (Memmert GmbH, Schwabach, DE).
Experimental Design
Box Behnken design in Response Surface Method was used in this research. All of the design processing was operated with Design Expert 7.0 software (State-Ease Inc., Minneapolis, USA). The experiments were run using 3 factors: sodium citrate concentration (A) 0-5%, steaming time (B) 5-15 minute, and freezing-thawing cycles (C) 1-4. The factor level range was obtained from previous research that showed a significant difference after independent samples t-test. The combination of these three factors resulted in 15 experimental units with 3 centre points (Table 1). The measured response was cooking time, the hardness of cooked rice, chewiness of cooked rice, the total colour difference of cooked rice, and rice grain hardness.
Table 1: Experimental units
| Run | Factor A: Sodium citrate concentration | Factor B: Steaming time | Factor C: Freezing-thawing cycle | |||
| Coded value | Real value (%) | Coded value | Real value (minute) | Coded value | Real value | |
| 1 | 0 | 2.5 | -1 | 5 | 1 | 4 |
| 2 | -1 | 0 | 0 | 10 | 1 | 4 |
| 3 | -1 | 0 | 0 | 10 | -1 | 1 |
| 4 | 1 | 5 | 0 | 10 | -1 | 1 |
| 5 | 0 | 2.5 | 0 | 10 | 0 | 2.5 |
| 6 | 0 | 2.5 | 1 | 15 | 1 | 4 |
| 7 | -1 | 0 | 1 | 15 | 0 | 2.5 |
| 8 | 1 | 5 | 1 | 15 | 0 | 2.5 |
| 9 | 1 | 5 | -1 | 5 | 0 | 2.5 |
| 10 | -1 | 0 | -1 | 5 | 0 | 2.5 |
| 11 | 0 | 2.5 | 0 | 10 | 0 | 2.5 |
| 12 | 0 | 2.5 | -1 | 5 | -1 | 1 |
| 13 | 0 | 2.5 | 1 | 15 | -1 | 1 |
| 14 | 0 | 2.5 | 0 | 10 | 0 | 2.5 |
| 15 | 1 | 5 | 0 | 10 | 1 | 4 |
Cooking Time
One-hundred grams of parboiled black rice sample was mixed with 300 mL of distilled water and then cooked with rice cooker Miyako 0.6 L 220V/50 Hz (PT. Kencana Gemilang, Tangerang, ID). Cooking time was counted from cooking indicator turned on to turn off.
Hardness and Chewiness of Cooked Rice
Hardness was defined as force needed to achieve deformation, while chewiness was the force to chew until the food was ready to swallow.10 These two analyses were carried out using texture profile analyzer TA-XT2i (Stable Micro Systems Ltd., Godalming, GB). Computer and TA-XT2i equipment were turned on then the sample was placed under the probe. The equipment was set to “Texture Profile Analysis” mode so that the sample was pressed two times. Cylinder probe was used in this analysis. Each sample was analyzed three times repetition with 90% test distance,2.0 mm/s rate for pretest, test, and posttest. Hardness and chewiness were obtained from curve analysis.
Total Color Difference for Cooked Rice
Colour measurement was analyzed by using Chroma meter CR300 Minolta (Konica Minolta Sensing Singapore Pte Ltd., Pandan Gardens, SG). Cooked rice sample was placed on the transparent dish then measured with Chromameter. The measurement resulted in L*, a*, and b*. L* value was lightness, from dark to light (0-100). Red to green chromatic colour was showed by a* value, a+for red colour and a-for green colour. Blue to yellow chromatic colour was showed by b* value, b+ for yellow colour and b- for blue colour. The total colour difference was determined by using the equation:
Rice Grain Hardness
The rice grain hardness measured the hardness of grain after parboiling without re-cooking. This measurement was important to know that the rice was hard enough for storage and transportation.11 This analysis was carried out by using Kiya Grain Hardness Tester instrument (Kiya SeisakushoCo. Ltd., Kawagoe, JP).11 Pointer needle was set to 0. Ten rice grains sample was tested. Each grain was pressed by using tester spindle until it sounds “crack”. The needle would show the hardness value in kg.
Statistical Analysis
ANOVA test was carried out using Design Expert 7.0 software (State-Ease Inc., Minneapolis, USA).
Result and Discussion
Table 2: Analysis of the mathematic model
| Response | Mathematics Model | Model Significance (p<0.05) | Lack of fit (p>0.05) | Adj R2 model | Pred R2 model | Adeq. Precision |
| Cooking Time (minute) | Quadratic | 0.0228* | 0.2596 | 0.7934 | 0.0034 | 10.118 |
| Total Color Difference of Rice (ΔE) | Mean vs Total | – | 0.3337 | 0.0000 | -0.1480 | – |
| Hardness of Cooked Rice (N) | Quadratic | 0.0023* | 0.5578 | 0.9218 | 0.7143 | 17.258 |
| Chewiness of Cooked Rice (N) | Quadratic | 0.0217* | 0.4876 | 0.7980 | 0.2024 | 10.076 |
| Rice grain Hardness (kg) | Quadratic | 0.0215* | 0.7990 | 0.7986 | 0.4988 | 9.957 |
* significant at P<0.05
Effects of Processing Factors on Cooking Time
Analysis of variance showed that factor A (sodium citrate concentration), C (freezing-thawing cycles), AC (interaction between sodium citrate concentration and steaming time), and C2 (quadratic interaction of freezing-thawing cycles) had a significant effect on cooking time. While the rest factor or factors, the combination had no significant effect. The equation of the mathematic model in real value for cooking time response was:
Y = 38.54439 – 1.80730A – 0.53983B – 5.69844C + 0.037258AB + 0.248289AC + 0.096550BC + 0.078158A2 + 0.011951B2 + 0.71858C2
The relation between all factors and cooking time was showed in figure 1. The combination of sodium citrate concentration and steaming time (figure 1a) showed that cooking time decreased along with the increase of sodium citrate concentration. It happened because the salt solution could improve the water penetration rate.12,13 The faster the water was absorbed then rice starch gelatinization time became faster. The combination between salt solution, autoclave steaming and freeze dry process could improve the rehydration ratio of quick cooking rice.6
Combination of sodium citrate concentration and freezing-thawing cycles (figure 1b) had the same path with steaming time and freezing-thawing cycles (figure 1c). The changes in cooking time were significantly affected by freezing-thawing cycles. More freezing-thawing cycles gave a more porous structure.9 Porous structure caused easier interaction between heat, water, and starch granules.
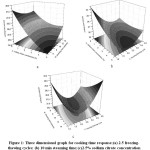 |
Figure 1: Three dimensional graph for cooking time response; (a) 2.5 freezing-thawing cycles; (b) 10 min steaming time;(c) 2.5% sodium citrate concentration Click here to View figure |
Effects of Processing Factors on Hardness of Cooked Rice
Analysis of variance showed that factor C (freezing-thawing cycles), AC (interaction between sodium citrate concentration with freezing-thawing cycles), BC (interaction between steaming time and freezing-thawing cycles), A2 (quadratic interaction of sodium citrate concentration), B2 (quadratic interaction of steaming time), and C2 (quadratic interaction of freezing-thawing cycles) had significant effect on hardness of cooked rice. While the rest factors and factors combination had no significant effect. The mathematic model equation in real value was mentioned below:
Y = 68.10048 + 4.40271A + 6.91147B + 19.48615C – 0.21416AB – 4.78607AC + 1.03296BC + 2.18579 A2 – 0.48282 B2 – 4.72207C2
Effect of all factors on the hardness of the cooked rice could be visualized by using a three-dimensional model (figure 2). The effect of steaming time and sodium citrate concentration factor on the hardness of cooked rice showed a unique path. The slight increase from 0 to 2.5% in sodium citrate concentration caused a decrease in hardness. However, sodium citrate concentration increase from 2.5 to 5% caused increasing on the hardness of cooked rice. Retrogradation phenomena could be a factor that affected the hardness of cooked rice difference on parboiled black rice. This could happen because the freezing-thawing process triggered amylose and amylopectin molecules rearrangement after starch gelatinization. A certain concentration of salt solution could reduce the retrogradation degree.14 Sodium citrate concentration above 3% could inhibit the corn starch gelatinization swelling.15 Addition of NO3– and SCN– ion in starch could inhibit retrogradation due to salting in mechanism.16
Repeated freezing-thawing on certain cycles caused low hardness of cooked rice. Figure 2b showed that the relation between sodium citrate concentration and freezing-thawing cycles. At low sodium citrate concentration, an increase in freezing-thawing cycles from 2.5 to 4times caused a decrease in the hardness of cooked rice. The porous structure which was formed by freezing-thawing cycles improved heat and water transfer rate, so it generated softer texture.8
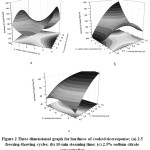 |
Figure 2: Three-dimensional graph for the hardness of cooked rice response; (a) 2.5 freezing-thawing cycles; (b) 10 min steaming time; (c) 2.5% sodium citrate concentration Click here to View figure |
Effects of Processing Factors on Chewiness of Cooked Rice
Analysis of variances showed that factor C (freezing-thawing cycles), AC (interaction between sodium citrate concentration with freezing-thawing cycles), B2 (quadratic interaction of steaming time), and C2 (quadratic interaction of freezing-thawing cycles) had a significant effect on chewiness of cooked rice. Meanwhile, the rest factors and factors combination had no significant effect on the chewiness of cooked rice. The equation of this model in real value was stated below:
Y = 16.50036 + 4.91439A + 5.00961B + 22.18777C – 0.18325AB – 3.31745AC + 0.77958BC + 1.23934A2 – 0.34101B2 – 5.18982C2
The relation between factors combination with chewiness response is visualized in figure 3, which graph was similar to the hardness of cooked rice. The chewiness value was the result of multiplication between hardness, cohesiveness, and elasticity.
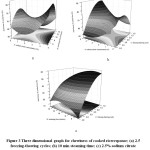 |
Figure 3: Three-dimensional graph for chewiness of cooked rice response; (a) 2.5 freezing-thawing cycles; (b) 10 min steaming time; (c) 2.5% sodium citrate concentration Click here to View figure |
Effects of Processing Factors on Total Color Difference of Rice
Total colour difference of rice was important to understand because it could early indicate if there was any anthocyanin change. Colour parameter (L*, a*, b*) on black rice had a correlation with anthocyanin content.17 Response analysis (Table 2) showed that “mean vs total” model was the best to predict the response. It meant that there was no model could predict the relationship significantly.
Effects of Processing Factors on Rice Grain Hardness
The analysis of variances showed that factor A (sodium citrate concentration), BC (interaction among steaming time with freezing-thawing cycles), A2 (quadratic interaction of sodium citrate concentration) affected significantly on rice grain hardness. Meanwhile, the other factors and factors combination had no significant effect on rice grain hardness. The equation in real value as described below:
Y = 12.94898 – 1.59617A – 0.194B – 2.52935C – 0.0216AB – 0.002AC + 0.16533BC + 0.21113A2 – 0.0173171B2 + 0.2087C2
The relation among the combination of sodium citrate concentration and steaming time factors with rice grain hardness (figure 4a) had a similar path with the relation among sodium citrate concentration and freezing-thawing cycles (figure 4b). Decreasing of rice grain hardness was affected by increasing sodium citrate concentration. Soaking in a sodium citrate solution caused the more porous physical structure of rice.13 Rice with porous structure was easily broken and more brittle.
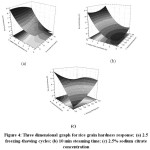 |
Figure 4: Three dimensional graph for rice grain hardness response; (a) 2.5 freezing-thawing cycles; (b) 10 min steaming time; (c) 2.5% sodium citrate concentration Click here to View figure |
Product Optimization
Table 3: Factor and response criteria for determining the optimum condition
| Factor/ response | Goal | Limit | Importance | |
| Lower | Upper | |||
| Sodium citrate concentration (%) | In range | 0.00 | 5.00 | +++ |
| Steaming time (minute) | In range | 5.00 | 15.00 | +++ |
| Freezing thawing cycless | In range | 1.00 | 4.00 | ++++ |
| Cooking time (minute) | Minimize | 25.00 | 31.02 | ++++ |
| Total color difference of rice (ΔE) | In range | 2.08 | 8.16 | + |
| Hardness of cooked rice (N) | Minimize | 91.55 | 157.08 | +++ |
| Chewiness of cooked rice (N) | Minimize | 43.06 | 89.88 | +++ |
| Rice grain hardness (kg) | In range | 4.28 | 8.80 | ++ |
Optimum condition was determined by giving goal and importance score for each factor and response (table 3). The criteria were determined based on the research goal and response analysis. The optimum condition was predicted at 3.8% sodium citrate concentration, 5 minute steaming time, and 3.8 times freezing-thawing cycles with 0.98 desirability value
The optimum condition of parboiled black rice was effective to reduce the cooking time and improve the texture. Table 5 showed that the cooking time was reduced from 35.54 to 25.84 minute. This cooking time was already closed toIR64 white rice cultivar (23 minutes).18 The texture parameter (hardness and chewiness) of optimum condition was also softer than normal black rice.
Table 4: Comparison between normal black rice and optimum condition of parboiled black rice
| Response | Normal Black Rice | Optimum Condition of Parboiled Black Rice |
| Cooking time (minute) | 35.54 | 25.84 |
| Rice colour | ||
| L* | 27.78 | 20.61 |
| a* | 3.89 | 3.74 |
| b* | 2.66 | 1.81 |
| Cooked rice colour | ||
| L* | 18.10 | 22.28 |
| a* | 7.02 | 8.64 |
| b* | 1.85 | 3.69 |
| Hardness of cooked rice (N) | 154.90 | 101.80 |
| Chewiness of cooked rice (N) | 80.66 | 49.04 |
Conclusion
The optimum process parameters of parboiled black rice were obtained with 3.8% sodium citrate concentration, 5 minute steaming time under 1.1 bar pressure, and 3.8 times freezing-thawing cycles. This condition resulted the best response on 25.84 minute cooking time, 4.93 total colour difference of cooked rice, 101.80 N hardness of cooked rice, 49.04 N chewiness of cooked rice and 5.32 kg rice grain hardness.
Acknowledgements
Facilities provided by Agroindustry Laboratory, Technology Research and Application Body (BPPT), PuspiptekSerpong, South Tangerangare gratefully acknowledged.
References
- Shao Y., Xu F., Sun X., Bao J., Beta T. Identification and quantification of phenolic acids and anthocyanins as antioxidants in bran , embryo and endosperm of white , red and black rice kernels ( Oryza sativa L .). J Cereal Sci. 2014;59(2):211-218. doi:10.1016/j.jcs.2014.01.004.
CrossRef - Liu R.H. Whole grain phytochemicals and health. J Cereal Sci. 2007;46(3):207-219. doi:10.1016/j.jcs.2007.06.010
CrossRef - Kushwaha S. Black Rice Research, History and Development. Cham (CH): Springer International Publishing AG; 2016. doi:10.1007/978-3-319-30153-2.
CrossRef - Luh B.S., Mickus R.R. 6. In: Rice: Production and Utilization. Westport, Connecticut (US): AVI Publishing; 1980.
- Buggenhout J., Brijs K., Celus I., Delcour J.A. The breakage susceptibility of raw and parboiled rice : A review. J Food Eng. 2013;117(3):304-315. doi:10.1016/j.jfoodeng.2013.03.009.
CrossRef - Rizk L.F., Doss H.A. Preparation of improved quick cooking rice. Food / Nahrung. 1995;39(2):124-131. doi:10.1002/food.19950390205.
CrossRef - Prima L., Herawati H., Widowati S., Prianto AB. Pengaruh Kandungan Amilosa Terhadap Karakteristik Fisik dan Organoleptik Nasi Instan. J Penelit Pascapanen Pertan. 2015;12(1):1-10.
CrossRef - Prasert W., Suwannaporn P. Optimization of instant jasmine rice process and its physicochemical properties. J Food Eng. 2009;95(1):54-61. doi:10.1016/j.jfoodeng.2009.04.008.
CrossRef - Le T.Q., Jittanit W. Optimization of operating process parameters for instant brown rice production with microwave-followed by convective hot air drying. J Stored Prod Res. 2015;61:1-8. doi:10.1016/j.jspr.2015.01.004.
CrossRef - Szczesniak A.S. Texture is a sensory property. Food Qual Prefer. 2002;13(4):215-225. doi:10.1016/S0950-3293(01)00039-8.
CrossRef - Fofana M., Mele V. Effect of improved parboiling methods on the physical and cooked grain characteristics of rice varieties in Benin. Int Food Res J. 2011;18:715-721.
- Erywiyatno N., Kristianto Y. Pengaruh Bahan dan Konsentrasi Perendam Na2HPO4 dan Na5P3O10 Terhadap Mutu, Fisik, Kimiawi, dan Mutu Organoleptik Beras Instan. Media Gizi Kel. 2003;27(2):86-92.
- Husain H., Muchtadi T.R., Sugiyono S., Haryanto B. Pengaruh Metode Pembekuan dan Pengeringan Terhadap Karakteristik Grits Jagung Instan. J Teknol dan Ind Pangan. 2007;17(3):189-196.
- Miao W., Wang L., Xu X., Pan S. Evaluation of cooked rice texture using a novel sampling technique. MEASUREMENT. 2016;89(C):21-27. doi:10.1016/j.measurement.2016.03.072.
CrossRef - Villwock V.K., Bemiller JN. Effects of Salts on the Reaction of Normal Corn Starch with Propylene Oxide. Starch – Stärke. 2009;57(7):281-290. doi:10.1002/star.200400384.
CrossRef - Wang W., Zhou H., Yang H., Cui M. Effects of salts on the freeze-thaw stability, gel strength and rheological properties of potato starch. J Food Sci Technol. 2016;53(9):3624-3631. doi:10.1007/s13197-016-2350-5.
CrossRef - Kristamtini K., Taryono T., Basunanda P., Murti R.H. Keragaman Genetik dan Korelasi Parameter Warna Beras dan Kandungan Antosianin Total Sebelas Kultivar Padi Beras Hitam Lokal. J Ilmu Pertan. 2014;17(1):90-103.
- Wu K., Gunaratne A., Gan R., Bao J., Corke H. Relationships Between Cooking Properties and Physicochemical Properties in Brown and White Rice. Starch – Stärke. 2018;70:1-8. doi:10.1002/star.201700167.
CrossRef
Accepted on: 19-04-2019
Second Review by: Prof. B. M. Devani India
Final Approval by: Prof. Carlos A. F. Oliveira


Web of Science Coverage
Emerging Sources Citation Index (ESCI)
2024 Journal Impact Factor: 1.1
Scopus Journal Metrics
CiteScore 2025: 2.6
CiteScore Details
Sustainable Nutrition: Food Systems, Nutrient Retention, and Public Health Impact
![]()
This journal is a member of, and subscribes to the principles of, the Committee on Publication Ethics (COPE)


