Energy and Nutrient intake and Dietary Diversity among Female Residential Students of Bangladesh
Marjia Sultana1
, Nazma Shaheen2 1Department of Food Technology and Nutrition Science, Noakhali Science and Technology University, Noakhali-3814, Bangladesh
2Institute of Nutrition and Food Science, University of Dhaka, Dhaka-1000, Bangladesh
Corresponding Author Email: towhidhasan07@gmail.com
DOI : http://dx.doi.org/10.12944/CRNFSJ.7.1.24
Download this article as:
![]()
The efficacy of nisin (25-75 ppm) and effect of storage time on quality attributes of micro-filtered coconut water during refrigerated storage (4°C) for 8 days was investigated in terms of total viable counts, colour, turbidity and overall sensory acceptance. All treatments significantly retarded the bacterial growth in coconut water during storage when compared to the control sample (p < 0.05). The samples treated with 50 and 75 ppm nisin had significantly lower aerobic microbial counts than the control (p < 0.05) without affecting colour, turbidity and sensory acceptability. The treated samples also had the significantly higher scores in overall acceptance than the control sample after 7 days of storage.50 ppm Nisin was suggested to be applied in micro-filtered coconut water without effects on colour, turbidity, and sensory acceptability by a reduction in changes of the microbial growth during the refrigerated storage.
KEYWORDS:Bangladesh; Energy and Nutrient Intake; Dietary Diversity; University Students
Introduction
The students’ community at any campus forms a model average of the adult population as they are drawn from various regions of a country belonging to quite diverse geographical and socio-economic background. The majority of students experience significant transitions and challenges as they enter into a new life stage during their academic period in universities. Residing in university dormitory makes a student’s life independent from their families and friends back home, but lacking in support from them creates bodily and psychological stresses related to their new life adaptation. This can reshape their social and environmental situation affecting their ability to embrace healthy behaviors1and may lead to undesirable changes in their eating pattern and dietary intake, altering their nutritional status and thus, overall health and well-being.2
Female residential students usually consume food supplied either by the dormitory cafeteria or by their self-cooking or by both. Many studies have reported that diet quality may change in this period resulting in the recommended dietary guidelines not being fulfilled1. But owing to their prominent reproductive and productive roles in society, they demand special nutritional needs. Yet, due to a lack of nutritional knowledge and awareness, some young female’s dietary patterns include the avoidance of micronutrient-rich animal foods (i.e. meat, fish, and poultry etc.), and more consumption of plant food-based diets comprising cereal grains mainly starchy staples, pulses and legumes, seeds and vegetables.3 This kind of poor dietary practices may lead to a negative impact on their nutritional status predisposing them to certain specific health problems including micronutrient malnutrition such as vitamin A deficiency, iron deficiency anaemia, osteoporosis etc.4, 5Also, eating behaviour of this type can affect long-term health resulting into future poor maternal health and pregnancy outcome. So, the adequacy of the diet is very crucial which can fulfil their dietary requirements properly, as recommended and advocated by the health professionals.
There lies a paucity of data on food and nutrient intake pattern and nutrient adequacy of the female residential students of Bangladesh. Hence, the present research examined a number of students from three female residences of a public university of Bangladesh to observe the consumption of different food groups along with their macro- and micronutrients intake, and to investigate whether their nutritional requirement is fulfilled or not. Findings of this study could be critical to formulating the appropriate intervention programs to educate the female residential students about the health benefits of a nutritious and balanced diet.
Materials and Methods
Study design and subjects
This cross-sectional study was carried out enrolling 180 female students between 18-26 years of age staying in three female dormitories of a public university in Bangladesh with the availability of cooking facilities. Information was collected from January to March 2016 drawing an equal number of subjects from each dormitory (60 subjects in each) by simple random sampling using lists of names provided by each dormitory office. The study was conducted after proper ethical approval by the Ethical Review Committee, Faculty of Biological Science of that university. Respondents were well-informed about the study prior to collecting data, and written consent was taken from each respondent. Both structured and semi-structured questionnaires were used in the process of data collection.
Dietary Assessment
Dietary history was recorded for three consecutive days (two weekdays and one weekend) using a structured Multiple-Pass 24-h recall questionnaire, validated previously,6 based on food obtained from hall cafeteria or self-cooking. The three days’ dietary data were averaged to calculate the mean 24-h dietary intake for each respondent. The usual intake of energy, macronutrients, and micronutrients was calculated using the data of the mean 24-h dietary intake and “Food Composition Table for Bangladesh (FCTB)”.7
Dietary Diversity Score
For every respondent, an individual DDS being assessed adopting the food groups from the Food and Agriculture Organization (FAO) guidelines.8 DDS was constructed applying 9 food group indicators comprised starchy staples (i.e. wheat, potato, riceetc.), pulses and legumes, nuts and seeds, eggs, milk and dairy products, organ meats, flesh foods (meat and fish), dark green leafy vegetables, other vitamin A-rich fruits and vegetables, and other fruits and vegetables. The potential score range was 0 to 9. The highest score a respondent could acquire on each day was therefore 9, with a score of 1 being attributed to any one food group consumed. Respondents were questioned about their past 24-h food consumption that whether they had consumed each of the listed food groups or not. DDS was computed by adding each day consumption of the number of food groups and averaging the three days.
Nutrient adequacy ratio
The 24-h dietary recall information was utilized to calculated the nutrient adequacy ratio (NAR) for 13 nutrients. The NAR for a particular nutrient was obtained by dividing the respondent’s intake to the reference intake of that nutrient for the respondent’s age.9, 10 The mean adequacy ratio (MAR) was determined as an aggregate value of the nutrient adequacy. NAR was abbreviated at one in order that a nutrient with a lower NAR could not be recompensed by a nutrient with a higher NAR.11
MAR= (ΣNAR (each truncated at 1))/(Number of nutrients)
The age and sex-specific reference values were used to estimate the recommended intake of nutrients.12-14
Anthropometry
Anthropometric measurements were taken following standardized procedures recommended by WHO.15 Hanson HX6000 electronic scale was used to measure weight and locally produced portable wooden stick furnished with height gauges (SECA 206 Bodymeter) was used to measure height. Weight measurement was taken to the closest100 g and height to the closest 1 mm. The respondent’s nutritional status was addressed using the classification of Body Mass Index (BMI) which was computed as weight (kg)/height2 (m2). Respondents with a BMI lower than 18.5 kg/m2 were recognized as underweight, those having BMI 18.5-24.9 kg/m2considered normal, between BMI 25.0-29.9 kg/m2 as overweight, while those with BMI ≥30.0 kg/m2 were regarded as obese.16
Data Analysis
All analyses were conducted usingSPSS/PC (version 25.0) statistical package,17 with statistical significance accepted at P 0.05 for all tests. Mean and standard deviation (SD) were employed for normally distributed continuous data, median and interquartile range (IQR) for non-normal data, and frequency distributions for categorical data. The association between MAR and DDS was measured by applying Spearman’s rho correlation.
Results
Respondent characteristics
Table 1 displays the socio-demographic characteristics of the respondents. About 40% of the respondents were between 21-23 years of age while 32% were 20 years and 28% were greater than 23 years of age. Most (70%) of the respondents were between normal nutritional status (BMI 18.5-24.9 kg/m2) while about 24% were found underweight (BMI <18.5 kg/m2) and about 9% being overweight and obese(BMI ≥25.0 kg/m2). About 98.89% of the respondents were non-smokers. The mean DDS was found at 4.84 1.02.
Table 1: The socio-demographic, anthropometric and relevant characteristics of the female residential students
| Characteristics | % or Mean (SD) |
| Age, years | |
| ≤20 | 32.2 |
| 21-23 | 40.0 |
| >23 | 27.8 |
| BMI (kg/m2) | |
| Underweight(<18.5) | 23.9 |
| Normal (18.5-24.9) | 70.0 |
| Overweight and obese (≥25.0) | 9.1 |
| Smoking Status | |
| Yes | 1.1 |
| No | 98.9 |
| Dietary Diversity Score (DDS) | 4.84 (1.02) |
Dietary Diversity
The respondents’ consumption of different food groups varied between 3 to 7 food groups per day. About 10% of the respondents had consumed the least number of food groups (DDS 3) over the reference time while food groups count was the highest(DDS 7) in about 4% of the respondents (Figure 1).
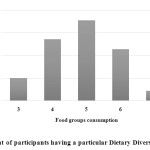 |
Figure 1: Percent of participants having a particular Dietary Diversity Score (DDS) Click here to View figure |
Food group intake pattern
Table 2exhibits the food groups along with their amounts consumed by the respondents. All respondents had consumed starchy staples, dark green leafy vegetables, other vitamin A-rich fruits and vegetables (carrot, pumpkin), and other fruits and vegetables (tomato, eggplant). Starchy staples were consumed in the highest amount (299.31 g/d). Most of the respondents were reported to consume legumes, nuts and seeds (92.22%), meat and fish (97.78%), eggs (95.56%) and milk and milk products (89.44%) groups with the average intake of 18.11 g/d, 33.07 g/d, 30.38 g/d and 21.16 ml/d, respectively. No respondents consumed organ meat during the reference period.
Table 2: Food groups along with their amounts consumed by female residential studentsa
| Food groups | Food group consumptionn (%) | Amount consumed(Mean SD) |
| Starchy staples (g/d*) | 180 (100) | 299.31 78.54 |
| Legumes, nuts and seeds (g/d) | 166 (92.22) | 18.11 12.02 |
| Dark green leafy vegetables (g/d) | 180 (100) | 22.59 11.64 |
| Other vitamin A rich fruits and vegetables (g/d) | 180 (100) | 11.29 5.82 |
| Other fruits and vegetables (g/d) | 180 (100) | 79.05 40.73 |
| Meat and fish (g/d) | 176 (97.78) | 33.07 15.29 |
| Eggs (g/d) | 172 (95.56) | 30.38 14.60 |
| Milk and milk products (ml/d) | 161 (89.44) | 21.16 39.34 |
aOrgan meat group is not included as none of the respondents consumed that group
*g/d = grams per day
Energy and nutrient intake and nutrient adequacy
The median energy intake of the respondents was1406.92 kcal/d and no respondents met the reference intake value of 2100 kcal/d.14 The respondents’ median protein intake was 38.58 g/d and only 3.33% attained the required protein intake (55 g/d). Almost all respondents (97.78%) met their reference requirement for fat intake (25 g/d) with a median intake of 38.05 g/d (Table 3).
According to FAO/WHO guideline,18 55-75%, 10-15%, and 15-30% energy should come from carbohydrate, protein and fat respectively. When the contribution of energy is calculated from carbohydrate, protein, and fat as a percentage of total calorie, the ratio of carbohydrates:protein: fatwas found to be 66:11:23 (percentages) of total intake. So, the contribution of energy from dietary macronutrients of the respondents was near to satisfactory.
Table 3 also shows the daily intake of vitamin and minerals of the respondents and dietary NAR. All the respondents had a nearly sufficient intake of vitamin C with a NARclose to 1 and about 36% respondents could meet their required amount based on the Recommended Nutrient Intake (RNI). Based on the reference intake values for important nutrient i.e. minerals and vitamins, calcium, iron, zinc, and vitamin A consumption were fulfilled by 0, 0.56, 1.67 and 3.33% of the respondents. Among the nutrients, the median NAR was the lowest for calcium(only 0.16) followed by folate and vitamin A (NAR 0.27 and 0.31, respectively).
Table 3: Energy and nutrients consumption along with their recommended intake and estimated prevalence of adequacy of the nutrient intake among female residential students
| Intake/p/d[Median (IQR)] | Reference value | Median NAR | % of respondentsmeeting the reference value | |
| Energy (kcal/d) | 1406.92 (985.85-1969.18) | 2100*** | 0.67 | 0 |
| Protein (g/d) | 38.58 (25.30-60.91) | 55* | 0.70 | 3.33 |
| Fat (g/d) | 38.05 (19.67-63.88) | 25* | 1.0 | 97.78 |
| Carbohydrate (g/d) | 222.89 (142.37-325.96) | – | – | – |
| Vitamin A (µg RE/d) | 157.23 (21.89-843.06) | 500** | 0.31 | 3.33 |
| Vitamin C (mg/d) | 38.79 (11.67-74.43) | 45** | 0.86 | 36.11 |
| Thiamin (mg/d) | 0.83 (0.49-1.36) | 1.1** | 0.75 | 6.11 |
| Riboflavin (mg/d) | 0.63 (0.38-1.53) | 1.1** | 0.57 | 3.89 |
| Niacin (mg/d) | 10.77 (5.89-30.4) | 14** | 0.77 | 4.44 |
| Folate (µg/d) | 109.93 (52.98-291.62) | 400** | 0.27 | 0 |
| Vitamin B12(µg/d) | 0.93 (0.57-2.27) | 2.4** | 0.38 | 0 |
| Iron (mg/d) | 6.72 (3.54-21.79) | 21* | 0.32 | 0.56 |
| Zinc (mg/d) | 6.35 (4.17-20.28) | 10* | 0.64 | 1.67 |
| Calcium (mg/d) | 161.56 (80.16-503.95) | 1000** | 0.16 | 0 |
*Recommended Nutrient Intake (RNI) was used as reference for iron and zinc intake, and Recommended Dietary Allowance (RDA) of was used as reference forprotein and fat intake for 18-28 years women12
**RNI was used as reference value for 18-28 years women13
***Recommended energy requirement for 18-28 years women14
Note: RE = retinol equivalent, μg/d = microgram per day, mg/d = milligram per day, kcal/d = kilocalorie per day
In total, the mean MAR was found 0.58 0.09 (Table 4). A standard cut-off value of 1 for nutrient adequacy indicates the incorporation of all nutrients. In the present study, no respondents could achieve that value. Sixty-two percent of the respondents were reported to have a MAR higher than or equal to 0.55; 42% had a MAR value of 0.60, and a MAR value of greater than or equal to 0.70 was found in only 11% of the respondents.
Table 4: Mean Adequacy Ratio (MAR) of nutrients among female residential students
| % or Mean (SD) | |
| Mean Adequacy Ratio (average) | 0.58 (0.09) |
| MAR 0.55 | 62.00 |
| MAR 0.60 | 42.00 |
| MAR 0.70 | 11.00 |
Association between nutrient adequacy and dietary diversity
Table 5represents the association between DDS and the nutrient sufficiency indicated as NAR for various nutrients. All correlations were found significant (P<0.05) except for fat, especially for calcium, iron, thiamin, riboflavin, folate, and vitamin A (P<0.001).
MAR, as an aggregate value for the nutritional sufficiency of the diet, was strongly associated with DDS having a correlation coefficient (r) value of 0.38 (P<0.001).
Table 5: Spearman’s rho correlation coefficient (r) ofNutrient Adequacy Ratio (NAR) of certain nutrientswith total Dietary Diversity Score (DDS) of female residential students
| NAR | r |
| Energy (kcal/d) | 0.24** |
| Protein (g/d) | 0.25** |
| Fat (g/d) | 0.08 |
| Vitamin A ( g RE/d) | 0.47*** |
| Vitamin C (mg/d) | 0.17* |
| Thiamin (mg/d) | 0.27*** |
| Riboflavin (mg/d) | 0.46*** |
| Niacin (mg/d) | 0.15* |
| Folate ( g/d)) | 0.31*** |
| Vitamin B12( g/d) | 0.21** |
| Iron (mg/d) | 0.36*** |
| Zinc (mg/d) | 0.21** |
| Calcium (mg/d) | 0.46*** |
| Mean Adequacy Ratio (MAR) | 0.38*** |
*P 0.05; **P 0.01; ***P 0.001
Figure 2 demonstrates the association of DDS with NARs of energy, protein, and minerals. With the increase of DDS, an increment in NAR was observed for all nutrients.
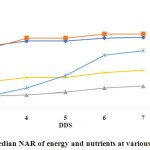 |
Figure 2: Median NAR of energy and nutrients at various points of DDS Click here to View figure |
An amelioration in NARfor all vitamins was also evident as DDS augmented (except for vitamin C). No vitamin reached a NAR value of 1.00 (Figure 3).
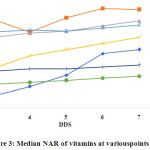 |
Figure 3: Median NAR of vitamins at various points of DDS Click here to View figure |
Discussion
Balanced diets and nutrients adequacy are currently getting much attention. This study reports the food consumption habits of female students living university dormitories. Being better educated, university students typically constitute a standard sample for evaluating food intake behaviours, as there exist minimum variability of health and education.
The present study found that cereal-based foods especially rice serves as the primary origin for energy in the diets of the respondents. According to Household Income and Expenditure Survey (HIES) 2010 for Bangladesh,6 the mean calorie intake of an adult female, aged 18-30 years, was about 2049 kcal/d and thus respondent’s energy intake (about 1406.92 kcal/d) was about 31.34% lower as compared to national level. This low energy intake might be due to the fact that the residential students consumed less amount of food than required either a result of the economic barrier or over the consciousness of body size.19
For the proper fulfilment of the daily requirement, it is necessary to consume 55 g/d protein and 66.26 g/d protein consumption was reported in national data.6 This national protein intake is much higher than the present study found (only 38.58 g/d protein). This lower intake of protein might be due to the fact that they consume less protein-rich food (i.e. meat, fish, poultry, milk and dairy products) than they should consume because they might not aware of protein quality of foods.1 Also, the average intake of calcium, zinc, iron, vitamin A, thiamin, riboflavin, niacin, folate, vitamin B12, and vitamin C have also found lower than national data.6 This reason behind less intake of micronutrient-rich food might be that they consumed micronutrient-rich food but in lesser proportion as a result of lack of awareness on micronutrient-rich foods or the benefits of micronutrients in human health.20
The present study illustrates that dietary diversity has a positive association with MAR in female residential students. Our study findings corroborate the results of other studies from different countries.11, 21, 22 Thus, the use of dietary diversity as a measure to conjecture dietary quality is very practical in this population. Being a simple and easy method, DDS is supposed to be utilized in future research to assess the nutritional sufficiency of a diet. The present research along with other studies showed a significant positive association of nutrient adequacy ratio with dietary diversity score.11, 23, 24 The dietary diversity score of the female dormitory students is reported to be 4.84 1.02 (Table 1). The result is similar to some other studies conducted among Bangladeshi women.25, 26 This medium dietary diversity score among female residential students might be due to the fact that the residential students had to consume the foods which they could prepare by themselves or bought from the hall-cafeteria, and in both of the cases, the food choice is limited.
Conclusion
Although the DDS cannot provide a complete scenario of the sufficiency of the nutrient consumption, the findings of the present research illustrate that simple counts of food items can be applied to indicate nutrient sufficiency of the diet of female residential students of Bangladesh as indicated by FAO. However, such indicator is particularly important in identifying the adequacy of trace elements such as iron, zinc, and calcium, and these intakes should be of concern if similar diet selection is to be practised over a long period. It is because if the diet lacks one or more micronutrients and this dietary habit continues for a longer period, one may become the prey to micronutrient deficiency. This is the case for female residential students as the present study found that their micronutrient intakes were low and many could not meet the requirements for various nutrients. They are at risk of developing micronutrient malnutrition if the current dietary pattern is followed. The present dietary and health status of female residential students could be attributed to their awareness level on the importance and benefit of a nutritious and balanced diet in the betterment of the health of women of reproductive age. Hence, one recommendation is to educate the students about the nutritious foods enabling them to make a wiser selection of foods from available.
Conflict of Interest
The authors’ have no conflict of interest to declare.
References
- Fayet F., Flood V., Petocz P., Samman S. Avoidance of meat and poultry decreases intakes of omega-3 fatty acids, vitamin B12, selenium and zinc in young women. J Hum Nutr Diet. 2014;27 Suppl 2:135-142.
CrossRef - Papadaki A., Scott J. A. The impact on eating habits of temporary translocation from the Mediterranean to a Northern European environment. Eur J Clin Nutr. 2002;56(5):455-461.
CrossRef - Fayet-Moore F., Petocz P., Samman S. Micronutrient Status in Female University Students: Iron, Zinc, Copper, Selenium, Vitamin B12 and Folate. 2014;6(11):5103-5116.
CrossRef - Norhaizan M. E., Jr., Nor Faizadatul Ain A. W. Determination of phytate, iron, zinc, calcium contents and their molar ratios in commonly consumed raw and prepared food in Malaysia. Malays J Nutr. 2009;15(2):213-222.
- Kinyua L. W. Association of Nutrition Knowledge and Attitude with Dietary Practices and Nutritional Status of Female Undergraduate Students Attending University Colleges within Nairobi Metropolis. University of Nairobi, Kenya; 2013.
- Household Income and Expenditure Survey 2010. Bangladesh Bureau of Statistics;2010.
- Shaheen N., Rahim A. T. M., Mohiduzzaman M., et al., Food Composition Table for Bangladesh. Institute of Nutrition and Food Science, Centre for Advanced Research in Sciences;2013.
- Kennedy G., Ballard T., Dop M. C. Guidelines for measuring household and individual dietary diversity. Food and Agriculture Organization of the United Nations;2011.
- Madden J. P., Goodman S. J., Guthrie H. A. Validity of the 24-hr. recall. Analysis of data obtained from elderly subjects. J Am Diet Assoc. 1976;68(2):143-147.
- Guthrie H. A., Scheer J. C. Validity of a dietary score for assessing nutrient adequacy. J Am Diet Assoc. 1981;78(3):240-245.
- Hatloy A., Torheim L. E., Oshaug A. Food variety–a good indicator of nutritional adequacy of the diet? A case study from an urban area in Mali, West Africa. Eur J Clin Nutr. 1998;52(12):891-898.
CrossRef - Nutrient requirements and recommended dietary allowances for Indians. A Report of The Expert Group of The Indian Council of Medical Research: National Institute of Nutrition, Indian Council of Medical Research;2010.
- FAO/WHO. Vitamin and mineral requirements in human nutrition. Report of a joint FAO/WHO expert consultation: Bangkok, Thailand;2004.
- FAO/WHO/UNU. Human energy requirements. Report of a Joint FAO/WHO/UNU Expert Consultation: FAO, Rome;2001.
- Physical status: the use of and interpretation of anthropometry. Report of a WHO Expert Committee: WHO Technical Report Series: 854;1995.
- Obesity: preventing and managing the global epidemic. Report on a WHO Consultation on Obesity: Geneva, World Health Organization;1998.
- SPSS 25.0 for Windows. SPSS Inc., Chicago, IL, USA, 2017.
- Diet, nutrition and the prevention of chronic diseases. Report of a Joint WHO/FAO Expert Consultation: Geneve, World Health Organization;2003.
- Neslisah R., Emine A. Y. Energy and nutrient intake and food patterns among Turkish university students. Nutr Res Pract. 2011;5(2):117-123.
CrossRef - Desirable Dietary Pattern for Bangladesh. Bangladesh Institute of Research and Rehabilitation in Diabetes, Endocrine and Metabolic Disorders;2013.
- Mirmiran P., Azadbakht L., Esmaillzadeh A., Azizi F. Dietary diversity score in adolescents – a good indicator of the nutritional adequacy of diets: Tehran lipid and glucose study. Asia Pac J Clin Nutr. 2004;13(1):56-60.
- Torheim L. E., Ouattara F., Diarra M. M., et al., Nutrient adequacy and dietary diversity in rural Mali: association and determinants. Eur J Clin Nutr. 2004;58(4):594-604.
CrossRef - Marshall T. A., Stumbo P. J., Warren J. J., Xie X. J. Inadequate nutrient intakes are common and are associated with low diet variety in rural, community-dwelling elderly. J Nutr. 2001;131(8):2192-2196.
CrossRef - Krebs-Smith S. M., Smiciklas-Wright H., Guthrie H. A., Krebs-Smith J. The effects of variety in food choices on dietary quality. J Am Diet Assoc. 1987;87(7):897-903.
- Shamim A. A., Mashreky S. R., Ferdous T., et al., Pregnant Women Diet Quality and Its Sociodemographic Determinants in Southwestern Bangladesh. Food Nutr Bull. 2016;37(1):14-26.
CrossRef - Arimond M., Wiesmann D., Becquey E., et al., Simple food group diversity indicators predict micronutrient adequacy of women’s diets in 5 diverse, resource-poor settings. J Nutr. 2010;140(11):2059s-2069s.
CrossRef
Accepted on: 16-04-2019
Second Review by: Dr. Sophie Ochola Kenya
Final Approval by: Dr. Rajesh Jeewon


Web of Science Coverage
Emerging Sources Citation Index (ESCI)
2024 Journal Impact Factor: 1.1
Scopus Journal Metrics
CiteScore 2025: 2.6
CiteScore Details
Sustainable Nutrition: Food Systems, Nutrient Retention, and Public Health Impact
![]()
This journal is a member of, and subscribes to the principles of, the Committee on Publication Ethics (COPE)


