Conditions surrounding beverage consumption by the French
Jean-Michel Lecerf1*
, Pascale Hebel3 1Institut Pasteur de Lille, Lille, France
2Department of educational sciences, Paris, France
3Research center CREDOC, Paris, France
Corresponding Author Email: jean-michel.lecerf@pasteur-lille.fr
DOI : http://dx.doi.org/10.12944/CRNFSJ.7.1.12
Download this article as:
![]()
Drinking of beverages is often studied from the perspective of fluid intake or nutritional input, but rarely in terms of the nature and type of the drinks consumed. Yet the choice of drinks consumed is highly influenced by contexts relating to social, behavioral and psycho-emotional factors that are specific for each type of beverage, the associated setting, and the individual. To analyze this, we conductedtwo quantitativesurveys regarding beverage consumption with two samples representative of the French population that had a similar size and age group (20 – 54 years of age). Drinking categories were defined and analyzed by Principal Components Analysis according to two axes (non-alcoholic soft drinks – alcoholic and hot drinks – fruit juice). The benefit sought for each type of beverage and the circumstances associated with a specific type of beverage (social experience) were identified, and this allowed each type of beverage to be clearly categorized. These findings provide new perspectives in terms of educational and public health strategies.
KEYWORDS:Beverage Consumption; Consumer’s Typology; Drinking Context; Fluid Intake; Sociology
Introduction
The consumption of beverages is often neglected in studies of food intake and nutrition. Is what is drunk less relevant than what is eaten? There have long been many studies of beverage consumption in the context of at-risk behaviour,1 age-related vulnerabilities24 and chronic diseases.4 In previous decades many studies were performed on food behaviour and dietary habits in order to define dietary patterns. The common trends revealed by these studies from various Western countries mainly come down to the gender-based differences in consumption5 or the individual’s or family’s socioeconomic status.6
Although the context of beverage consumption and factors influencing the choice of beverages are of particular relevance, few studies have addressed this.7 Yet these factors underlie drinking behaviours, and could, therefore, help explain the type of beverages consumed, the quantities consumed and excessive consumption patterns. This could then guide the direction of health policies or educational measures by being able to take into account these differences in consumption trends.8,9
In this article, we report and analyze the results of two descriptive studies of beverage consumption by the French, based on nutritional and social science perspectives. The first study, Behavior, and Consumption of Food by the French (BCFF), was undertaken by the CREDOC (Study 1) and is a quantitative study involving 629 adults aged 20 -54 years old. This study aimed at precisely analyzing the context in which beverage consumption occurs. The second study was a qualitative study carried out for the European Hydration Institute (Study 2), undertaken in the same year (in 2013), with 556 adults aged 20-54 years old. This latter study aimed at analyzing the drinking of beverages in terms of the locations, the times as well as the effects sought or the feelings experienced. Thus, one of the aims of this work was to analyze the “what” and “why” of drinking.
Subjects and Methods
Study 1
The “Behavior and Consumption of Food by the French” (BCFF) investigation10,11 was undertaken by the CREDOC (Centre de Recherche pour l’Étude et l’Observation des Conditions de Vie), and matches actual individual consumption by the French people with their use and reported attitudes and behaviour. The consumption component consists of measuring actual consumption of ingested solids and liquids either at home or outside of the household.
Participants
The investigation was carried out with a nationally-representative sample of 1,222 households (units of live) in metropolitan France that were selected according the quota method (age and gender of the head of the household, their socio-professional category, the area of the residence, the size of the town, and the number of individuals in the household), calculated based on the results of the most recent census of the general population. To account for seasonal effects, the data collection was divided into four stages (approximately one-quarter of the sample was questioned at each stage).
All household members who were three years of age or above were questioned, as was an additional sample comprised of just children. In 2013, this yielded 2,117 adults aged 15 or above. “Underestimating” subjects were excluded from the analyses to eliminate underestimated food consumption from the investigations. This subpopulation exhibits a ratio of food-derived energy and base metabolism (which depends on gender, age, weight, and height) of less than 1.05. This rule has already been used in previous French investigations, such as the 1999 INCA investigation12 and the 1994 ASPCC 1994 investigation.13
The sample of normally-evaluating adults included 1,389 individuals aged 18 or above.
For this article, we derived information on adults of 20 to 54 years of age, amounting to 629 individuals.
Survey Design
The 2013 CCAF investigation was performed on site between October of 2012 and July of 2013, i.e. for a duration of 9 months in order to account for seasonal effects. It comprised of two components:
A “Behavior &Opinions” component: the information was collected “face-to-face” in the homes of the households questioned using two questionnaires with more than 120 questions. One “household” questionnaire queried the head of the household regarding meal purchases and/or preparation, and another “individual” questionnaire was given to each household member.
A “Food Consumption” component was recorded exhaustively over a period of 7 consecutive days using a consumption notebook (a paper notebook for 54% and online for 46% of the enquiries, according to the subject’s preference). Identification of the food and beverages, as well as the corresponding portions (types of glasses, cups, etc.) and numerical quantities, was assisted by the use of a SUVIMAX14 photography notebook (in paper format or an “online” picture equivalent version). Each drink consumed was recorded the same way as for solid food. Furthermore, the notebook allowed each intake to be recorded in terms of its setting (meals, between meals) and the place of consumption (at home, workplace, restaurant, etc.), social setting (alone, with family, with friends, etc.) and associated activities(e.g. watching television, etc.). The beverages were then classified into 6 categories: water (tap water, plain and sparkling bottled water), dairy-based products, fruit juices and nectars, non-alcoholic refreshing beverages or soft drinks, (sodas, lemonades, fruit drinks, iced tea, etc.), hot drinks including hot chocolate, coffee and tea with milk), and alcoholic drinks.
Fluid Intake
In 2010, the European Food Safety Authority (EFSA) published dietary reference values for total daily water intake as a function of age, gender and specific normal physiological conditions (e.g. pregnancy, breastfeeding, etc.).15 This intake includes water in drinks and derived from food. The reference value for men is 2.5 L and 2 L for women, of which approximately 80% comes from beverages.
Food Diversity
The food diversity score is defined as the number of different food categories (there are 5 of these: dairy products; meat fish and eggs; grain foods; fruit; vegetables) consumed at least once on 3 non-consecutive days: the 1st, 3rd and 5th day of the investigation (Chambolle et al., 1999).
Beverage Variety Index
According to the same principle as the food diversity score, we have created a variety index calculated over a period of three non-consecutive days: Tuesday, Thursday and Sunday (so the weekend is represented). This index represents the number of different drink types (out of 6) consumed at least once on these three days.
Statistical Analyses
SAS 9.2 software (SAS Institute Inc., USA) was used to carry out the statistical analyses, as well as the significance tests (Fisher or Student’s tests). The averages are presented in the figures. To determine the type of drinker, an analysis comprised primarily of the average consumption levels of the beverage types (alcoholic, water, hot drinks, juices and nectars, soft drinks, and dairy products) was undertaken. An ascending classification based on Principal Component Analysis (PCA) was then performed.
Study 2
The European Hydration Institute study performed by Harris Interactive Institute matches the stated beverage consumptions with the representations that the French have regarding this topic. It enables correlations to be made between drinking and the time/place of consumption, the desired effects as well as the feelings experienced.
Participants
The investigation was performed online in September 2013 with a nationally-representative sample of 556 individuals between 20 and 54 years of age. As with Study 1, the individuals were selected according to the quota method and data collection applied to the following variables: gender, socio-professional category, and region of the interviewee.
Survey Design
In the course of the first stage, a selection of a sample of potential targets was performed (random extraction or selection based on qualifying criteria), followed by an e-mail being sent to a small number of contacts to complete at least 20 questionnaires (called the “slow start” stage). The responses allowed the questionnaire to be tested so as to ensure that it was well understood and that it did not elicit specific comments, be it by the nature of the questionnaire, its design, or the phrasing of the questions. The necessary readjustments were made to the questionnaire if specific comments were made.
A second stage consisted of in-mailing all of the selected contacts for the investigation. Progress was monitored directly, and each completed questionnaire was validated and logged one at a time with the processing software for the investigation. The quotas could thus be followed in real time and, if need be, reminders could be sent out. The conventional methods for controlling the coordination of the questionnaires were used (starting with the response times or the response patterns, so as to eliminate those who replied too quickly or who provided an automatic response).
Specific measures were taken with the questionnaires to ensure that the responses to the inquiry were not compromised. This was specifically addressed as follows:
– Each e-mail sent had a personalized link based on a random username and a password. Thus, each invitation to participate in the investigation was “unique” and could be traced.
– By default, each question in a given questionnaire could only be answered once. Therefore, if there was an interruption while filling out the questionnaire, when it was clicked on again to continue answering it, the questionnaire took into account the previously answered questions and started off where the last question was answered, while disallowing any previously answered questions to be changed.
– The combination of these two measures precluded the same questionnaire from being filled out by different individuals, and it ensured that the answers were as valid and representative as possible.
The aim of the last stage of the investigation was to ensure management of the quotas and to send targeted reminders to non-responders and to those who had not finished filling out the questionnaire. Depending on the rate of returns, new contacts were solicited by e-mail.
When the desired sample size was met, the investigation platform was closed and the data exported for processing.
Statistical Analyses
Askia processing software was used for the statistical analyses (https://www.askia.com/analysis). This software can be used to sort the entire reference population or for crossed sorting to be performed. By highlighting the most substantial positive and negative results relative to the average of the answers, the latter can be used to rapidly discern differences between subpopulations.
Results
Study 1
The quantity of beverage drunk by French adults was 1,282 ml/day, on average, of which a bit less than half was tap and bottled water (Table 1). The frequency of consumption of the beverages, that is to say, whether a beverage was consumed at least once per week, was 94% for water and 81% for hot drinks, while the other beverages were between 54 and 58%.
Table 1: Frequency of consumption, number of intakes per week according to the type of drink and the average quantities consumed in ml/day according to the drink consumed and the sociodemographic criteria. (Study 1)
| Total | Water | Hot drinks | Juice and nectars | Soft drinks | Dairy-based drinkers | Alcoholic drinks | |
| Frequency of consumption of the beverages (>1 time/week) | 100% | 94% | 81% | 54% | 56% | 58% | 58% |
| Number of times consumed over 7 days | 33.1 | 12.8 | 8.5 | 2.3 | 2.6 | 3.7 | 3.2 |
| 20 – 54 years | 1282 | 558 | 292 | 67 | 111 | 151 | 104 |
| 20 – 34years | 1292 | 590.7 | 207.6 | 87.4 | 154.7 | 163.5 | 87.7 |
| 35 – 54years | 1275 | 535.8 | 348.0 | 52.7 | 82.5 | 142.3 | 114.1 |
| ♂ | 1328 | 562.3 | 300.0 | 59.5 | 120.1 | 145.4 | 141.1 |
| ♀ | 1240 | 553.5 | 284.9 | 72.9 | 103.2 | 155.5 | 69.6 |
| Couple without child | 1348 | 588.3 | 317.0 | 78.8 | 131.4 | 109.0 | 123.4 |
| Couple with a child | 1221 | 540.7 | 277.4 | 61.1 | 100.8 | 151.5 | 89.9 |
| Single-parent family | 1226 | 575.1 | 212.6 | 61.5 | 149.8 | 170.0 | 56.6 |
| Single | 1370 | 562.9 | 367.0 | 69.0 | 79.6 | 137.2 | 154.3 |
| No children | 1373 | 573.6 | 333.3 | 74.6 | 113.0 | 144.2 | 134.1 |
| one child | 1277 | 564.1 | 283.2 | 64.1 | 102.9 | 161.6 | 101.1 |
| two children | 1191 | 542.6 | 252.0 | 58.1 | 116.8 | 161.0 | 60.4 |
| three or more | 1175 | 524.4 | 254.1 | 61.1 | 112.0 | 133.3 | 90.2 |
| Active (more than 4h of sporting activity per week) | 1338 | 556.9 | 267.5 | 70.4 | 106.7 | 135.7 | 104.6 |
| Less active | 1242 | 558.7 | 326.9 | 60.9 | 117.6 | 172.0 | 102.2 |
| Low BMI | 1129 | 416.7 | 345.7 | 58.4 | 150.8 | 77.3 | 79.7 |
| Normal BMI | 1234 | 538.6 | 278.9 | 71.3 | 106.6 | 131.4 | 106.8 |
| BMI 25 – 30 | 1381 | 615.2 | 308.7 | 57.7 | 109.9 | 188.0 | 101.7 |
| BMI > 30 | 1417 | 601.3 | 300.9 | 65.6 | 126.1 | 222.2 | 100.8 |
Source: BCFF investigation 2013, CRÉDOC.
| Socio-professional category | |||||||
| Agriculture worker, craftsman, businessman, company director | 1351 | 735.3 | 249.0 | 61.43 | 122.6 | 129.2 | 53.2 |
| Upper-level manager or intellectual profession, accredited profession | 1241 | 521.6 | 290.7 | 61.99 | 91.8 | 139.1 | 135.6 |
| Mid-level profession | 1315 | 592.4 | 321.2 | 70.9 | 76.9 | 129.2 | 124.3 |
| Employee | 1226 | 522.1 | 287.8 | 70.7 | 108.1 | 138.6 | 98.2 |
| Labourer | 1298 | 516.5 | 302.5 | 73.8 | 123.7 | 186.7 | 94.4 |
| Not relevant / Inactive | 1364 | 640.0 | 260.6 | 38.2 | 193.6 | 160.9 | 70.4 |
| Time spent in front of a screen Less sedentary | 1294.5 | 623.1 | 276.5 | 65.3 | 81.5 | 150.2 | 97.9 |
| More sedentary | 1274.23 | 518.5 | 301.4 | 67.2 | 129.1 | 151.0 | 107.0 |
| Smoker | 588.3 | 317.0 | |||||
| YES | 1348 | 540.7 | 277.4 | 56.5 | 135.0 | 142.9 | 141.7 |
| NO | 1238 | 575.1 | 212.6 | 73.4 | 95.8 | 156.6 | 78.5 |
The total quantity of beverages consumed was highest for: the 20-34 age group vs. the 35-54 age group, men vs. women, couples without children and singles vs. couples with children and single-parent family members, adults without children or with one child vs. 2 children or more, people who are more physically active vs. the less active ones, people with a high BMI vs. a normal or low BMI (Table 1). On the other hand, there was no difference in the total consumption of beverages according to the socioeconomic category, the time spent in front of a screen, and whether or not they smoked.
Significant differences were seen, however, for the type of beverage consumed under numerous conditions. The 20-34 age group consumed fewer hot drinks and more juices, nectars and soft drinks than the 35-50 age group. Men consumed two times more alcoholic beverages than women. Single-parent family members consumed more dairy-based drinks than couples without children and fewer alcoholic beverages than singles. Individuals in families with more than 2 children consumed more dairy-based drinks than individuals in families without children. Subjects who had more physical activity consumed more hot drinks than the less active ones. Subjects with a low BMI consumed less water than overweight or obese individuals, and fewer dairy-based beverages and light soft drinks than the obese subjects.
Drink intake also varies according to the socio-economic category of consumers. For example, agricultural workers, craftsmen, business people, and company directors consumed more water than labourers; mid-level professionals consumed fewer soft drinks than those without a job (students, housewives, etc.). Those who were more sedentary consumed more water and more soft drinks than the less sedentary ones. Finally, the two socio-professional categories that have the closest drinking styles are the Mid-level profession and Upper-level manager or intellectual profession, accredited profession. Their trends are characterized by the consumption of water, hot drinks and juices and nectars which are average compared to other categories. In contrast, compared to other socio-economic backgrounds, their alcohol consumption is significantly higher and their consumption of soft drink much lower. Smokers consumed less water but more hot drinks, more soft drinks, and more alcoholic beverages than those who did not smoke.
Table 2: Distribution of the consumption of each type of beverage according to the time, the day of the week and the location where consumed (Study 1)
| Water | Hot drinks | Juice Nectars | Soft drinks | Dairy-based drinks | Alcoholic beverages | ||
| Breakfast Morning tea Lunch
Afternoon tea Tea party Dinner Evening snack Pre-dinner drinks |
3%4%41%
3% 5% 42% 3% 0% |
50%12%12%
9% 6% 7% 5% 0% |
58%3%14%
7% 3% 11% 0% 5% |
3%4%35%
6% 6% 36% 4% 6% |
73%4%3%
8% 4% 3% 3% 0% |
0%1%23%
1% 3% 38% 3% 30% |
|
| 100% | 100% | 100% | 100% | 100% | 100% | ||
| MondayTuesdayWednesdayThursday
Friday Saturday Sunday |
15.1%14.5%14.2%
14.5% 14.3% 13.3% 14.1% |
13.7%14.8%14.9%
14.6% 14.5% 14.1% 13.4% |
13.7%14.1%13.1%
14.9% 13.0% 15.2% 15.9% |
11.4%13.3%15.5%
13.0% 14.2% 19.0% 13.5% |
14.1%13.9%14.5%
15.1% 14.0% 14.3% 14.1% |
8%9.9%11.0%
11.1% 17.7% 24.8% 17.5% |
|
| 100% | 100% | 100% | 100% | 100% | 100% | ||
| Total | Water | Hot drinks | Juice and nectars | Soft drinks | Dairy-based drinks | Alcoholic beverages | |
| Away from home | 26% | 27% | 24% | 18% | 37% | 10% | 43% |
| At home | 74% | 73% | 76% | 82% | 63% | 90% | 57% |
Source: BCFF investigation 2013, CRÉDOC.
The time of day and the day of the week for consumption were very specific for each drink (Table 2). Water was consumed preferentially, and in an identical way, at lunch and dinner; half of the hot drinks were consumed in the morning with breakfast, while more than 2/3rds of soft drinks were consumed at noon and in the evening during mealtimes; ¾ of dairy-based drinks were consumed in the morning at breakfast, while alcoholic beverages were consumed at noon (23%), evenings (38%) and as pre-dinner drinks (30%). For alcoholic beverages, and to a lesser extent for soft drinks, an increasing level of consumption from Monday to Saturday was noticeable, with a small decrease on Sunday. For the other beverages, there was little variation in the distribution based on the day of the week. The site of consumption was very different according to the type of beverage (Table 2). The home/away from home ratio decreased in the following order: dairy-based drinks, juice, and nectars, hot drinks, water, soft drinks, alcoholic beverages.
Looking at the nutritional contribution of beverages (Table 3), all of the drinks together provided 204 Kcalories per day, on average, or about 10% of the total caloric intake. Alcoholic beverages contributed to 35% of caloric intake from beverages, dairy-based beverages 31%, soft drinks 19% and fruit juice and nectars 14%. In decreasing order, the contribution to fluid intake was as follows: water, hot drinks, dairy-based beverages, soft drinks, alcoholic beverages, juice, and nectars. The beverages provided 22.7 g of carbohydrate/day, i.e. 4.5% of the total energy intake, with a decreasing contribution in the following order: soft drinks (37%), dairy-based beverages (30%), juice and nectars (26%), alcoholic beverages, hot drinks.
Table 3: Nutritional intake of various beverages and contribution to fluid intake. (Study 1)
| Total | Water | Hot drinks | Juice Nectars | Soft drinks | Dairy-based drinks | Alcoholic beverages | |
| Energy (Kcal) | 204 | 0 | 29 | 38 | 64 | 71 | ? |
| Water (ml) | 1236 | 557 | 290 | 59 | 102 | 136 | 92 |
| Carbohydrates (g) | 22.7 | 0 | 0.5 | 5,9 | 8.4 | 6.7 | 1.3 |
| Intake fluid (ml< reference*> reference* |
1087 1919 |
460 877 |
224 515 |
63 78 |
110 117 |
133 207 |
97 125 |
| Distribution beverages <reference*> reference* |
100% 100% |
42% 46% |
21% 27% |
6% 4% |
10% 6% |
12% 11% |
9% 7% |
* EFSA reference value for water intake
Source: BCFF investigation 2013, CRÉDOC.
In terms of hydration, only 23% of people reached the EFSA dietary reference value for water (liquids and food). Substantial differences were seen when the subjects have intakes above or below the EFSA reference value (Table 3). When the subjects have intakes above the reference value, the amount drunk is higher (up to 2.3x for hot drinks), with an additional intake close to 420 ml for water and close to 300 ml for hot drinks, which equates to a slightly higher proportion for these two beverages. Furthermore, the variety of beverages (the number of different types of drink consumed at least once during 3 consecutive days) was higher when the subjects had intakes higher than what is recommended (3.6 vs. 3.5) (p<0.01).
Furthermore, those who reach the reference value for total water had better food diversity scores relative to those who were below the benchmark value, i.e. 25% vs. 15% for the first tercile (12-15) equating to a high level of diversity, 50% vs. 39% for the second tercile (10-11), and 25% vs. 46% for the third tercile (0-9), equating to a very low level of diversity (p<0.05).
Table 4: Average quantities of beverages consumed according to the typology classes
(Study 1)
| ml | Water(ml) | Hot drinks (ml) | Juice Nectars(ml) | Soft drinks (ml) | Dairy-based drinks (ml) | Alcoholic beverages (ml) | Total(ml) |
| Soft drinks drinkers | 528 | 86 | 18 | 327 | 126 | 26 | 1111 |
| Accustomed to fruit juice | 595 | 204 | 216 | 167 | 196 | 61 | 1439 |
| Keen on dairy-based drinks | 648 | 104 | 35 | 23 | 404 | 52 | 1266 |
| Hot drink adherents | 534 | 412 | 40 | 29 | 27 | 47 | 1088 |
| “Anything goes” drinkers | 615 | 602 | 50 | 88 | 33 | 140 | 1528 |
| Partial to alcoholic beverages | 272 | 366 | 68 | 40 | 102 | 572 | 1419 |
Source: BCFF investigation 2013, CRÉDOC.
Lastly, beverage consumption was analyzed by Principal Component Analysis (PCA) along two axes: axis 1 (abscissa) (soft drinks-alcohol) and axis 2 (ordinate) (hot drinks-fruit juice) Six types of “drinkers” can hereby be identified (figure 1). Table 4 distinctly reveals very differently beverage consumption profiles according to these types. Fluid intake decreased steadily in the following order: the “anything goes”, “accustomed to fruit juice”, “keen on dairy-based drinks”, “soft drinks drinkers”, and “hot drink adherents”, with a spread of 440 ml between the extremes. But while the fluid intake was high for those who were “partial to alcoholic beverages”, their water intake was extremely low. The “anything goes” and the “hot drink adherents” were the ones who drank the least dairy-based drinks, while those “keen on dairy-based drinks” were those who consumed the least fruit juice and nectars and soft drinks. The “soft drinks drinkers” were the ones who consumed the least alcoholic beverages.
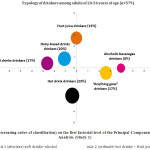 |
Figure 1: Typology of the consumers. Projection of the classes of consumers (obtained by decreasing order of classification) on the first factorial level of the Principal Component Analysis. (Study 1) Click here to View figure |
Study 2
Hydration was given a very high level of importance since 53% of 20-34-year-olds and 63% of 35-54-year-olds claimed to pay attention or great attention to drinking 1.5 litres of fluid per day. This is well over the values declared for other types of recommendations such as 5 fruits and vegetables (41% and 47%), three dairy products per day (36% for the 2 age groups) or 30 min of physical activity (37% and 43%).
Table 5: Benefit sought according to the type of beverage
The numbers are expressed as percentages/ several answers are possible.
| What type of beverage do you prefer most when you want to… | Water | Milk | Hot chocolate | Coffee | Regular, Brewed, Herbal tea | |||||
| AGE | 20-34 | 35-54 | 20-34 | 35-54 | 20-34 | 35-54 | 20-34 | 35-54 | 20-34 | 35-54 |
| Relax? | 7 | 11 | 5 | 2 | 18 | 7 | 7 | 12 | 31 | 23 |
| Get a boost? | 3 | 7 | 5 | 2 | 39 | 15 | 6 | 16 | 20 | 17 |
| Celebrate good news? | 2 | 4 | 0 | 0 | 0 | 0 | 1 | 0 | 1 | 0 |
| Quench your thirst? | 85 | 82 | 1 | 0 | 0 | 1 | 0 | 1 | 3 | 7 |
| Party? | 4 | 4 | 0 | 0 | 0 | 0 | 0 | 0 | 0 | 1 |
| Engage in sports? | 80 | 66 | 1 | 0 | 0 | 0 | 1 | 1 | 0 | 1 |
| Take care of your body? | 70 | 63 | 3 | 3 | 0 | 1 | 0 | 2 | 13 | 11 |
| Have a bit of a treat? | 1 | 5 | 3 | 1 | 23 | 11 | 4 | 10 | 6 | 8 |
| Spend time with friends? | 3 | 3 | 0 | 1 | 1 | 1 | 15 | 21 | 6 | 11 |
Source: HARRIS investigation 2013.
| What type of beverage do you prefer when you want to… |
Fruit juice Smoothie |
Non-alcoholic refreshing beverages |
Wine Beer | Strong liquor Alcoholic cocktails |
Energy drinks | |||||
| AGE | 20-34 | 35-54 | 20-34 | 35-54 | 20-34 | 35-54 | 20-34 | 35-54 | 20-34 | 35-54 |
| Relax? | 17 | 8 | 22 | 20 | 18 | 21 | 6 | 12 | 1 | 0 |
| Get a boost? | 9 | 6 | 16 | 11 | 9 | 10 | 4 | 12 | 0 | 2 |
| Celebrate good news? | 11 | 5 | 18 | 9 | 40 | 36 | 44 | 44 | 1 | 0 |
| Quench your thirst? | 13 | 7 | 26 | 26 | 1 | 5 | 0 | 1 | 0 | 0 |
| Party? | 14 | 5 | 27 | 16 | 40 | 41 | 51 | 47 | 1 | 1 |
| Engage in sports? | 8 | 8 | 5 | 7 | 0 | 0 | 0 | 0 | 5 | 5 |
| Take care of your body? | 22 | 20 | 0 | 3 | 0 | 0 | 0 | 0 | 0 | 1 |
| Have a bit of a treat? | 23 | 12 | 34 | 24 | 21 | 30 | 15 | 18 | 2 | 1 |
| Spend time with friends? | 17 | 11 | 33 | 18 | 42 | 40 | 24 | 28 | 1 | 1 |
| What type of beverage do you prefer when you want to… |
Soup Broth | Champagne | Other beverage | None | This situation does not apply to me |
|||||
| AGE | 20-34 | 35-54 | 20-34 | 35-54 | 20-34 | 35-54 | 20-34 | 35-54 | 20-34 | 35-54 |
| Relax? | 2 | 1 | 0 | 0 | 0 | 0 | 5 | 7 | 5 | 7 |
| Get a boost? | 3 | 5 | 0 | 0 | 0 | 0 | 9 | 12 | 8 | 13 |
| Celebrate good news? | 0 | 0 | 6 | 9 | 0 | 0 | 4 | 11 | 6 | 7 |
| Quench your thirst? | 1 | 1 | 0 | 0 | 0 | 0 | 0 | 1 | 4 | 2 |
| Party? | 0 | 0 | 0 | 1 | 0 | 0 | 4 | 11 | 6 | 8 |
| Engage in sports? | 0 | 1 | 0 | 0 | 0 | 0 | 2 | 6 | 12 | 18 |
| Take care of your body? | 6 | 7 | 0 | 0 | 0 | 0 | 5 | 7 | 9 | 9 |
| Have a bit of a treat? | 1 | 2 | 1 | 0 | 0 | 1 | 4 | 6 | 5 | 5 |
| Spend time with friends? | 0 | 0 | 0 | 0 | 0 | 1 | 4 | 6 | 4 | 4 |
The benefit sought according to the type of beverage was probed by the following question: what type of beverage do you prefer most when you want to… followed by a verb (Table 5). Water correlated highly with verbs “quenching of thirst”, “playing sport” (more so with 20-34 years old) and “taking care of one’s body”. Milk was not linked with any specific desired effect while the hot chocolate was notably associated with “getting a boost”, “having a bit of a treat”, and “to relax”. This was so to a greater extent for the 20-34 years old than for the 35-54 years old. Having a coffee was somewhat associated with “spending time with friends”, “getting a boost”, “relaxing”. This was more so with the 35-54 years old than the 20-34 years old. The regular, herbal and brewed tea was associated with the verbs “relaxation” (particularly with the 20-43 years old) “getting a boost”, and to a lesser extent “taking care of one’s body”. Fruit juice and smoothies were moderately associated with several verbs: “to have a bit of a treat”, “taking care of one’s body”, “spending time with friends” or “to relax”, with a profile that does not fully match that of soft drinks, for which the associated verbs are also “to have a bit of a treat”, “spending time with friends” or “to relax”, but also “quenching of thirst”, and “to party”. Wine and beer were strongly associated with “spending time with friends”, “to party”, “celebrating good news”, but also “for a bit of a treat”, and “to relax”. Strong liquor and alcoholic cocktails were quite similar, but with a higher level of “to party”, “celebrating good news”, and less so for “spending time with friends”, “for a bit of a treat”, and “to relax”.
Table 6: Circumstances (e.g. fun, event, moment, etc.) associated with a beverage
The numbers are expressed as percentages/ several answers are possible.
| Based on your personal experience, what beverage do you preferentially associate with…? | Water | Milk | Hot chocolate | Coffee | Regular, Brewed, Herbal tea | |||||
| AGE | 20-34 | 35-54 | 20-34 | 35-54 | 20-34 | 35-54 | 20-34 | 35-54 | 20-34 | 35-54 |
| Atreat | 1 | 2 | 2 | 0 | 40 | 29 | 3 | 2 | 1 | 3 |
| Tedium | 9 | 10 | 4 | 2 | 5 | 3 | 6 | 7 | 12 | 4 |
| A bout of the blues | 2 | 5 | 2 | 0 | 22 | 8 | 6 | 8 | 12 | 6 |
| Celebration | 2 | 2 | 0 | 0 | 0 | 1 | 1 | 1 | 0 | 1 |
| Return to childhood | 2 | 5 | 22 | 18 | 55 | 44 | 1 | 0 | 1 | 0 |
| Health/ Well-being | 69 | 67 | 6 | 5 | 2 | 2 | 0 | 0 | 14 | 11 |
| Party/ fun | 2 | 3 | 0 | 0 | 0 | 0 | 0 | 1 | 0 | 0 |
| Relaxation | 4 | 8 | 3 | 0 | 16 | 8 | 9 | 10 | 21 | 18 |
| Sport | 75 | 67 | 0 | 0 | 0 | 0 | 1 | 0 | 1 | 1 |
| Holidays | 9 | 10 | 0 | 0 | 3 | 1 | 2 | 2 | 2 | 1 |
| Work | 43 | 42 | 0 | 0 | 2 | 1 | 45 | 42 | 10 | 9 |
Source: HARRIS investigation2013.
| Based on your personal experience, what beverage do you preferentially associate with…? | Fruit juice smoothie | Non-alcoholic refreshing beverages | WineBeer | Strong liquorAlcoholic cocktails | Energy drinks | |||||
| AGE | 20-34 | 35-54 | 20-34 | 35-54 | 20-34 | 35-54 | 20-34 | 35-54 | 20-34 | 35-54 |
| A treat | 27 | 23 | 38 | 24 | 3 | 9 | 4 | 5 | 1 | 0 |
| Tedium | 4 | 1 | 10 | 6 | 5 | 4 | 2 | 4 | 0 | 0 |
| A bout of the blues | 3 | 2 | 5 | 6 | 12 | 11 | 17 | 15 | 1 | 0 |
| Celebration | 7 | 4 | 13 | 8 | 43 | 36 | 50 | 40 | 0 | 0 |
| Return to childhood | 13 | 8 | 14 | 13 | 1 | 0 | 0 | 0 | 0 | 0 |
| Health/ Well-being | 20 | 18 | 1 | 4 | 1 | 1 | 0 | 0 | 0 | 0 |
| Party/ fun | 10 | 6 | 26 | 15 | 35 | 36 | 57 | 51 | 1 | 0 |
| Relaxation | 13 | 13 | 25 | 20 | 18 | 22 | 6 | 9 | 0 | 0 |
| Sport | 6 | 6 | 3 | 4 | 0 | 1 | 0 | 0 | 14 | 12 |
| Holidays | 23 | 19 | 37 | 30 | 24 | 30 | 22 | 17 | 0 | 0 |
| Work | 3 | 1 | 4 | 6 | 1 | 1 | 1 | 1 | 2 | 1 |
| Based on your personal experience, what beverage do you preferentially associate with…? | Soup Broth | Champagne | Other beverage | None | This situation does not apply to me | |||||
| AGE | 20-34 | 35-54 | 20-34 | 35-54 | 20-34 | 35-54 | 20-34 | 35-54 | 20-34 | 35-54 |
| A treat | 1 | 1 | 0 | 0 | 0 | 0 | 7 | 13 | 6 | 8 |
| Tedium | 14 | 7 | 0 | 0 | 0 | 0 | 28 | 35 | 14 | 24 |
| A bout of the blues | 4 | 2 | 0 | 0 | 0 | 0 | 22 | 28 | 10 | 19 |
| Celebration | 0 | 0 | 7 | 6 | 0 | 0 | 3 | 14 | 5 | 8 |
| Return to childhood | 5 | 5 | 0 | 0 | 0 | 0 | 7 | 13 | 8 | 13 |
| Health/ Well-being | 7 | 6 | 0 | 0 | 0 | 0 | 5 | 8 | 6 | 6 |
| Party/ fun | 0 | 0 | 1 | 2 | 0 | 0 | 4 | 11 | 6 | 8 |
| Relaxation | 1 | 1 | 0 | 0 | 0 | 0 | 7 | 11 | 7 | 6 |
| Sport | 0 | 1 | 0 | 0 | 0 | 0 | 4 | 8 | 9 | 14 |
| Holidays | 0 | 0 | 0 | 0 | 0 | 1 | 7 | 14 | 6 | 6 |
| Work | 0 | 1 | 0 | 0 | 0 | 0 | 6 | 10 | 5 | 7 |
The circumstances (e.g. humour, event, moment, etc.) associated with a particular drink were evaluated by the responses to the question “based on your personal experience, which beverage do you preferentially associate with …? (Table 6). Water was associated very strongly with the sport, with health and well-being, and to a lesser extent with work, regardless of the age group. Milk was associated with a return to childhood, and the same, but more strongly so for hot chocolate. The latter was also associated with “a treat” and to a lesser extent with “a bout of the blues”. Coffee was only associated with work, while regular, brewed and herbal tea was associated more with relaxation. Fruit juice and smoothies were moderately associated with a treat, holidays, and health/well-being. Non-alcoholic soft drinks were preferentially associated with holidays, a treat and with relaxing and partying. Wine and beer were primarily associated with celebrating, partying/”having fun”, with holidays, followed by relaxing. Strong liquor and alcoholic cocktails were primarily associated with partying/”having fun” and celebrating, followed to a lesser extent with holidays, and with “a bout of the blues”.
Discussion
Studies 1 and 2 provide general insights regarding questions surrounding the context of beverage consumption. This has already been addressed in other studies, particularly those looking at consumption with an approach centred on physiology in terms of the interactions between drinking and satiety. These have particularly shown how these two are interdependent.16 On the one hand, the interrelation between several actions raises the question of context even if this was not explicitly posed. On the other hand, it shows that from a biological perspective, the act of drinking should not be considered in isolation, but in its co-setting with other activities, particularly that of eating. Recent works go beyond the physiological aspects, showing that the interdependence link between these two actions is also based on a collection of cognitive associations that are part of consumption habits.7 Depending on the composition and the time of meals, different beverages are over-represented or under-represented. These studies also show how these interdependencies vary according to gender or socioeconomic status.
For these last aspects, studies 1 and 2 head in the same direction. By analyzing the results jointly, it is possible to articulate the context of drinking with the consumption profiles. Although there is little variation in the overall fluid intake, the type of drinks consumed varies considerably when, for example, consumption habits of water or soft drinks are measured. The proportion of water consumption is higher for the upper socioeconomic group than for the lower socioeconomic group. For soft drinks, which can have a higher caloric value, the consumption trend is the reverse, as seen as a function of the position on the social scale. Table 4 reveals that, in terms of the number of drinks over a whole week, group 6 (labourers) consumed up to 2.5 times more soft drinks than group 3 (upper managerial and intellectual professions). Although the income level of consumers and then the beverage prices must be taken into consideration the socioeconomic status is not the only variable that underlies the variation in the quality of beverages consumed shown by the Principal Composition Analysis. Gender, age, generational affiliation, and family configuration are also important determinants of consumption modes.
The differences are hence linked to this set of variables that differentially distribute the contexts of drinking and the associated representations. Thus, variations in consumption between young individuals (12-25 years old) and adults (over 25 years old) clearly show how the location, the time, and social interactions can constitute explanatory factors. For example, for young people, the consumption of soft drinks is, to some extent, associated with the level of consumption away from home, and this pattern is more developed than for the older age group.17 These forms of consumption are derived from the social behaviour of young people, for whom the act of drinking soft drinks and consumption outside of the family circle and school environment symbolizes the autonomy necessary for establishing an adolescent identity.18,19 This age-linked effect must also be considered in terms of generational affiliation. While the typology data highlight the fact that the “soft drinks adherents” are highly represented by young people, this is not only dependent on age or position in an age category (child, adolescent, starting life as a young adult, adult, senior). The generational factor also participates in the variation in consumption and is shown to be highly important for comprehending consumption trends.12 This is important due to the fact that, on the one hand, the sharing of common consumption experiences between people derived from the same cohorts (or adjacent cohorts) marks a change in attitudes at a given time. On the other hand, it is because of these conditions a more overall transformation of consumption modes when generations advance with ageing. The recent finding of a decrease in alcohol intake in favour of soft drinks in contexts linked with partying is an example of this.
In this respect, the age variation is very representative of how perceptions regarding beverages are linked to contextual differences according to generational affiliation.20 One of the very strong differences measured by study 2 concerns regular, brewed and herbal tea, the 20-34 years old associate it much more with “tedium” and “about of the blues” than the 35-54 years old. The numbers are the opposite for these two age groups in terms of the association between this type of beverage and the fact of “spending time with friends”. For the younger age group, consumption of soft drinks is strongly associated with “spending time with friends”.Conversely, it is weakly associated with this motivation for the older age group. The notion of the context of drinking provides an explanation for this substantial difference, and also in study 1 that indicated the same trends. For the older age group, “having a cup of tea” during the day or “drinking a herbal tea” after a meal is an activity that fits with conviviality. In the two situations, a hot drink is either conducive to a social break during the day or to prolong one after a meal.21 On the other hand, according to the dictum of generational differentiation,22 other beverages (e.g. non-alcoholic soft drinks) are used by younger generations to mark an activity geared toward social exchanges. Regular and herbal tea are associated with tedium since these beverages precisely represent situations shared between older adults, and that is hence perceived by younger individuals as being boring.
The impact of the contextuality can also be measured through the weekly temporality of ambition. In study 1, one sees a progressive increase in the consumption of alcohol from Monday (8%) to Friday (17.7%), with Saturday being the day when it is by far the highest (24.8%). Conversely, other beverages such as water exhibit a decreasing trend as the week go by. This is found in the associations made where the collection of alcoholic beverages – with the exception of champagne – are highly distinct from the others when they are associated with festive activities. There is little difference in terms of age groups when it comes to wine and beer (1 point), but the difference is more pronounced with strong liquor (5 points) that is imbibed more by the 20 – 34-year-olds.
These findings clearly show that a large number of aspects surrounding the act of drinking have overtaken the straightforward physiological justification to drink. The currently used sociodemographic variables must be placed in correlation with aspects surrounding the context of consumption in order to reach an overall understanding of how a given sector of the population relates to the drinking of beverages. Following the analysis of these results, four contextual settings beyond the fluid data become clear:
– The meals setting where beverages are tightly linked with the food that is consumed and, as shown by some studies,7 sometimes even dependent on the dish that is served. For example, our data show that in France, milk-based drinks are associated with breakfast, and this is particularly so for 20 – 34-year-olds. Compared to other meals, beer and wine tend, in turn, to be consumed with dinner, and particularly so when in the company of friends – situations that appear to call for different types and degrees of dishes to be served.23 This is no doubt the most complex setting to apprehend, given that it is where the act of drinking interacts the most with other elements that are all dependent on one another: consumption of food, its position spatially and in time (daily and weekly), table companions (the number and sorts of people seated at the table), and any activities accompanying the meal (e.g. discussion, television, etc.).
– The setting of the beverage consumption that, in the same way as the meal, constitutes a social circle in and of itself. Having a “coffee” in France or “tea” in the UK or also a “pre-dinner drink” are social events that can be of different relevance depending on which social class one is affiliated with. The various contexts of pertinence to this setting prescribe the type of drink. They prove to be less formal than the meals but can nonetheless assume consumption of food that is in keeping with the beverages that are served –opposite to the meals. Thus, while hot drinks allow for sweet (pastries, biscuits, and chocolates), or salty (bread, butter with soup) dishes to be served, alcoholic beverages are conducive to consumption of salty food, particularly when it comes to pre-dinner drinks.24
– The setting of everyday activities can, by itself, dictate consumption of beverages that vary depending on the type of activity. As shown by the results of these two studies, while the sport is strongly associated with water, leisure activities are associated more with non-alcoholic soft drinks etc. and work with coffee. Not all daily chores need to involve drinking, but some are profoundly linked with this, sometimes routinely so.
– The exceptional setting is the last to emerge from our studies. Generally associated with an event that is seen to require “having a celebratory drink”, these situations systematically entail having a ritualized drink that signifies the involvement of the individuals in the festive setting. According to the type of event, specific drinks may be in order (e.g. sparkling wine, cocktails etc.) and beverages associated with hydration (tap water) or routine procedures (hot drinks) are excluded from this setting.
These four settings that have emerged from the results of the two studies show that all classification of drinking modalities (quantity, quality, and way of consumption) holds a tight relationship with the context of the ambition. While these contexts are defined culturally in contemporary Western societies, the consumption registries vary according to social class affiliations. Here, we have documented situational differences as a function of the “age” variable, since it remains under-used in our opinion in the approach to comparisons of behaviour. Studies 1 and 2 also show that other such characteristics, such as gender or social status are indicative of the way consumptions vary, and this may particularly be explained because the encountered contexts are not the same according to the individual’s socioeconomic situation. The social and biological rhythms of an outdoor building labourer deviate considerably from those of a female engaged in the tertiary employment sector. From this stem strong variations in the distribution of the drinking contexts, which are seen quite clearly by the numbers surrounding beverage consumption. Thus, the context should not be lost from studies regarding drinking, since it brings deeply-rooted meaning and representation that guide drinking practices or that in some cases even determine it.
The specificity of the country’s fluid consumption was performed by EFSAshowing great differences between European populations. Compared with France, hot beverages consumption is higher in the UK, Netherlands, Ireland, Poland; the bottled water and water tap consumption is higher in Italy; the milk and derivates consumption is lower in Germany and Belgian; the alcoholic beverages consumption is higher in Ireland, UK, Czechoslovaquy and lows in Island, Norway, Slovakia and Poland.25
The strength of this work lies with the fact that the two study populations were closely matched: they were of the same size and comprised the same age group; they were studied at the same time and they are representative of the adult population in France. Furthermore, the surveys that were carried out are complementary: one concerns the context of consumption and the type of consumers, the other focuses on the circumstances and the benefits linked to this consumption.
The weak aspects of this work are the fact the two studies were done on two separate populations with two different methods of investigation. Furthermore, in both cases the survey is declarative, and water consumption is hence often underestimated. Lastly, these results regard the population in France and are not reproducible with the population of other countries with other cultures.
Conclusion
Beverage consumption is very often approached from a physiological (i.e. to correct or anticipate thirst)26 or nutritional (meeting needs and recommended intakes),27,28 or even medical perspective (prevention or correction of a pathology).29 Very few studies, however, approach consumption with social and psychological perspectives of drinking in mind, nor with a view of the context or motivation. Yet drinking is about more than rehydrating or ingesting a liquid, the same way eating is not just about nourishment. Interaction during meals is an important cultural phenomenon7 underpinned also by gastronomic and culinary considerations. But there are other influences that involve table companionship and affability. Gender, age and socioeconomic levels8,9,6come into play, but they are themselves only incomplete determinants of what beverages represent for a category of the population. On the one hand, these population categories have a perception of the meaning given to a drink, of its appeal and its nature. On the other hand, each drink holds significance derived from a complex interaction of its composition, its effects, and its context.
It, therefore, seems to us that sociologists and dieticians should merge their efforts in analyzing these contexts and these interactions. This is no doubt a way to alter, if necessary, some forms of consumption, to provide direction for public health programs and educational initiatives.
Acknowledgements
Acknowledgement to Suzanne Lanckriet (Nutrition Department of Institut Pasteur de Lille) for its help for the manuscript and to Antoine Mercier (Proteins Agency) for its help for the analysis of the results.
Conflict of Interest
The authors declare no conflict of interest.
Funding sources
A grant will be obtained from the European Hydration Institute for the second study.
References
- Gillis L. J., Bar-Or O. Food away from home, sugar-sweetened drink consumption and juvenile obesity. The Journal of the American College of Nutrition. 2003; 22(6): 539–45.
CrossRef - Mc Elligott J. T., Roberts J R., Varadi E A., O’Brien E. S., Freeland K. D., Basco W T Jr. Variation in fruit juice consumption among infants and toddlers: associations with WIC participation. Southern Medical Journal. 2012; 105(7): 364-369.
CrossRef - Turconi G., Rossi M., Roggi C., Maccarini L. Nutritional status, dietary habits, nutritional knowledge and self-care assessment in a group of older adults attending community centres in Pavia, Northern Italy. Journal of Human Nutrition and Dietetics. 2013; 26(1): 48-55.
CrossRef - Fardet A., Boirie Y. Associations between food and beverage groups and major diet-related chronic diseases: an exhaustive review of pooled/meta-analyses and systematic reviews. Nutrition Reviews. 2015; 72(12): 741-762.
CrossRef - Nikpartow N., Danyliw A D., Whiting S J., Lim H J., Vatanparast H. Beverage consumption patterns of Canadian adults aged 19 to 65 years. Public Health Nutrition. 2012; 15(12): 2175-2184.
CrossRef - De Coen V., Vansteelandt S., Maes L., Huybrechts I., De Bourdeaudhuij I., Vereecken C. Parental socioeconomic status and soft drink consumption of the child. The mediating proportion of parenting practices. Appetite. 2012;59(1): 76-80.
CrossRef - Mueller Loose S., Jaeger S R. Factors that influence beverage choices at meal times. An application of the food choice kaleidoscope framework. Appetite. 2012; 59(3): 826-36.
CrossRef - Pechey R., Jebb S A., Kelly M P., Almiron-Roig E., Conde S., Nakamura R et al., Socioeconomic differences in purchases of more vs. Less healthy foods and beverages: Analysis of over 25,000 British households in 2010. Social Science & Medicine. 2013; 92(100): 22-26.
CrossRef - Bere E., Glomnes E S., te Velde S J., Klepp K I. Determinants of adolescents soft drink consumption. Public Health Nutrition. 2007;11(1): 49-56.
- Volatier J L. Enquête Individuelle et Nationale sur les Consommations, Alimentaires (INCA). Paris: Lavoisier Tec and Doc; 2000.
- Volatier J L., Verger P. Recent national French food and nutrient intake data. British Journal of Nutrition. 1999;81(2): 57–59.
CrossRef - Hébel P. Consommation de boissons en France : préférences culturelles et contributions à l’équilibre nutritionnel. Cahier de Nutrition et Diététique. 2011;46(1): 13-19.
CrossRef - Bellisle F., Thornton S N., Hébel P., Denizeau M. Tahiri M A. Study of fluid intake from beverages in a sample of healthy French children, adolescents and adults. European Journal of Clinical Nutrition. 2010; 64(4): 350-355.
CrossRef - Carnet photographique SUVIMAX. Portions alimentaires : manuel photos pour l’estimation des quantités. Paris: Polytechnica; 2002.
- Scientific opinion on dietary reference values for water. EFSA panel on dietetic products, nutrition, and allergies (NDA). EFSA Journal. 2010; 8(3): 1459-507.
- Mc Crickerd K., Chambers L., Yeomans M R. Fluid or fuel? The context of consuming a beverage is important for satiety. PLoS One. 2014; 9(6): 1-10.
- Lecerf J M., Mathiot L., Les adolescents et les boissons, Le point de vue du sociologue et du nutritionniste. In: Les entretiens de Bichat. Toulouse: Europa Digital Publishing; 2013: 473-481.
- Corbeau J-P., Poulain J-P. Penser l’alimentation, Entre imaginaire et rationalité. Toulouse: Privat; 2002.
- Diasio N., Hubert A., Pardo V. Alimentations adolescentes en France. Paris: Les Cahiers de l’OCHA; 2009.
- Pecqueur Christophe, Moreau Christophe, Droniou Gilles, « Identités de genre et consommation d’alcool. L’évolution des pratiques festives juvéniles à travers les générations », Agora débats/jeunesses, 2016/3 (N°74), p. 39-53
- Farb P., Armelagos G J. Consuming passions: the anthropology of eating. Boston: Houghton Mifflin; 1980.
- Mathiot L. Repas adolescents et tabous alimentaires : les enjeux de la restauration scolaire. Cultures et Sociétés. 2014;31: 50-56.
- Cardebat Jean-Marie, Economie du vin, Paris, La découverte, 2017
- Clarisse R. L’apéritif comme rituel social. Cahier Internationaux de Sociologie. 1986;80: 53-61.
- Base de données concise sur la consommation alimentaire européenne. 2009. http://www.efsa.europa.eu/fr/datex/datexfooddb.htm.
- Mc Kiernan F., Houchins J. A., Mattes R D. Relationship between human thirst, hunger, drinking, and feeding. Physiology & Behavior. 2008; 94(5): 700-708.
CrossRef - Balaghi S., Faramarzi E., Mahdavi R., Ghaemmaghami J. Fluids intake and beverage consumption pattern among university students. Health Promotion Perspectives. 2011; 1(1): 54-61.
- Perrier E., Rondeau P, Poupin M., Le Bellego L., Armstrong L E., Lang F. et al., Relation between urinary hydration biomarkers and total fluid intake in healthy adults. European Journal of Clinical Nutrition. 2013;67(9): 939-943.
CrossRef - Das R. N., Grimmer-Somers K. A. Fluid intake and voiding; habits and health knowledge in a young healthy population. Research and Reports in Urology. 2012; 19(4): 9-15.
CrossRef
Accepted on: 01-02-2019
Second Review by: Dr. Bekir DEMİRTAS Turkey
Final Approval by: Prof. Giovani Leone Zabot


Web of Science Coverage
Emerging Sources Citation Index (ESCI)
2024 Journal Impact Factor: 1.1
Scopus Journal Metrics
CiteScore 2025: 2.6
CiteScore Details
Sustainable Nutrition: Food Systems, Nutrient Retention, and Public Health Impact
![]()
This journal is a member of, and subscribes to the principles of, the Committee on Publication Ethics (COPE)


