Development of High Protein Nutrition Bar Enriched with Spirulina plantensis for Undernourished Children
Arvind Kumar1*
, P.Yashaswini2 1Centre of Food Science and Technology, Institute of Agricultural Sciences, Banaras Hindu University, Varanasi-221005, Uttar Pradesh, India
2Centre of Food Science and Technology, Institute of Agricultural Sciences, Banaras Hindu University, Varanasi-221005, Uttar Pradesh, India.
Corresponding Author Email: arvind00000@gmail.com
DOI : http://dx.doi.org/10.12944/CRNFSJ.6.3.26
Download this article as:
![]()
This study aimed at incorporating Spirulina in the development of high protein nutrition bars, since protein related malnutrition amongst children is highly prevalent and needs to be addressed diligently. Spirulina, a multicellular filamentous cyanobacteria, has gained popularity as a food supplement for its high macronutrient and micronutrient contents and ease of processing. Spirulina plantensis along with Bengal gram(Cicer arietinum), groundnuts (Arachis hypogaea L.), Cornflakes (Zea mays), and other ingredients was used to make 7 variants of a novel nutrition bar and control sample (without Spirulina).The bars were evaluated for nutritional quality (proximate analysis, antioxidant ability, total phenolic content), textural parameters, colour attributes, and sensory characteristics. The protein content of the bar was found to be 167% more than the control sample. The antioxidant potential and total phenolic content of bars containing Spirulina were substantially higher than the control sample. The textural characteristics displayed by certain variants of the bar did not significantly differ (p>0.05) from the control sample, while the colour of the bar did. The Spirulina enriched bar gained acceptability in terms of sensory attributes, hence was concluded to be a potential product for undernourished children with protein deficiency.
KEYWORDS:High Protein; Nutrition Bar; Spirulina; Undernourished Children
Introduction
According to UNICEF 2016 data, 22.9% of the children world wide under the age of five had stunted growth. Around 50% of all deaths in children under five years are attributable to under nutrition, which amounts to a loss of 3 million young lives every year. 52 million children under the age of five were wasted of which 17 million were extremely wasted globally, which implies a prevalence of about 7.7% and 2.5%, respectively. Tackling protein-deficiency related conditions among the youngest section of the population is the need of the hour. For the past few years, the demand for snack products with improved nutritional properties has increased (Rathod & Annapure, 2016), due to their high functionality, convenience and desirability, especially among children (Potter, Stojceska, & Plunkett, 2013). High-protein nutrition (HPN) bars containing 20-50 g protein/100g are one of the ways of incorporating a substantial amount of protein into the diet of children.
Spirulina, a multi cellular and filamentous cyano bacteria, has gained popularity and acceptance in the food processing industries as a food supplement. Spirulina grows in water and can be harvested and processed easily. It has very high macro nutrient and micro nutrient contents. It is rich in amino acids, unsaturated fatty acids, minerals, and vitamins. Spirulina consists of 55–70% protein content, 15–25% polysaccharide, 5–6% total lipid, 6–13% nucleic acids, and 2.2–4.8% minerals (Wu et al., 2016). The Food and Drug Administration (FDA) has granted GRAS certification (Generally Recognized As Safe) for Spirulina and has had its consumption authorized as food or food supplement.
Consumption of Spirulina has potential health effects such as immunomodulation, antioxidant, anticancer, antiviral, and antibacterial activities, as well as positive effects against malnutrition, hyperlipidaemia, diabetes, obesity, inflammatory allergic reactions, heavy metal / chemical-induced toxicity, radiation damage, and anaemia (Lee et al., 1998; Deng& Chow, 2010; Wu et al., 2016; Soheili & Khosravi-Darani, 2011). Both in vivo and in vitro studies indicate that the Spirulina as a supplement is mostly a pro-inflammatory agent. It enhances antioxidant activity and promotes the production of antibody and cytokines in both healthy and diseased animal models (Cervejeira Bolanho et al., 2014; Deng &Chow, 2010).
The incorporation of Spirulina in food has been seen as an emerging trend in several studies in the past decade. A study conducted by Fradique et al., (2010) incorporated Spirulina maxima biomass in pasta products, while a study conducted by Lemes, Takeuchi, Carvalho, & Danesi (2012) incorporated Spirulina plantensis in fresh pasta. De Marco, Steffolani, Martínez, & León, (2014), incorporated Spirulina biomass in wheat bread to enhance its nutritional value, and Vijayarani, Ponnalaghu, & Rajathivya, (2012) developed value-added extruded products with Spirulina.
The aim of this study was to make high protein nutrition bars enriched with Spirulina biomass for the sake of under nourished children. The use of ingredients Bengal gram (Cicer arietinum), groundnut (Arachis hypogaea L.), puffed rice, coconut flakes (Cocos nucifera), cornflakes (Zea mays), jaggery (unrefined sugar), Ghee (heat clarified milk fat) and liquid glucose makes this nutrition bar novel and unique. Every ingredient incorporated in the bar is quint essential for its functionality and is cost-effective. This study also aimed to determine the nutritional properties, colour and textural attributes, and the sensory perception of the nutrition bar enriched with Spirulina. The Spirulina enriched nutrition bar is highly cost-effective, possesses industrial relevance along with ease of manufacturing, and has the potential for addressing the dire issues of under nourishment among children.
Materials and Methods
Raw Materials
Spirulina powder (Spirulina plantensis), containing 65g protein/ 100 g powder was purchased from Grenera Nutrients Pvt. Ltd., Tamil Nadu, India. Groundnut (Arachis hypogaea) with 26.2±0.02 g protein/ 100 g, Roasted Bengal gram (Cicer arietinum) with 22.5±0.04 g protein/100 g, Cornflakes (Zea mays) with 11.1±0.08 g protein/100 g, Puffed rice (7.5±0.09 g protein/100 g), Jaggery (unrefined sugar), Coconut flakes (Cocos nucifera), and Ghee (heat clarified milk fat) were purchased from Local Lanka market, Varanasi, U.P., India. Liquid glucose was purchase from INA market, New Delhi, India. All chemicals required for analyses were purchased from Merck India, Mumbai, India. The protein content of the ingredients was estimated in samples taken in triplicate.
Nutrition Bar Preparation
Groundnuts and Bengal gram were roasted; dried coconut was grated, measured and mixed with pre-weighed quantities of puffed rice, Spirulina and corn flakes. Simultaneously, Ghee, liquid glucose, and jaggery were heated till all ingredients had melted to form a homogenous liquid mixture. The dry and wet ingredients added to Philips Food Processor (650 W) and run for 5 seconds, till the ingredients had been mixed. The mass was removed and manually mixed to ensure uniformity. It was then shaped in rectangular moulds (14cm x 3cm x 2cm) to obtain nutrition bars weighing 80g each. For control sample, Spirulina powder was not added (0%Spirulina powder). Variants were prepared as per tabulation (Table 1).
Table 1: Experimental Design for Formulation of Nutrition Bars at Different Ingredient Levels
| Variants | Ingredients | |||||||||
| SP | BG | PN | CF | PR | JA | LG | G | CO | T | |
| C | 0 | 9 | 15 | 8 | 3 | 18 | 15 | 8 | 4 | 80 |
| V1 | 6 | 9 | 12 | 8 | 3 | 15 | 15 | 8 | 4 | 80 |
| V2 | 6 | 9 | 12 | 8 | 3 | 21 | 9 | 8 | 4 | 80 |
| V3 | 6 | 9 | 12 | 8 | 3 | 30 | 0 | 8 | 4 | 80 |
| V4 | 6 | 9 | 12 | 8 | 3 | 0 | 30 | 8 | 4 | 80 |
| V5 | 4 | 9 | 15 | 6 | 1 | 21 | 12 | 8 | 4 | 80 |
| V6 | 3 | 9 | 16 | 6 | 1 | 21 | 12 | 8 | 4 | 80 |
| V7 | 5 | 9 | 16 | 8 | 3 | 15 | 12 | 8 | 4 | 80 |
Where C=Control sample, V1-7=Variations of Spirulina enriched formulationSP=Spirulina, BG=Bengal Gram, PN=Peanuts, CF=Corn Flakes, PR=Puffed Rice, JA=Jaggery, LG=Liquid Glucose, G=Ghee, CO=Coconut Flakes, T=Total weight
Nutritional Analyses
Proximate Analysis
The proximate analysis was carried out in triplicate and results were compared. The moisture content, protein content, crude fibre content, fat content and ash content of the control and Spirulina enriched nutrition bar were estimated as per AOAC, (1998). The total carbohydrate content was estimated as a difference of the sum total of other analyses (Merril &Watt, 1973)
Total Phenolic Content
The Total Phenolic Content of nutrition bars was determined by the method involving Folin-Ciocalteau reagent and Gallic acid standards (Wu &Hansen, 2008). Gallic acid was used for generating the standard curve having concentrations ranging from 20 to 100 mg/ml. 2.5 ml of 10 times diluted FC reagent was added to tubes containing sample extract (1% w/v; 1 g sample in 100 ml ethanol) and mixed well for 1 min. 2 ml of 7.5% Na2CO3 was added to it and allowed to incubate for 30 minutes at 37 °C. Further, the absorbance was measured at 760 nm (UltraViolet‑1800 Spectrophotometer, Shimadzu, Kyoto, Japan) and the standard graph was plotted. The reaction mixture was also incubated at 37 °C for 30 min and the absorbance was recorded at 760 nm. The total phenolic content equivalent to mg Gallic acid/ g sample was determined from the standard graph.
%DPPH Inhibition: Free Radical Scavenging Activity
Determination of the antioxidant potential of the Spirulina enriched nutrition bar was done by DPPH inhibition method as per the procedure given by Li, Zhou, & Han, (2006), with slight modifications. 1 g of sample was taken in 100 ml ethanol and was dispersed thoroughly with the help of vortex. It was allowed to remain still overnight. The extract was separated from the solid sample by centrifugation at 3000 rpm for 10 minutes. 0.2 ml of the eluted extract was taken in a test tube covered with aluminium sheet and 1 ml of freshly prepared DPPH solution (80µg/ml ethanol) was carefully added. A control was set up with 0.2 ml distilled water as blank and 1 ml of DPPH solution was added to it. These were allowed to remain in the dark for 30 minutes. In a cuvette, 0.5 ml ethanol was taken and the UV-V is spectrophotometer was calibrated. The absorbance of the samples and blank sample were measured against ethanol at 517 nm.
Perception Attributes
Sensory Evaluation
Nutrition bars were analysed for different sensory characteristics like colour and appearance, body and texture, aroma and taste and overall acceptability. Sensory evaluation was performed by a panel of 20 trained panel lists from the Centre of Food Science and Technology, Banaras Hindu University, Varanasi (India).
Sensory evaluation was performed at a temperature of 27 °C and 60% RH. 9-point Hedonic rating scale (1 = dislike extremely, 9 = like extremely) (Amerine, Pangborn, & Roessler, 2013) was used for evaluating the appearance, body & texture, aroma, taste and overall acceptability of the nutrition bars.
Colour Analysis
The colour of nutrition bars was assessed using the CIE L*a*b* scale with Hunter colour lab instrument equipped with a measuring head (diameter 127 mm). The results were expressed in terms of L* lightness (as values increase from 0 to 100%); a∗, redness to greenness (+60 to −60); b∗, yellowness to blueness (+60 to−60), according to the CIEL* a* b* system.
Texture Analysis
Textural attributes were analysed using Texture Analyser (TA.XT plus texture profile analyser, Stable Micro Systems, UK). A sample of 14.0 cm length, 3.0 cm width and 2.0 cm height were taken. The texture analyser with cutting probe and compression platen (HDP/BSK) as attachment was calibrated at 20 mm distance using data acquisition software (Exponent Lite XT PLUS, Ver.4.0.13.0 lite.). The pre-test and test speed were set at 1.00 mm/s, with a trigger force of 5 g and the post-test speed was 10 mm/s. Three test replications were performed on each of the samples tested. The hardness is defined as the maximum peak force during the first compression cycle or the first bite and was expressed in g.s (gram*second) and fracturability, force with which the sample crumbles, cracks or shatters, was measured in seconds.
Statistical Analysis
All analyses were conducted in triplicate. To verify the statistical significance of all results, mean±SD were calculated. Data were subjected to Analysis of variance ANOVA using Microsoft Excel version 2010. Significant differences of means (p<0.05) were also determined.
Results and Discussion
Nutritional Composition of Bar
In the present study, there was a sharp increase in the protein content of the product with the incorporation of Spirulina. The control sample was found to have 4.66±0.02 g protein/100 g sample (Table 2). In the variants of the bar containing 6 g Spirulina/ 80g sample, 12.44 to 12.57 g protein/100 g of nutrition bar was found to be the protein content, which is approximately a 167% increase from the control sample. Bengal gram, groundnuts and cornflakes, which are reasonably good sources of protein, also contributed to its increase in the nutrition bars.
Table 2: Proximate Analysis of Nutrition bars
| Variants | PROTEIN (g / 100 g) |
FAT(g / 100 g) | MOISTURE CONTENT(g / 100 g) | ASH(g / 100 g) | CARBOHYDRATE(g / 100 g) |
| C | 4.66±0.02a | 9.15±0.01a | 14.06±0.03e | 0.41±0.02a | 71.78±0.02e |
| V1 | 12.57±0.01d | 9.07±0.02a | 13.98±0.01d | 1.79±0.03d | 62.59±0.02b |
| V2 | 12.46±0.01d | 9.12±0.02a | 13.04±0.01b | 1.76±0.05d | 63.59±0.03b |
| V3 | 12.49±0.03d | 9.11±0.01a | 10.23±0.03a | 1.73±0.01d | 66.41±0.04d |
| V4 | 12.44±0.01d | 9.13±0.02a | 18.96±0.01f | 1.72±0.02d | 57.67±0.02a |
| V5 | 11.29±0.02c | 9.10±0.03a | 13.57±0.03c | 1.63±0.01c | 64.42±0.03c |
| V6 | 10.95±0.02b | 9.17±0.03a | 13.63±0.02c | 1.57±0.01b | 64.68±0.03c |
| V7 | 11.35±0.02c | 9.18±0.01a | 13.69±0.03c | 1.65±0.04c | 64.2±0.02c |
Where C=Control sample, V1-7=Variations of Spirulina enriched formulation
Values are Mean ± SD of triplicate samples
Different superscripts in columns are significantly different (*P<0.05)
This enhancement of protein content can be attributed to the high accumulation of the macromolecules in the microalga. Studies have shown that Spirulina has higher digestibility due to less amount of cellulose in its cell wall, thereby facilitating its use for human consumption (De Marco et al., 2014).
Carbohydrates in the nutrition bars were mostly contributed by jaggery (unrefined sugar) and liquid glucose. It was observed that with the incorporation of Spirulina, there was a slight decrease in the total carbohydrate content. The total carbohydrate content was found to be 71.78±0.02 g/100 g nutrition bar in the control sample, while the lowest carbohydrate content was at 57.67±0.02 g/100 g of nutrition bar, found in variant (V4) which was made with 30 g liquid glucose/ 80 g sample. It was concluded that there was a significant decrease in the total carbohydrate content of the variants enriched with Spirulina, although the contribution of Spirulina in this regard could not be confirmed.
The moisture content of the nutrition bars was subject to the quantity of liquid glucose added, which helped as a binding agent in the nutrition bar. It was noticed that the highest moisture content, 18.96±0.01 g/100 g of bar, was found in the variant containing 30 g liquid glucose/ 80 g of nutrition bar. It was also noted that the addition of Spirulina did not affect the moisture content of the nutrition bars.
While there was no significant difference between the lipid content of the control sample and the variants, it is worth noting that Spirulina contributes small amounts of abundantly nutritious lipids. According to Li & Qi, (1997), Spirulina has high amounts of γ-linolenic acid, α-linolenic acid (ALA), linoleic acid, stearidonic acid, eicosapentaenoic acid, docosahexaenoic acid, and arachidonic acid. The lipid content contributed by Spirulina mass in the nutrition bar is quite low, hence no significant difference (p>0.05) was observed in the fat content of the nutrition bars. (Figure 1)
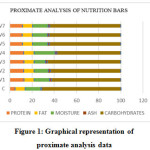 |
Figure 1: Graphical representation of proximate analysis data Click here to View figure |
According to Vo, Ngo, & Kim, (2015,) several essential minerals are available in Spirulina. A subsequent increase in the ash content confirmed the increase in mineral content. The ash content of the control sample was 0.41±0.02 g/100 g sample; the range of the ash content in the variants lied between 1.57-1.79 g/100 g sample. The mineral content of the bar enriched with Spirulina significantly improved. Lucas, de Morais, Santos, & Costa, (2017) found a substantial increase in the mineral content in extruded snacks prepared with the incorporation of Spirulina. Similarly, Santos, de Freitas, Moreira, Zanfonato, & Costa, (2016) observed that the ash content of Spirulina enriched shake was 3.48 ± 0.01 g/100 g of shake, while that without Spirulina was 3.14 ± 0.17 g/100 g of shake.
Joshi, Bera, & Panesar, (2014) found that the addition of Spirulina powder (7.5%) to maize flour extrudates increased the carotenoid content, protein content and zinc content in the products. The study conducted by Fradique et al., (2010) focussed on the development of fresh pasta enriched with microalgal biomass (Chlorella vulgaris, Spirulina maxima) and presented a chemical composition richer than the control pasta in terms of protein, total fat and ash content.
Total Phenolic Content and Antioxidant Ability
In the present study, the total phenolic content of the Spirulina powder was found to be was found to be 8.09±0.21mg GAE/g and the total phenolic content was found to be the highest in variants V1, V2, V3, at 7.90±0.01mg GAE/g bar, 7.83±0.02 mg GAE/ g bar, and 7.79±0.06 mg GAE/ g bar, respectively (Table 3). These were much higher than the control sample, which had 0.98±0.03mg GAE/g bar. It was noticed that the variants with the highest Phenolic content contained the highest amount of Spirulina powder in their formulation.
Table 3: Total Phenolic Content and Antioxidant Activity of Nutrition Bars
| Variants | Total phenolic content[mg GAE/g] | DPPH inhibition (%) |
| C | 0.98±0.03f | 9.14±0.76f |
| V1 | 7.90±0.01a | 48.50±0.32a |
| V2 | 7.83±0.02a | 47.40±0.36a |
| V3 | 7.79±0.06a | 46.80±0.17b |
| V4 | 7.56±0.04b | 46.26±0.50b |
| V5 | 6.10±0.12d | 39.86±0.12d |
| V6 | 5.56±0.08e | 37.83±0.93e |
| V7 | 6.92±0.11c | 42.10±0.52c |
Where C=Control sample, V1-7=Variations of Spirulina enriched formulation
Values are Mean ± SD of triplicate samples
Different superscripts in columns are significantly different (*P<0.05)
Phenolics are synthesized as secondary metabolites and are considered to be major contributors to antioxidant ability of microalga. Algal phenolics are known to be agents for combating free radicals which are harmful to the human body (Chaiklahan et al., 2013).
It was found in certain studies, where Spirulina was incorporated into cooked products like pasta and bread, that there is thermal degradation due to leaching out of phenolic compounds during cooking operations (De Marco et al., 2014). This is an added advantage of incorporating Spirulina in nutrition bar where thermal operations are minimal and perfunctory; it is not prone to destruction of phenolic compounds.
The % DPPH inhibition measures the free radical scavenging property of a particular substance and is a measure of its antioxidant potential. According to El-Baky, El Baz, & El-Baroty, (2009), DPPH radical scavenging activity depends on the phenolics present in the sample, and the samples that were rich in phenolics exhibited high DPPH inhibition. This trend was observed in the current study, where variants V1, V2, V3 which exhibited the highest total phenolic content also exhibited the highest % DPPH inhibition value, at 48.50±0.32% (V1), 47.40±0.36% (V2), and 46.80±0.17% (V3), respectively. A similar observation was noted with the other variants in comparison to their total phenolic content. It was observed that the more the amount of phenolics, the better the antioxidant activity.
Studies have indicated that Spirulina supplement has been shown promote antioxidant activity and increase the production of antibody and cytokines in both healthy animal models and disease models (Cervejeira Bolanho et al., 2014). Thus, increasing the level of Spirulina can lead to an increased functionality but maintaining the flavour as per consumer acceptability becomes a challenge when high levels of Spirulina are added.
Sensory Evaluation
Sensory analysis was performed primarily to identify the nutrition bar with the highest acceptability and to contribute to one’s understanding of children’s product selection.
In this study, it was found that the colour of the Spirulina enriched bars was perceived to be significantly different (p<0.05) from that of the control sample (Table 4). It was also noticed that bars with higher content of Spirulina (6g/ 80 g nutrition bar) had a stronger appeal than those with considerably lesser amounts. The more the intense greenness of the bar, the better the appeal. Also, the sensory score of the variants significantly varied (p<0.05) from the control sample.
Table 4: Sensory Evaluation of Nutrition Bars
| Nutrition Bar | Sensory Evaluation Parameters (9 point Hedonic Scale) | ||||
| Colour and appearance | Aroma/ Odour | Flavour and taste | Body and texture | Overall acceptability | |
| C | 8.25 ± 0.15a | 8.09±0.07a | 8.23±0.28a | 8.38±0.17a | 8.12±0.23a |
| V1 | 8.01± 0.09b | 7.88±0.12b | 8.04±0.28b | 8.27±0.13a | 7.99±0.13a |
| V2 | 7.92± 0.21c | 7.82±0.18b | 7.61±0.26d | 7.86±0.21c | 7.63±0.16c |
| V3 | 7.98±0.20c | 7.87±0.05b | 6.49±0.77e | 7.18±0.23f | 7.25±0.11f |
| V4 | 8.07±0.19b | 7.85±0.09b | 8.01±0.15b | 8.02±0.18b | 7.80±0.14b |
| V5 | 7.55±0.18d | 7.81±0.17b | 7.86±0.27c | 7.57±0.07d | 7.52±0.17d |
| V6 | 7.51±0.82d | 7.88±0.13b | 7.89±0.32c | 7.68±0.28d | 7.77±0.27b |
| V7 | 7.64±0.30d | 7.88±0.11b | 7.60±0.16d | 7.30±0.18e | 7.48±0.17e |
Where C=Control Sample, V1-7=Variations of Spirulina Enriched Formulation
Values are Mean ± SD of triplicate samples
Different superscripts in columns are significantly different (*P<0.05)
It was observed that the panel lists could find no significant difference (p<0.05) between the variants enriched with Spirulinain terms of odour and aroma. Although the control sample scored higher acceptability in terms of odour/aroma than the variants (8.09±0.09), no of odour or aroma could be detected from the variants containing Spirulina.
Nguyen, Girgis, & Robinson, (2015) reported that taste triumphs over health in case of products made for the target population comprising of children and young adults. The taste is a more powerful determinant than health-promoting factors for product selection. The better the taste, the more likely it is for the product to gain the acceptability of children. It was observed in the study that two variants V4 and V1 had sensory scores of taste and flavour at 8.01±0.15 and 8.04±0.28 respectively, close to the control’s score 8.23±0.28. This could again be attributed to the masking of bitterness and after taste of Spirulina by the jaggery and liquid glucose used in the making of the bar. The acceptance of novel products also depends on the level of bitterness or any after taste.
Body and texture of the nutrition bar were mostly affected by liquid glucose and jaggery used for making the bar. It was observed that the texture of the bar in terms of hardness was primarily affected by the increase in jaggery content, and the chewiness was facilitated by liquid glucose. The variant that was most acceptable in terms of body and texture, and which was closest to the control’s score (8.38±0.17) was variant V1 with a sensory score 8.27±0.13. This can be attributed to the balanced ratio of jaggery to liquid glucose in the formulation of the bar.
All samples had mean scores that ranged from ‘like moderately’ to ‘like very much’. Variants did not fall into the category of dislike or neither like nor dislike. Variant V1 had the highest overall acceptability at 7.99±0.13, which did not significantly vary (p<0.05) from the control sample.
It has been observed that food enriched with microalgal biomass has been received positively and with reasonably high acceptability. In the study conducted by Santos et al., (2016), it was reported that the incorporation of Spirulina in powdered shake formulation (for geriatric nutrition) did not affect the acceptance of the product by the target consumer. Microalgae-enriched pasta prepared by Fradique et al., (2010), resulted in highly appealing products of orange and green colour characteristic of algal pigments (chlorophylls, phycocyanin and canthaxanthin), and were accepted by the panellists upon sensory evaluation.
Colour Analysis
Colour plays a role of paramount importance, especially for a bar which is a potential target for children. The colour imparted by Spirulina is neither characteristic nor relatable to nutrition bars, yet it was found to have a certain appeal by the sensory evaluation panel lists. Colour analysis with the parameters L*a*b* values for the control sample and variants have been tabulated (Table 5). The nutrition bar had lesser L*value showed that product was more on the darker side. There was a significant difference between the colours of the variants and control sample, because of the presence of chlorophyll in the Spirulina enriched sample. From the analysis, a substantial decrease in the lightness of the nutrition bars was observed with the addition of Spirulina (L*=30-41) compared to control sample (L*=79). It was also found that there was no significant difference between the variants V1, V2, V3, V4 which all contained the same amount Spirulina, but a decrease in the intensity of darkness, i.e. an increase in L* was found in variants, V5, V6, V7, attributable to the reduction in the content of Spirulina.
Table 5: Texture and Colour Analysis of Nutrition Bars
| Nutrition Bar | Texture Analysis Parameters | Colour Analysis Parameters | |||
| Hardness (g.sec) | Fracturability (sec) | L* | a* | b* | |
| C | 42,720.49±113.84b | 19.08±0.98b | 79.24±0.02c | 15.05±0.03d | 40.23±0.02c |
| V1 | 43,015.47±284.59b | 18.72±0.29b | 30.65±0.01a | -15.41±0.03c | 20.35±0.09a |
| V2 | 89,718.90±394.68d | 23.87±0.05d | 30.49±0.04a | -15.47±0.02c | 20.21±0.08a |
| V3 | 110,511.10±544.76e | 24.19±1.07d | 30.55±0.03a | -15.38±0.05c | 20.29±0.03a |
| V4 | 38,440.05±101.09a | 17.36±0.35a | 30.59±0.03a | -15.45±0.04c | 20.33±0.05a |
| V5 | 83,999.78±120.66d | 23.12±0.46d | 33.09±0.02b | -12.74±0.02b | 25.67±0.01b |
| V6 | 74,435.84±212.24c | 22.78±1.19c | 34.12±0.09b | -11.53±0.06a | 26.52±0.07b |
| V7 | 47,725.89±123.61b | 19.49±0.50b | 32.27±0.07b | -12.76±0.05b | 25.63±0.04b |
Where C=Control sample, V1-7=Variations of Spirulina Enriched Formulation
Values are Mean ± SD of triplicate samples
Different superscripts in columns are significantly different (*P<0.05)
The addition of Spirulina to the nutrition bar resulted in negative a* values and positive b* values, indicating green and yellow hues. A negative a* value of signifies that the bar is more towards greenness which is indubitably due to the presence of Spirulina. A positive b* value is indicative of a yellowness, which may be due to the presence of ingredients like Bengal gram and cornflakes. The a* value of the control sample was found to be 15.05±0.03, while that of the Spirulina enriched variants ranged from -12 to -16. The b* value of the control sample was found to be 40.23±0.02, while that of the Spirulina enriched variants ranged from 20-26.
In certain products like pasta, the colour loss was noticed after subjecting the Spirulina enriched product to cooking. It was observed that the pigments diffused into the cooking water during thermal processing, and colour losses were also associated with pigment oxidation due to exposure to high temperatures. (Fradique et al., 2010). The enrichment of Spirulina in nutrition bars has an added advantage because the colour remains intact during the processing as thermal treatments are perfunctory.
Texture Analysis
Texture attributes are used to monitor and control the product acceptability (Chen & Opara, 2013). The textural properties of the nutrition bar were measured in terms of hardness and fracturability using texture analyser. The variant V3 (110,511.10±544.76 g.s) had the highest hardness while variant V4 (38,440.05±101.09 g.s) had the lowest hardness. Fractur ability in case of variant V4 (17.36±0.35s) was the lowest (Table 5)
The hardness, which is the force required to bite a sample completely when placed between the incisors at one bite per second and fracturability of variant V1 and V7 were not significantly different from the control sample, but the textural features of V1 (hardness 43,015.47±284.59 g.s and fracturability 18.72±0.29 s) was closest to the control sample(hardness 42,720.49±113.84g. sand fracturability 19.08±0.98s).
A relation was established between hardness and the amount of the liquid glucose and jaggery. Variant V4 was found to be soft in chew and had the least quantifiable hardness in comparison to the other variants as it had the maximum amount of liquid glucose and no jaggery. The undesirable hardness of Variant V3 could be attributed to the presence of high amount of jaggery. A direct relation was established between the amount of jaggery used for making the bar and the hardness of the bar.
High protein nutrition bars prepared by Banach, Clark & Lamsal, (2013) with 20 g milk protein concentrate/100 g bar, hardened substantially and became less acceptable. High protein nutrition bars prepared with milk protein isolate possess a crumbly texture and lack cohesion. The bars formulated in this study using Spirulina and the appropriate ratio of all the ingredients showed desirable hardness and did not lack cohesion like in nutrition bars formulated with milk protein isolates.
References
- Rathod R. P., Annapure U. S. Development of extruded fasting snacks by using vari rice, sweet potato and banana powder with applying response surface methodology. Journal of Food Measurement and Characterization. 2016 Sep 1;10(3):715-25.
CrossRef - Potter R., Stojceska V., Plunkett A. The use of fruit powders in extruded snacks suitable for Children’s diets. LWT-Food science and technology. 2013 May 1;51(2):537-44.
CrossRef - Wu Q., Liu L., Miron A., Klímová B., Wan D., Kuča K. The antioxidant, immunomodulatory, and anti-inflammatory activities of Spirulina: an overview. Archives of toxicology. 2016 Aug 1;90(8):1817-40.
CrossRef - Lee J. B., Hayashi T., Hayashi K., Sankawa U., Maeda M., Nemoto T., Nakanishi H. Further purification and structural analysis of calcium spirulan from Spirulina platensis. Journal of natural products. 1998 Sep 25;61(9):1101-4.
CrossRef - Deng R., Chow T. J. Hypolipidemic, antioxidant, and antiinflammatory activities of microalgae Spirulina. Cardiovascular therapeutics. 2010;28(4):33-45.
CrossRef - Soheili M., Khosravi-Darani K. The potential health benefits of algae and micro algae in medicine: a review on Spirulina platensis. Current Nutrition & Food Science. 2011;17(4):279-85.
- Fradique M., Batista A. P., Nunes M. C., Gouveia L., Bandarra N. M., Raymundo A. Incorporation of Chlorella vulgaris and Spirulina maxima biomass in pasta products. Part 1: Preparation and evaluation. Journal of the Science of Food and Agriculture. 2010;90(10):1656-64.
CrossRef - Lemes A. C., Takeuchi K. P., Carvalho J. C., Danesi E. D. Fresh pasta production enriched with Spirulina platensis biomass. Brazilian Archives of Biology and Technology. 2012;55(5):741-50.
CrossRef - De Marco E. R., Steffolani M. E., Martínez C. S., León A. E. Effects of spirulina biomass on the technological and nutritional quality of bread wheat pasta. LWT-Food Science and Technology. 2014;58(1):102-8.
CrossRef - Vijayarani D., Ponnalaghu S., Rajathivya J. Development of value added extruded product using spirulina. International Journal of Health Sciences and Research. 2012;2(4):42-7.
- AOAC International. (1998), 4th revision (16th ed.). Official methods of analysis of AOAC International (Vol. II) (Maryland. USA)
- Merril A. L., Watt B. K. Energy value of foods: Basis and derivation. Washington: United States Department of Agriculture. 1973
- Wu X. J., Hansen C. Antioxidant capacity, phenolic content, and polysaccharide content of Lentinus edodes grown in whey permeate‐based submerged culture. Journal of food science. 2008;73(1):M1-8.
- Li X., Zhou A., Han Y. Anti-oxidation and anti-microorganism activities of purification polysaccharide from Lygodium japonicum in vitro. Carbohydrate Polymers. 2006;66(1):34-42.
CrossRef - Amerine M. A., Pangborn R. M., Roessler E. B. Principles of sensory evaluation of food. Elsevier. 2013.
- Li D. M., Qi Y. Z. Spirulina industry in China: present status and future prospects. Journal of applied Phycology. 1997;9(1):25-8.
CrossRef - Vo T. S., Ngo D. H., Kim S. K. Nutritional and pharmaceutical properties of microalgal Spirulina. InHandbook of Marine Microalgae 2015;299-308.
- Lucas B. F., Morais M. G., Santos T.D., Costa J. A. Effect of Spirulina addition on the physicochemical and structural properties of extruded snacks. Food Science and Technology. 2017;37:16-23.
CrossRef - Santos T. D., de Freitas B. C., Moreira J. B., Zanfonato K., Costa J. A. Development of powdered food with the addition of Spirulina for food supplementation of the elderly population. Innovative Food Science & Emerging Technologies. 2016;37:216-20.
CrossRef - Joshi S. M., Bera M. B., Panesar P. S. Extrusion cooking of maize/spirulina mixture: factors affecting expanded product characteristics and sensory quality. Journal of Food Processing and Preservation. 2014;38(2):655-64.
CrossRef - Chaiklahan R., Chirasuwan N., Triratana P., Loha V., Tia S., Bunnag B. Polysaccharide extraction from Spirulina sp. and its antioxidant capacity. International journal of biological macromolecules. 2013;58:73-8.
CrossRef - El-Baky H. A., El Baz F. K., El-Baroty G. S. Production of phenolic compounds from Spirulina maxima microalgae and its protective effects. African Journal of Biotechnology. 2009;8(24).
- Nguyen S. P., Girgis H., Robinson J. Predictors of children’s food selection: the role of children’s perceptions of the health and taste of foods. Food quality and preference. 2015;1;40:106-9.
CrossRef - Chen L., Opara U. L. Texture measurement approaches in fresh and processed foods—A review. Food Research International. 2013;51(2):823-35.
CrossRef - Banach J. C., Clark S., Lamsal B. P. Texture and other changes during storage in model high-protein nutrition bars formulated with modified milk protein concentrates. LWT-Food Science and Technology. 2014;56(1):77-86.
CrossRef
Accepted on: 15-10-2018
Second Review by: Dr. Anil Panghal (India)
Final Approval by: Dr. Ardiansyah


Web of Science Coverage
Emerging Sources Citation Index (ESCI)
2024 Journal Impact Factor: 1.1
Scopus Journal Metrics
CiteScore 2025: 2.6
CiteScore Details
Sustainable Nutrition: Food Systems, Nutrient Retention, and Public Health Impact
![]()
This journal is a member of, and subscribes to the principles of, the Committee on Publication Ethics (COPE)


