Dietary Changes and Food Preferences Experienced by Older Adult Cancer Patients and the Impact on Health Outcomes
Kisha Coa1*
, Kathy McManus4, Bruce Moskowitz5 1ICF, Rockville, Maryland, USA
2Cedars-Sinai Samuel Oschin Comprehensive Cancer Institute, Los Angeles, CA, USA
3City of Hope, Los Angeles, CA, USA
4Dana- Farber/ Brigham and Women’s Cancer Center, Boston, Massachusetts, USA
5Cancer Nutrition Consortium, Boston, Massachusetts, USA.
Corresponding Author Email: Kisha.Coa@icf.com
DOI : http://dx.doi.org/10.12944/CRNFSJ.6.2.02
Download this article as:
![]()
To describe how cancer treatment influences the dietary behaviors and food preferences of older adult cancer patients and explore associations between these dietary changes and common cancer symptoms.
A convenience sample of 800 cancer patients age 55 years and older undergoing cancer treatment completed a self-administered questionnaire which assessed patients’ dietary changes, food preferences and aversions since starting treatment, and health outcomes. Descriptive statistics were conducted to examine associations between dietary changes and age groups (categorized as 55-64 years old, 65-74 years old, and 75 years old and older), and multivariable logistic regression was used to assess associations between dietary changes and health outcomes
The majority of participants experienced at least one cancer symptom, with fatigue and poor appetite being most commonly reported. About half of respondents reported no change in appetite or thirst, but those who did report a change were more likely to report a decrease in appetite rather than an increase, and more likely to report an increase in thirst rather than a decrease. Most of the patterns were consistent across age groups but the oldest age group (75+) was less likely to report eating less frequently, and less likely to report certain increased taste and smell sensitivities.
Characterizing the nutritional needs of older adult cancer patients is the first step in being able to address these needs. Future research is needed to evaluate potential strategies to address nutritional concerns, and to better understand the unique needs of specific subgroups of older adult cancer patients at high risk of experiencing dietary changes (e.g., those with head and neck cancer).
Cancer; Chemotherapy; Food Preferences; Health Outcomes; Nutrition; Older Adults.
Introduction
Cancer is a disease of aging, the median age of a cancer diagnosis is 66 years, with more than 75% of cancers being diagnosed in adults age 55 years or older.1 In 2017, it is estimated that there will be approximately 1.68 million new cases of cancer in the United States.2 Approximately 30 to 85% of cancer patients (depending on cancer type) experience malnutrition.3 There are multiple mechanisms by which tumors and cancer treatment can lead to malnutrition including affect upon oral function and swallowing, changing resting energy expenditures, and reducing energy intake by reducing appetite, producing chemosensory alterations (i.e., sensitivities to specific tastes or smells), inducing nausea and vomiting, and causing food aversions.4,5 For older adults this is particularly problematic because this can exacerbate dietary alterations that are already occurring as part of the normal aging process, including decreased appetite, deteriorating sense of taste and smell, dental status, and early satiation, all which contribute to decreased energy intake.6-8
Malnutrition disproportionately affects older adults and is associated with increased mortality.9 Malnutrition also negatively impacts quality of life for older adults through multiple domains but these associations tends to be understudied, and nutrition services are not routinely provided to older adults during clinical encounters.10 Given that older adults are more likely to be diagnosed with cancer, and the number of older adults in the US is increasing,11 the need to address nutritional challenges of older adult cancer patients will continue to increase in importance. Although there are strategies that can be used to address dietary issues, many cancer patients who could potentially benefit from these services are not being offered nutritional support.3 There is a need to better understand the nutritional concerns of older adult cancer patients to inform efforts and to address nutrition needs of these patients. The purpose of this paper is to: (1) describe how cancer treatment influences the dietary behaviors and food preferences of older adult cancer patients (age 55 years and older), and (2) explore associations between these dietary changes and common cancer symptoms.
Materials and Methods
Sample
A convenience sample of 1,199 cancer patients ages 18 years and older, of which 800 were age 55 years or older, undergoing active treatment were recruited from seven cancer centers: Roswell Park Cancer Institute, New York University Cancer Institute, Dana Farber/Brigham and Women’s Cancer Center, Sidney Kimmel Comprehensive Cancer Center at Johns Hopkins, University of Chicago Comprehensive Cancer Center, Mayo Clinic Cancer Center, and Cedars-Sinai/Samuel Oschin Comprehensive Cancer Institute. Between April and December 2012, nurses, therapists, and dietitians at participating centers approached patients in waiting areas and other clinical areas to enroll them in the study. Institutional Review Boards at each center approved the study protocol. This study is a sub-analysis of cancer patients age 55 or older. An analysis of the full sample stratified by cancer type was previously conducted.12
Measures
Participants completed a 15-minute self-administered paper-and-pencil survey that captured data on their demographic characteristics, cancer and cancer treatment, co-morbidities, medicines and nutritional supplements, treatment-related dietary changes, food preferences, and primary household food preparer. Variables included in this analysis are:
Demographic & cancer related variables: age; gender; race; and co-morbidities; time since diagnosis; treatment type; cancer type; cancer symptoms (assessed using a checklist); Dietary change variables: change in appetite (3 category response option: increased, stayed about the same, decreased); change in frequency of eating (3 category response option: more often, about the same less often); change in thirst (3 category response option: increased, stayed about the same, decreased); change in frequency of drinking fluids (3 category response option: more often, about the same less often); increased and decreased taste sensitivities – bitter, metallic, salty, sour, sweet (check all that apply); increased sensitivity to various aromas (check all that apply); and food preferences and aversions.; Nutrition-related health outcomes: weight loss (defined as whether participants had lost at least 5lbs since beginning treatment); significant fatigue.
Statistical analysis
Descriptive statistics and chi-square tests were conducted to compare baseline demographic and cancer-related characteristics by age group (55-64, 65-74, 75+) and examine associations between dietary changes and age groups. Multivariable logistic regression was used to assess associations between dietary changes and health outcomes (i.e., significant fatigue, weight change); logistic regression models controlled for age and receipt of chemotherapy. A p-value of 0.05 or less was considered to be statistically significant, and all tests were two-sided. All analyses were conducted using SAS 9.4 software (Cary, NC).
Results:
The sample for this analysis consisted of 800 adult cancer patients age 55 or older (Table 1). Overall the sample was 58.3% female, primarily white (82.2%), about half of participants were diagnosed over a year ago, and chemotherapy was the most prevalent treatment type (89.4%). A little fewer than half of respondents had at least one co-morbidity. Notable differences by age group include the oldest age group (75 years old +) being more likely to have heart disease than other age groups, and being less likely to report undergoing chemotherapy or radiation than the other age groups.
Table 1: Demographic/treatment characteristics by age group
| 55-64 years old (n=329) %(n) | 65-74 years old (n=320)%(n) | 75 years or older (n=151)%(n) | Total (n=800)%(n) | p-value | |
| Gender | |||||
| Female | 57.4 (186) | 60.3 (187) | 55.6 (79) | 58.3 (452) | 0.59 |
| Male | 42.6 (138) | 39.7 (123) | 44.4 (63) | 41.8 (324) | |
| Race/ethnicity | |||||
| White | 83.2 (267) | 79.6 (254) | 85.3 (128) | 82.2 (649) | 0.06 |
| Black | 10.3 (33) | 9.7 (31) | 4.0 (6) | 8.9 (70) | |
| Hispanic | 1.3 (4) | 3.5 (11) | 4.7 (7) | 2.8 (22) | |
| Asian | 1.6 (5) | 4.1 (13) | 2.0 (3) | 2.7 (21) | |
| Other | 3.7 (12) | 3.1 (10) | 4.0 (6) | 3.5 (28) | |
| Cancer type | |||||
| Breast cancer | 15.5 (51) | 10.9 (35) | 10.6 (16) | 12.8 (102) | |
| GI cancers | 17.6 (58) | 14.1 (45) | 16.6 (25) | 16.0 (128) | |
| Lung | 14.9 (49) | 21.3 (68) | 16.6 (25) | 17.8 8 (142) | |
| Other solid1 | 30.1 (99) | 30.3 (97) | 25.2 (38) | 29.3 (234) | |
| Hematologic | 17.9 (59) | 27.2 (87) | 25.8 (39) | 23.1 (185) | |
| Comorbidities | |||||
| Diabetes | 14.6 (48) | 15.0 (48) | 21.2 (32) | 16.0 (128) | 0.15 |
| Heart disease | 10.0 (33) | 11.9 (38) | 19.2 (29) | 12.5 (100) | 0.02 |
| Lung disease | 4.6 (15) | 8.8 (28) | 7.3 (11) | 6.8 (54) | 0.10 |
| Liver | 2.7 (9) | 2.2 (7) | 3.3 (5) | 2.6 (21) | 0.77 |
| Kidney | 1.8 (6) | 2.2 (7) | 3.3 (5) | 2.3 (18) | 0.59 |
| HIV | 0.6 (2) | 0 | 0 | 0.3 (2) | — |
| Other | 18.8 (62) | 19.4 (62) | 12.6 (19) | 17.9 (143) | 0.17 |
| None | 54.7 (180) | 51.6 (165) | 47.7 (72) | 52.1 (417) | 0.35 |
| Time since diagnosis | |||||
| With the past 2 months | 12.6 (41) | 8.9 (28) | 8.1 (12) | 10.3 (81) | 0.053 |
| Within the past 4 months | 18.1 (59) | 13.0 (41) | 12.2 (18) | 14.9 (118) | |
| Within the past 6 months | 12.9 (42) | 10.4 (33) | 10.8 (16) | 11.5 (91) | |
| Within the past 9 months | 6.4 (21) | 6.7 (21) | 3.4 (5) | 6.0 (47) | |
| Within the past year | 6.8 (22) | 7.9 (25) | 4.7 (7) | 6.8 (54) | |
| More than one year ago | 43.3 (141) | 53.2 (168) | 60.8 (90) | 50.5 (399) | |
| Treatment type (all the apply) | |||||
| Chemotherapy | 90.6 (298) | 90.9 (291) | 83.4 (126) | 89.4 (715) | 0.03 |
| Radiation | 17.9 (59) | 14.1 (45) | 6.0 (9) | 14.1 (113) | <0.01 |
| Surgery | 7.6 (25) | 8.1 (26) | 8.0 (12) | 7.9 (63) | 0.97 |
| Hormone therapy | 4.3 (14) | 3.4 (11) | 7.3 (11) | 4.5 (36) | 0.16 |
| Transplant | 1.8 (6) | 0.9 (3) | 0 | 1.1 (9) | — |
| None | 4.0 (13) | 4.0 (13) | 8.0 (12) | 4.8 (38) | 0.12 |
1Other solid tumors: brain or spinal, gynecological, head and neck, prostate, kidney, bladder, osteosarcoma, or soft tissue sarcoma
Cancer symptoms
Eight-four percent of cancer patients age 55 or older reported experiencing at least one cancer symptom, with fatigue being the most common (41.3%) followed by poor appetite, constipation, dry mouth, nausea and gas, all experienced by at least 20% of participants (Figure 1). The frequency of experiencing symptoms was similar across age groups; however, those 75+ were significantly less likely to be experiencing nausea, increased sensitivity to smell, mouth/tongue sores, sore throat, severe pain and sore/bleeding gums than the other age groups.
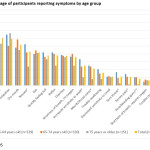 |
Figure 1: Percentage of participants reporting symptoms by age groupClick here to View figure |
Dietary changes since beginning cancer treatment
Approximately 50% of participants experienced changes in appetite and thirst since beginning cancer treatment (Table 2). Decreased appetite (39.1%) was more common than increased appetite (14.1%). The oldest age group was less likely to experience a change in frequency of eating than the other age groups. Increased thirst (28.3%) was more common than decreased thirst (13.3%). There were no significant age related differences in change in thirst.
Table 2: Dietary changes since beginning treatment by age group
| 55-64 years old (n=329)% (n) | 65-74 years old (n=320)% (n) | 75 years or older (n=151)% (n) | Total (n=800)% (n) | ||
| Appetite | |||||
| Increased appetite | 15.2 (49) | 13.5 (42) | 12.9 (19) | 14.1 (110) | 0.49 |
| Same | 47.4 (153) | 44.1 (137) | 51.7 (76) | 46.9 (366) | |
| Decreased appetite | 37.5(121) | 42.4 (132) | 35.4 (52) | 39.1 (305) | |
| Frequency of eating | |||||
| More often | 24.4 (78) | 19.5 (60) | 15.7 (23) | 20.8 (161) | 0.02 |
| About the same | 46.6 (149) | 49.7 (153) | 62.6 (92) | 50.8 (394) | |
| Less often | 29.1 (93) | 30.8 (95) | 21.8 (32) | 28.4 (220) | |
| Thirst | |||||
| Increased thirst | 28.4 (91) | 30.9 (95) | 22.8 (33) | 28.3 (219) | 0.17 |
| Stayed the same | 56.1 (180) | 57.0 (175) | 66.2 (96) | 58.3 (451) | |
| Decreased thirst | 15.6 (50) | 12.1 (37) | 11.0 (16) | 13.3 (103) | |
| Frequency of drinking | |||||
| More often | 47.2 (151) | 45.8 (142) | 43.8 (64) | 46.0 (357) | 0.12 |
| About the same | 40.9 (131) | 45.8 (142) | 50.7 (74) | 44.7 (347) | |
| Less often | 11.9 (38) | 8.4 (26) | 5.5 (8) | 9.3 (72) | |
Chemosensory Alterations
Increased taste sensitivities were more commonly reported than decreased taste sensitivities (Table 3). Cleaning solutions and perfume were the smells most bothersome to participants. When there were age related differences in chemosensory alterations, the oldest age group was less likely to experience alterations – this was the case for increased sensitivity to metallic, sweet, and sour flavors. The oldest age group was also less likely to report sensitivity to the smells of cleaning solutions, perfume, food cooking, and hand sanitizer.
Table 3: Chemosensory alterations by age group
| 55-64 years old (n=329)% (n) | 65-74 years old (n=320)% (n) | 75 years or older (n=151)% (n) | Total (n=800)% (n) | ||
| % (n) reporting increased taste sensitivity | |||||
| Metallic | 19.2 (63) | 15.0 (48) | 8.0 (12) | 15.4 (123) | 0.01 |
| Salty | 15.2 (50) | 14.4 (46) | 9.9 (15) | 13.9 (111) | 0.28 |
| Sweet | 15.8 (52) | 12.2 (39) | 8.0 (12) | 12.9 (103) | 0.05 |
| Bitter | 8.2 (27) | 8.1 (26) | 6.0 (9) | 7.8 (62) | 0.66 |
| Sour | 9.7 (32) | 6.6 (21) | 3.3 (5) | 7.3 (58) | 0.03 |
| %(n) reporting decreased taste sensitivity | |||||
| Sweet | 8.2 (27) | 8.1 (26) | 4.0 (6) | 7.4 (59) | 0.21 |
| Salty | 7.3 (24) | 5.9 (19) | 8.0 (12) | 6.9 (55) | 0.67 |
| Sour | 2.4 (8) | 5.3 (17) | 4.0 (6) | 3.9 (31) | 0.15 |
| Bitter | 4.6 (15) | 3.8 (12) | 2.7 (4) | 3.9 (31) | 0.60 |
| % (n) reporting sensitivity to aroma | |||||
| Cleaning solutions | 26.1 (86) | 17.8 (57) | 12.6 (19) | 20.3 (162) | <0.01 |
| Perfume | 23.7 (78) | 18.8 (60) | 9.3 (14) | 19.0 (152) | <0.01 |
| Food cooking | 10.9 (36) | 11.6 (37) | 4.6 (7) | 10.0 (80) | 0.05 |
| Fish | 9.1 (30) | 7.2 (23) | 6.6 (10) | 7.9 (63) | 0.54 |
| Hand sanitizer | 8.5 (28) | 5.0 (16) | 0.7 (1) | 5.6 (45) | <0.01 |
| Plastic | 4.3 (14) | 4.7 (15) | 2.7 (4) | 4.1 (33) | 0.58 |
| Meat | 4.9 (16) | 4.4 (14) | 1.3 (2) | 4.0 (32) | 0.17 |
| Poultry | 4.3 (14) | 2.5 (8) | 0.7 (1) | 2.9 (23) | 0.08 |
| Dairy | 1.8 (6) | 2.5 (8) | 1.3 (2) | 2.0 (16) | 0.67 |
Food preferences and aversions
The foods that participants were most likely to avoid were greasy/fried foods, spicy, and citrus/acid foods. However, those 75 years old older were less likely to report an aversion to citrus/acidic foods than other age groups (Figure 2). Also, participants age 75 years and older were also less likely to prefer salty foods and ethnic foods (i.e., Mexican, Indian, Asian; Figure 3), but were more likely to prefer meat.
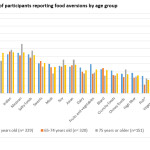 |
Figure 2: Percentage of participants reporting food aversions by age group Click here to View figure |
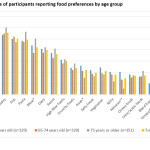 |
Figure 3: Percentage of participants reporting food preferences by age group Click here to View figure |
Differences in health outcomes
In adjusted analyses examining correlates of fatigue, participants who experienced a decreased appetite were 2.04 times more likely (95% CI: 1.35, 3.09) to experience significant fatigue than those whose appetite stayed about the same. Participants who reported a change in frequency of eating – either more often or less often – were also more likely to experience fatigue than those who ate about the same frequency as before treatment (OR: 2.23, 95% CI: 1.38, 3.60 and OR: 1.67, 95% CI: 1.07, 2.63, respectively)
In adjusted analyses examining correlates of weight loss, those who had a decreased appetite were 4.56 times more likely (95% CI: 2.93, 7.08) than those whose appetite stayed the same to report losing 5 or more pounds since beginning treatment. Similarly, those who reported eating less frequently had a 1.98 higher odds of weight loss (95% CI: 1.21, 3.24) than those who ate with about the same frequency as before treatment.
Discussion
Despite advancements in cancer treatment, large numbers of cancer patients are still suffering from nutrition related issues that can impact their quality of life and health outcomes. Our findings are consistent with other studies that demonstrate that cancer and cancer treatment (especially chemotherapy) are associated with dietary changes that can lead to malnutrition.4,13 The majority of participants experienced at least one cancer symptom, with fatigue and poor appetite being the most commonly reported. Overall the patterns were consistent across older age groups (55-64, 65-74, 75+). About half of respondents reported no change in appetite or thirst, but among those who did report a change they were more likely to report a decrease in appetite rather than an increase, and more likely to report an increase in thirst rather than a decrease. Increased taste sensitivities were more common than decreased, with increased metallic and sour sensitivities being more frequently reported. About a fifth of participants had sensitivities to the aromas of cleaning solutions and perfume. Across all age groups, participants who had decreased appetite or changes in frequency of eating were more likely to suffer from fatigue and weight loss.
This study expands upon a previous analysis of these data12 to examine potential differences in the ways in which cancer treatment alter the diets among age segments (55-64, 65-74, 75+) of older adult cancer patients. When there were differences by age group, they were consistent with what would be expected given naturally occurring age related changes in nutrition.7 For example, the oldest age group (75+) was less likely to report eating less frequently, and less likely to report increased taste and smell sensitivities. Appetite decreases with age which may diminish the perceived impact of cancer treatment on amount eaten relative to younger age groups. Similarly, older adults have a dulled sense of taste and smell,14 so chemosensory alterations might be less apparent. This may also be due to patients over 75 years old being less likely to receive chemotherapy.
There are some limitations of this study that warrant consideration. First, these data are based on a convenience sample, and therefore may not be representative of all adult cancer patients age 55 years or older undergoing treatment. Second, the sample of participants in the 75 and older group is smaller (almost half the size) of the other age groups, which may have limited our ability to detect significant differences for this group. Third, we did not capture pre-treatment weight and height, only the number of pounds lost, so we could not assess percent weight loss; typically problematic weight loss is calculated as a specific percentage of weight loss over a period of time.15 Finally, all of these data are based on self-report and therefore subject to reporting biases, and the data are cross sectional so we cannot infer causality.
Nevertheless, this study includes a relatively large, diverse sample of older adult cancer patients recruited from multiple cancer centers, and provides detailed data on nutritional challenges, and food preferences/aversions that can be used to inform the development of nutrition support services. Although nutritional screening guidelines exist,16,17 many patients with nutritional concerns do not receive support for these needs.3 Future studies should assess the specific nutritional needs of older cancer patients by cancer type (e.g., head and neck cancer), especially with cancer patients in the oldest age group. The number of cancer survivors age 75 years and older is continuing to grow 11, and this age group likely has unique needs. Cancer patients in this age group tend to be underrepresented in research studies. This is problematic because there is evidence that the experiences and expectations of these patients may differ from their younger counterparts. For example, they may underreport specific concerns because they view them as a normal part of undergoing cancer treatment and are less familiar with the availability of supportive services.18
Nutritional status is a key component of quality of life in older adults,10 and this makes nutritional assessment in older adults that much more important.6 Geriatric assessment interventions (which include nutritional concerns) have been found to be effective in identifying and addressing unmet needs of older adult cancer patients.19-21 However, geriatric assessments have not been standardized are not routinely conducted for older adult cancer patients.20 There is a growing body of research on strategies that can be used to address nutritional needs of older adults.8,22 For example, Schiffman and colleagues have found flavor enhancement to be an effective strategy for addressing taste and smell losses and improving nutritional status in older adult cancer patients.22 This study provides insights into the food preferences and aversions of older adults that can be incorporated into nutritional strategies. As nutritional counseling and supportive services are refined and more consistently used, research is needed to evaluate the effect of these support interventions on the health and quality of life outcomes of older adult cancer patients.
Acknowledgments
Dr. Coa received funding from the Cancer Nutrition Consortium to prepare this manuscript.
Conflict of Interest
The authors declare they do not have any conflict of interest.
References
- National Cancer Institute. Age. 2017;2015.
- Siegel, R.L., Miller, K.D. & Jemal, A. Cancer Statistics, 2017. CA: a cancer journal for clinicians. 2017;67:7-30.
CrossRef - Hébuterne, X., Lemarie, E., Michallet, M., de Montreuil, C.B., Schneider, S.M., & Goldwasser, F. Prevalence of malnutrition and current use of nutrition support in patients with cancer. Journal of Parenteral and Enteral Nutrition. 2014;38:196-204.
CrossRef - Van Cutsem, E. & Arends, J. The causes and consequences of cancer-associated malnutrition. European Journal of Oncology Nursing. 2005;9:S51-S63.
CrossRef - Hopkinson, J.B. Nutritional support of the elderly cancer patient: The role of the nurse. Nutrition. 2015;31:598-602.
CrossRef - Ahmed, T. & Haboubi, N. Assessment and management of nutrition in older people and its importance to health. Clinical interventions in aging. 2010;5:207.
- Brownie, S. Why are elderly individuals at risk of nutritional deficiency? International journal of nursing practice. 2006;12:110-118.
CrossRef - Nieuwenhuizen, W.F., Weenen, H., Rigby, P. & Hetherington, M.M. Older adults and patients in need of nutritional support: review of current treatment options and factors influencing nutritional intake. Clinical nutrition. 2010;29:160-169.
CrossRef - Sahyoun, N., Serdula, M., Galuska, D., Zhang, X. & Pamuk, E. The epidemiology of recent involuntary weight loss in the United States population. The journal of nutrition, health & aging. 2004;8:510-517.
- Amarantos, E., Martinez, A. & Dwyer, J. Nutrition and quality of life in older adults. The Journals of Gerontology series A: Biological sciences and Medical sciences. 2001;56:54-64.
CrossRef - Bluethmann, S.M., Mariotto, A.B. & Rowland, J.H. Anticipating the “Silver Tsunami”: prevalence trajectories and comorbidity burden among older cancer survivors in the United States. AACR. 2016.
- Coa, K.I. Epstein, J.B., Ettinger, D., Jatoi, A., McManus, K., Platek, M., Price, W., Steward, M., Teknos, T.N., & Moskowitz, B. The impact of cancer treatment on the diets and food preferences of patients receiving outpatient treatment. Nutrition and cancer. 2015;67:339-353.
CrossRef - von Meyenfeldt, M. Cancer-associated malnutrition: an introduction. European Journal of Oncology Nursing. 2005;9:S35-S38.
CrossRef - Schiffman, S. & Graham, B. Taste and smell perception affect appetite and immunity in the elderly. European journal of clinical nutrition. 2000;54:S54.
CrossRef - National Cancer Institute. Nutrition in Cancer Care (PDQ) – Health Professional Version: Basic Principles of Nutrition in Patients With Cancer. 2017.
- Huhmann, M.B. & August, D.A. Review of American Society for Parenteral and Enteral Nutrition (ASPEN) clinical guidelines for nutrition support in cancer patients: nutrition screening and assessment. Nutrition in Clinical Practice. 2008;23:182-188.
CrossRef - Arends, J. Bachmann, P., Baracos, V., Barthelemy, N., Bertz, H., Bozzetti, F., Fearon, K., Hutterer, E., Isenring, E., & Kaasa, S. ESPEN guidelines on nutrition in cancer patients. Clinical Nutrition. 2017;36:11-48.
CrossRef - Puts, M., Papoutsis, A., Springall, E. & Tourangeau, A. A systematic review of unmet needs of newly diagnosed older cancer patients undergoing active cancer treatment. Supportive Care in Cancer. 2012;20:1377-1394.
CrossRef - Kalsi, T., Babic-Illman, G., Ross, P.J., Maisey, N.R., Hughes, S., Fields, P., Martin, F.C., Wang, Y., & Harari, D. The impact of comprehensive geriatric assessment interventions on tolerance to chemotherapy in older people. British journal of cancer. 2015;112:1435.
CrossRef - Wildiers, H., Heeren, P., Puts, M., Topinkova, E., Janssen-Heijnen, M.L.G., Extermann, M., Falandry, C., Artz, A., Brain, E., Colloca, G. International Society of Geriatric Oncology consensus on geriatric assessment in older patients with cancer. Journal of clinical oncology. 2014;32:2595.
CrossRef - Balducci, L. New paradigms for treating elderly patients with cancer: the comprehensive geriatric assessment and guidelines for supportive care. J Support Oncol. 2003;1:30-37.
- Schiffman, S., Sattely-Miller, E., Taylor, E., Graham, B., Landerman, L., Zervakis, J., Campagna, L., Cohen, H., Blackwell, S., & Garst, J. Combination of flavor enhancement and chemosensory education improves nutritional status in older cancer patients. The journal of nutrition, health & aging. 2007;11:439.
Accepted on: 07-08-2018
Second Review by: Dr. Setyaningrum Rahmawaty (Indonesia)
Final Approval by: Prof. Min-Hsiung Pan


Web of Science Coverage
Emerging Sources Citation Index (ESCI)
2024 Journal Impact Factor: 1.1
Scopus Journal Metrics
CiteScore 2025: 2.6
CiteScore Details
Sustainable Nutrition: Food Systems, Nutrient Retention, and Public Health Impact
![]()
This journal is a member of, and subscribes to the principles of, the Committee on Publication Ethics (COPE)


