Pitfalls Of Using Body Mass Index (BMI) In Assessment Of Obesity Risk
Department of Health Sciences, Faculty of Science, University of Mauritius, Réduit, Mauritius.
DOI : http://dx.doi.org/10.12944/CRNFSJ.1.1.07
Download this article as:
![]()
This review focuses on the potential drawbacks of using body mass index (BMI) which are often overlooked in the assessment of overweight or obesity risk, with special emphasis on the use of other equally important anthropometric measurements such as waist circumference (WC), waist-hip-ratio (WHR) and skin-fold thicknesses. There have been inconsistencies in findings when using BMI as an indicator of obesity risk. These have arisen mainly due to gender, age and ethnic differences in body fat composition and distribution coupled with increased reliance on self-reported values of weight and height. Since BMI remains the most widely used tool to screen obesity risk in many studies, establishment of gender-, age- and ethnicity-based cut-offs of BMI, tailored to specific populations, will significantly enhance public health policies and increase the success rates of obesity intervention programs. The use of other anthropometric measures such as WC and WHR in conjunction with BMI is also highly recommended to assess abdominal obesity or other body-specific areas.
KEYWORDS:Body mass index,anthropometry,waist circumference,waist hip ratio
Introduction
This review focuses on the potential drawbacks of using body mass index (BMI) which are often overlooked in the assessment of overweight or obesity risk, with special emphasis on the use of other equally important anthropometric measurements such as waist circumference (WC), waist-hip-ratio (WHR) and skin-fold thicknesses. There have been inconsistencies in findings when using BMI as an indicator of obesity risk. These have arisen mainly due to gender, age and ethnic differences in body fat composition and distribution coupled with increased reliance on self-reported values of weight and height. Since BMI remains the most widely used tool to screen obesity risk in many studies, establishment of gender-, age- and ethnicity-based cut-offs of BMI, tailored to specific populations, will significantly enhance public health policies and increase the success rates of obesity intervention programs. The use of other anthropometric measures such as WC and WHR in conjunction with BMI is also highly recommended to assess abdominal obesity or other body-specific areas.
Since obesity has become one of the most critical public health issues worldwide, application of BMI has gained increased popularity and has been directly linked to health risks and death rates in many populations,2 irrespective of age, sex and ethnicity.3
It was only in the late 1980s and early 1990s that questions were raised concerning the reliability of BMI as a predictor of obesity.4 Findings from cross-sectional and prospective epidemiological survey,4 provide robust evidence that the cut-offs of BMI provided by the World Health Organisation (WHO), do not adequately reflect the overweight or obesity status of all populations.5 For instance, a higher body fat percentage is correlated with lower BMIs among Asians while among Pacific Islanders, higher BMIs tend to be associated with more muscle mass and less body fat.6 Apart from ethnicity, the universal applicability of BMI has also been raised concerning age, physical activity and most importantly, as a less reliable predictor of cardiovascular risk.3
Controversies concerning the usefulness of BMI in predicting body fat may significantly impact several specialised areas such as risks of coronary heart diseases, diabetes, weight loss programs, population health surveys, epidemiological studies of diet and health, sports and fitness training among others.3 Hence, addressing the reliability of BMI and its drawbacks as an appropriate predictor of obesity risk is of primordial importance, especially in policy-making strategies to target high-risk populations in obesity prevention programs. The objectives of this paper are:
- To describe potential pitfalls of BMI which are often overlooked in epidemiological studies
- To outline other equally important anthropometric measurements as indicators of obesity risk
Body Mass Index (BMI) as a Measure of Obesity
To date, BMI is the best available anthropometric estimate of body fatness for public health purposes.7 Higher BMIs usually mean higher body fat and as BMI increases, especially from values equal to or greater than 30, health risks increase.1 BMI measures excess body weight for a particular height and has been shown to correlate with body fat although it is not a direct measure of body fat.8 BMI cut points recommended in 1998 by the WHO were the first such cut-offs at the international level6 as shown in Table 1.
BMI has been the most widely used measure of weight-related health risk because direct measures of body fat, example skin fold measures and underwater weighing, are more invasive and costly methods.8 Moreover, direct measurements of body fat require more time, better facilities, well-trained staff and tedious methodology.3 BMI cut-offs points are also better suited for epidemiological settings whereby relationships between BMI and health outcomes within and across populations are used to help ascertain the possible causes of diseases.2 As such, the increased use of BMI has been propelled by findings among overweight and obese BMI categories of people which showed that a BMI greater or equal to 30 increases the risk of high blood pressure, heart diseases, stroke, diabetes, and certain types of cancer, arthritis and breathing problems.1 Additionally, while direct measurements of subcutaneous fat such as triceps skin fold thickness are reasonably well correlated with percentage body fat, such measurement used by different observers and among fatter subjects may be difficult to reproduce.10 Contrarily, height and weight measurements and weight-for-height indices provide a more reliable measure of body fat that can be used to compare adiposity within and between distinct populations.10
Potential Pitfalls of BMI as a Measure of Obesity
Ideal measurements of body fat should be reliable and correlate well with body fat, regardless of sex, age and ethnicity.10 Each method has its own set of advantages and limitations. Likewise, BMI has some major drawbacks. The relationship between BMI and body fat percentage is affected by environmental factors such as physical activity level and age, gender and ethnicity.2 Hence, on an individual basis, other measures of adiposity may be more useful and reliable.
Ageing and BMI
Ageing is associated with significant changes in body composition, with a substantial reduction in fat-free-mass (FFM) and muscle mass and an increase in visceral fat even if body weight remains unaltered.11 Health risks are more closely related to intra-abdominal and visceral fat mass (VFM).7 Since BMI does not correlate well with VFM, it does not stand as a reliable indicator of health status of an individual.7 This has been supported by studies based on comparison of young subjects to old subjects who had similar BMIs whereby the older ones had a greater percentage of body weight as fat.12 Additionally, it has been demonstrated that among people aged 70 or above, mortality risk is lowest in those classified as overweight by the WHO while people, who were categorised as normal weight by the WHO, had a higher risk of death than their overweight counterparts.13 The use of BMI in elderly persons could also be misleading due to the frequent prevalence of diseases, a decrease in the amount of body fluids and the lack of specific cut-off points for this age group.14 These results have raised concerns about encouraging overweight older adults to lose weight.13 However, discrepant outcomes may have arisen in observational studies due to reverse causality which suggests that older adults often lose weight after being ill and prior to dying.13 Thus, it has been suggested that measures of adiposity such as waist circumference (WC) or the waist-hip-ratio (WHR), which better reflect VFM, may be better indicators of obesity risk and mortality among the elderly than is BMI.11 Centralisation of body fat seems to be a better predictor of morbidity and mortality among elderly.14 The composite use of WC and mid-arm muscle circumference (MUAC) have thus been recommended in clinical practice to assess mortality risk among the elderly as they have been associated with significantly increased mortality risk in this cohort.11
Gender and BMI
Past studies have shown that women have generally higher prevalence of obesity compared to men, especially after the age of 50.15 Visceral or subcutaneous fat gains are linked to initial amount of fat and increases in body mass, and these transformations differ in men and women.14 This is due to the fact that ageing leads to the redistribution and internalisation of abdominal fat among women as shown through computerised tomography.14 Moreover, in younger males, BMI increases with increasing height in contrast to a decrease in BMI with increasing height in age-matched females.16 Above the age of 60, dyslipidemia risk is more prevalent among women than men due to decreasing levels of protective hormones and such a physiological change in body fat percentage between males and females is not effectively gauged by BMI.29 Therefore, the inclusion of body composition estimates in ongoing population studies has been found to help in the clarification of the female to male relations between morbidity, BMI, and fatness.12
Ethnicity and BMI
Besides age and gender, significant ethnic differences in body composition (i.e ratio between FFM and fat mass) were found.7 For instance, studies in Hong Kong and Singapore reported that the risk for diabetes or cardiovascular diseases is high at lower BMIs with Asian Indians having a higher BMI and abdominal fat and excess fat.5 In comparison to Europeans, Polynesians have a low proportion fat mass to lean mass, but alongside suffer from a higher risk of diabetes.2 Ethnic differences in total body weight and fatness have also been reflected by a greater WHR among black subjects.12 Distinct Asian cut-offs for overweight, based on a BMI of 23.0-24.9 kg/m2, are already being used to assess morbidity in these populations.30 Likewise, in Mauritius, a higher risk of type 2 diabetes has been reported among Indian Asians at this BMI cut-off.30 Ethnic differences in diabetes prevalence have been also found among underweight individuals.31 In addition to fat distribution, hypertension risk,30 and type 2 diabetes risk,31 ethnicity also contributes to dissimilitude in muscularity, bone mass and leg length which strengthens the ethnic-specific relationships between body fatness and BMI.5 These ethnic differences in body fatness underlie genetically determined changes in body composition and metabolism, in addition to an array of risk factors due to distinct social and environmental factors.30 Since re-defining new BMI cut-offs for specific ethnic populations is not feasible due to mainly a lack of availability of data for a specific population, WC can also be used to refine public health action levels based on BMI.2
Reliability and Validity of Using Self-Reported BMI
Nutritional epidemiology relies heavily on the use of self-reported anthropometric data to assess nutritional status due to reduced costs and simplification of field work.17 Self-reports in weights and heights have been considered as reliable among adults and high correlations have also been established between self-reports measures and actual measurements.32 However, although reliability of self-reported data may be high, its validity is still uncertain.17,32 This stands true for BMI as well. Previous findings have consistently shown that among adults, body weight was significantly under-reported and body height was significantly over-reported18 with a significant misclassification of BMI categories.33 In particular, misclassification of the various BMI categories can mask the true relationships which exist between obesity and chronic health states such as heart disease, asthma, diabetes, high blood pressure and more recently, with sleeping disturbances.33 Although feasible in large-scale studies, the use of self-reported BMI would underestimate the true prevalence of overweight or risk of overweight since target populations like females and heavier youth tend to underestimate their weight, leading to other population groups, example men, being targeted more often for prevention programs.19 Low income groups, as well, tend to under-report their weight in contrast to their higher-income counterparts who are more aware of their present weight due to a better access to weight loss programs and diet foods.34 It is also highly probable that overweight and obese individuals are less likely to weight themselves and hence report their weight with less accuracy.34 Other equally important sources of bias arise due to inadequate procedures such as heavy clothes, shoes, use of non-calibrated instruments and participants assessing their own measures.17
Use of Other Measurements
Since concerns over the validity of using BMI to screen overweight and obesity, other anthropometric-based measurements such as WC and skin-fold thicknesses have been increasingly used in both men and women. However, are they better clinical tools than BMI? There is still a high probability that they are subjected to the same biases as BMI (for instance with inaccurate self-reporting and measurements).
Skin-Fold Thicknesses
Traditionally, measurements of skin-fold thicknesses have been used to estimate body fatness and they correlate reasonably well with body fatness.20 Nevertheless, there are uncertainties about its accuracy because skin-fold thicknesses are poorly reproducible methods and only a few regional body sites are measured.20 Reproducibility of skin-fold callipers has often been questioned by clinicians and accurate measurement might be difficult to obtain in those individuals with adipose tissue that does not separate well from the underlying muscle or when the end range of the tool is not large enough to capture the entire subcutaneous fat thickness.21 Even so, demonstration of the appropriate placement of the skin-fold callipers, use of illustrations with written instructions and practical sessions in which the skin was measured at different appropriate sites (thigh, supra-ilium and abdomen) in a study significantly improved skin-fold outcomes.22
Mid-Upper Arm Circumference
Mid-Upper Arm Circumference (MUAC) is advantageous over BMI and skin-fold measures because it is less intrusive than other anthropometric measures and it requires inexpensive equipment, not needing calibration or maintenance.23 Moreover, in low-income settings, MUAC proves to be very useful in the absence of inappropriate weighing scales and stadiometer.23 It has been proposed that since MUAC closely reflects body fat tissue, it can be used along with BMI to assess obesity risk.24 The Malnutrition Action Group, from the British Association of Parenteral and Enteral Nutrition, has established specific MUAC cut-offs used with BMI to assess malnutrition in individuals.25 Despite being a relatively easy method, small measurement errors such as incorrect choice of arm, inappropriate positioning of the tape measure at the midpoint between the acromion and the olecran, incorrect horizontal positioning and insufficient compressive force can lead to erroneous interpretations.26
Waist Circumference (WC) and Waist-Hip-Ratio (WHR)
WC and WHR are measures of abdominal or central obesity.18 WC must be taken with a tape measure as the point midway between the coastal margin and iliac crest in the mid-axillary line, with the subject standing and breathing normally while hip circumference (HC) is measured at the widest point around the greater trochanter.27 WHR is then calculated as the WC divided by the HC.27 Assessment of central obesity is crucial since it is associated with high risks of cardiovascular and metabolic diseases.28 Measuring WC alone is a simpler way of assessing for abdominal fat and has been shown by recent studies to be superior to WHR in determining health risks.27 In addition, WC, rather than BMI is recommended as an index of obesity-health risks in adults as well as in the paediatric population since WC is a highly sensitive and specific measure of truncal adiposity and a strong predictor of visceral obesity.24 Table 3 demonstrates the WC and WHR guidelines to assess abdominal obesity risk in both genders. Nonetheless, it was found that WC was over-reported, especially in males, heavier subjects, less tall subjects and post-menopausal women although under-reporting also is common due to inability of participants to properly hold the measuring tape tight enough and measuring the WC at a larger site rather than at the midpoint.18 Inconsistent results in WC measurements can also result if subjects have measured their WC at the end of an inhalation when their waist is being pulled out instead of an exhalation’s end.34 However, there is no evidence to indicate that inability to accurately measure WC can lead to over-reporting.34
Conclusion
BMI does not measure overweight or obesity risk and mortality risk with the same accuracy in all target populations due to variations in body fat composition and distribution. Other measures of fatness such as WC and WHR should be considered in conjunction with BMI to assess body-specific areas such as the location or distribution of fat in the abdomen. Despite its drawbacks, BMI remains one of the most widely used tools to screen obesity risk in several target populations as it is simple, inexpensive and non-intrusive. Other factors such as gender, age and ethnicity should also be taken into consideration when using BMI in public health policies and to increase the success rates of obesity intervention programs.
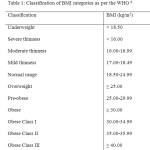 |
Table 1: Classification of BMI categories as per the WHO 9 Click here to View table |
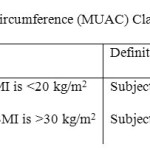 |
Table 2: Mid Upper Arm Circumference (MUAC) Classification 25 Click here to View table |
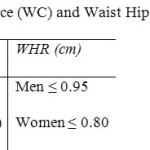 |
Table 3: Waist Circumference (WC) and Waist Hip Ratio (WHR) Guidelines 27 Click here to View table |
References
- Hiza H.A., Pratt C., Mardis M.D. and Anand R., Nutr. Insights, 16, 1 (2000).
- WHO expert consultation, Lancet, 363, 157 (2004).
CrossRef - Muralidhara, D.V., Thai J. Physiol. Sci., 20, 2, 97 (2008).
- Ashwell M., Open J. Obesity, 3, 78 (2011).
CrossRef - Kesavachandran C.N., Bihari V. and Mathur N., Indian J. Med. Res., 135, 72 (2012).
CrossRef - Weisell R.C., Asia Pacific J. Clin. Nutr., 11, S681, (2002).
CrossRef - Hall D.M.B. and Cole T.J., Arch Dis Child., 91, 4, 283 (2008).
- Nihiser A.J., Lee S.M., Wechsler H., McKenna M., Odom E., Reinold C., Thompson D. and Grummer-Strawn L., J. Sch. Health, 77, 10, 651 (2007).
- World Health Organisation, 2013. Global Database on Body Mass Index [online]. Available from: http://apps.who.int/bmi/index.jsp?introPage=intro_3.html.
- Dietz W.H. and Bellizzi, M.C., Am. J. Clin. Nutr., 70, 1, 123S (1999).
- Wannamethee S.G., Shaper A.G., Lennon L. and Whincup P.H., Am. J. Clin. Nutr., 86, 5, 1339 (2007).
- Gallagher D., Visser M., Sepulveda D., Pierson R.N., Harris T. and Heymsfield S.B., Am. J. Epidemiol., 143, 3, 228 (1996).
- Flicker L., McCaul K.A., Hankey G.J., Jamrozik K., Brown W.J., Byles J.E. and Almeida O.P., J. Am. Geriatr. Soc., 58, 234 (2010).
CrossRef - Santos D.M.D. and Sichieri R., Rev Saude Publica, 39, 2, 1 (2005).
- Seidell J.C. and Flegal K., Br. Med. Bull., 53, 2, 238 (1997).
- Mandel D., Zimlichman E., Mimouni F.B., Grotto I. and Kreiss Y., J. Am. Coll. Nutr., 23, 1, 51 (2004).
- Enes C.C., Fernandez P.M.F., Voci S.M., Toral N., Romero A. and Slater B., Rev. Bras. Epidemiol., 12, 4, 627 (2009).
- Dekkers J.C., Wier M.F.V., Hendriksen I.J.M., Twisk J.W.R. and Mechelen W.V., BMC Med. Res. Methodol., 8, 69 (2008).
CrossRef - Sherry B., Jefferds M.E. and Grummer-Strawn L.M., Arch. Pediatr. Adolesc. Med., 161, 12, 1154 (2007).
- Mei Z., Grummer-Strawn L.M., Pietrobelli A., Goulding A., Goran M.I. and Dietz W.H., Am. J. Clin. Nutr., 75, 6, 978 (2002).
- Selkow N., Pietrosimone B.G. and Saliba S.A., J. Athlet. Train., 46, 1, 50 (2011).
- Kispert C.P. and Merrifield H.C., Phys. Ther., 67, 917 (1987).
CrossRef - Haboubi H.N., Kennedy A.J., Sheriff S.P. and Haboubi N.Y., Gastroenterol. Today, 20, 2, 41 (2010).
- Mazicioglu M.M., Hatipoglu N., Ozturk A., Cicek B., Ustunbas H.B. and Kurtoglu S., J. Clin. Res. Ped. Endo., 2, 4, 144 (2010).
- The Malnutrition Action Group, Brit. Assoc. Parenter. Enter. Nutr., 1 (2003).
- Almeida C.A.N., Ciampo L.A.D., Ricco R.G., Silva S.M., Naves R.B and Pina J.F., J. Pediatr., 79, 5, 455 (2003).
- Odenigbo U.M., Odenigbo U.C., Oguejiofor O.C. and Adogu P.O.U., Pakistan J. Nutr., 10, 1, 15 (2011).
- Mushtaq M.U., Gull S., Abdullah H.M., Shahid U., Shad M.A. and Akram J., BMC Pediatr., 11, 105 (2011).
CrossRef - Humayun A., Shah A.S., Alam S. and Hussein H., J. Ayub. Med. Coll. Abbottabad., 21, 2, 141 (2009).
- Bell A.C., Adair L.S. and Popkin B.M., Am. J. Epidemiol., 155, 4, 346 (2002).
- Maskarinec G., Grandinetti A., Matsuura G., Sharma S., Mau M., Henderson B.E. and Kolonel L.N., Ethn. Dis., 19, 49 (2009).
- Perez-Cueto F.J.A. and Verbeke W., Nutr. Hosp., 24, 3, 366 (2009).
- Lin J-M. S., Decker M.J., Brimmer D.J. and Reeves W.C., Open J. Obesity, 2, 145 (2010).
CrossRef - Dekkers J.C., Wier M.F., Hendriksen I.J.M., Twisk J.W.R. and Mechelen W., BMC Med. Res. Methodol., 8, 69 (2008).
CrossRef
Accepted on: August 20, 2013


Web of Science Coverage
Emerging Sources Citation Index (ESCI)
2024 Journal Impact Factor: 1.1
Scopus Journal Metrics
CiteScore 2025: 2.6
CiteScore Details
Sustainable Nutrition: Food Systems, Nutrient Retention, and Public Health Impact
![]()
This journal is a member of, and subscribes to the principles of, the Committee on Publication Ethics (COPE)


