Physicochemical, Sensory, and Shelf-Life Properties of Tapioca Crispy Crackers Enriched with Fairy Mushroom (Pleurotus sajor-caju)
 , Wisutthana Samutsri* and Sujittra Thimthuad
 Department of Food Science and Technology, Phranakhon Rajabhat University, Bangkok, Thailand.
Corresponding Author E-mail: wisutthana@pnru.ac.th
DOI : http://dx.doi.org/10.12944/CRNFSJ.13.3.25
Download this article as:
![]()
To address the current oversupply and price decline of mushrooms, their nutritional and functional attributes were utilized to develop a value-added product from fairy mushrooms using simple and low-cost technology. The objective of this study was to investigate the possibility of using fairy mushrooms (Pleurotus sajor-caju (Fr. Singers)) to produce crispy tapioca crackers. This study incorporated ground fairy mushrooms at varying amounts (20%, 30%, 40%, and 50%) to replace tapioca flour in a formula for crispy tapioca crackers. Moisture content, Water activity (aw), and color of uncooked tapioca crispy crackers samples were measured. Physical characteristics (expansion, hardness, fracturability, and color) and sensory quality of the developed tapioca crispy crackers were examined using a 7-points hedonic scale by 30 semi-trained panalists. Results showed the tapioca crispy crackers with fairy mushrooms were found to be significantly darker, with less expansion, greater hardness and fracturability, and higher consumer acceptance compared to the control samples (p < 0.05). Panelists favored the 250 g substitution for its umami flavor and balanced crispiness. The tapioca crispy crackers with 250 g of fairy mushrooms obtained the highest liking scores of sensory evaluations and were chosen for the final product study. Analysis of the shelf life of the product stored in thick polypropylene bags at a room temperature of 30 ºC was carried out once a week for four weeks. Moisture content, aw, Peroxide values, and lipid oxidation (TBARS) increased while the hardness and fracturability of the final tapioca crispy crackers product decreased with increasing storage time. Peroxide values remained below 0.12 g/100g, indicating acceptable oxidative stability. The tapioca crispy crackers containing 250 g of fairy mushrooms exhibited good physical and chemical properties, remaining suitable for consumption for up to four weeks. It offers a nutrient-dense, shelf-stable alternative for commercial snack production, addressing both market demand and mushroom utilization.
KEYWORDS:Fairy Mushroom; Physicochemical Properties; Sensory Evaluation; Shelf Life; Tapioca Crispy Crackers
Introduction
Fairy mushrooms (Pleurotus sajor-caju (Fr. Singers)) or grey oyster mushrooms are popular economic mushrooms. This easy-to-grow mushroom can be cultivated throughout the year. Finimundy et al.1 documented that it resembles abalone mushrooms with a white flower and a soft, light brown cap. The cap is dense and dark, while the flower stalk is long and white in color without any ring. The white fins of the fairy mushroom are closer than the abalone mushroom. The fibers of the fairy mushroom are fine, sweet, and fragrant.1 Fairy mushrooms are versatile and can be used to cook many dishes. They can also be processed in different ways, such as deep-fried fairy mushrooms, mushroom tapioca crispy crackers, mushroom fermented pork, etc. Mushrooms are classified as a vegetable food high in protein and vitamins, low in fat, and high in fiber. These vegetables, often referred to as the “King of Vegetables,” can be consumed by individuals of all ages and genders. Pleurotus spp. are rich in medicinal and nutritional properties. It has anti-cancerous, anti-inflammatory, antiviral, antibiotic, anti-diabetic, and anti-modulator effects.1 Nutritionally, it is rich in protein, minerals, and vitamins B, C, and D, as described by Panjikkaran and Mathew.2 Fairy mushrooms have a unique taste and contain the amino acid glutamic acid, along with various minerals that are responsible for regulating heart rhythm and water balance in the body. Wan-Mohtar3 reported that P. sajor-caju showed high free radical scavenging activity from three antioxidant assays: total phenolic content (TPC), ferric reducing antioxidant power (FRAP), and [2,2’-azinobis-(3-ethylbenzothiazoline-6-sulfonate)] (ABTS) assays, thus showing a high potential for an antioxidative flour replacement in food technology. These nutritional and functional attributes highlight mushrooms as promising ingredients for the development of value-added foods. At present, an oversupply of mushrooms in the market has led to a decline in prices. To address this issue, a new product has been developed using simple and low-cost technology to increase the value of fairy mushrooms. The newly developed product, mushroom tapioca crispy crackers, is a snack intended for general consumption.
Currently, snack products are in high demand in the US market, worth up to 193 billion US dollars in 2021, as reported by Grand View Research Inc.4 According to the report of Food Intelligence Center,5 the snack market in Thailand was worth up to 45,338 million baht (1 US dollar ~ 34.62 baht) from 2021 to 2022. Lusas and Rooney6 found that the desired snack is made from natural ingredients with less odor and is high in nutrients. Tapioca crispy crackers are a popular snack in Thailand that is easy to produce and cost-effective. The resulting product has unique characteristics. Typically, tapioca starch is used as the main ingredient in making tapioca crispy crackers, and ingredients such as shrimp, fish, and vegetables (such as pumpkin, corn, and mushrooms) are added to enhance the flavor and increase nutritional value. Tapioca flour was selected as the primary starch for producing crispy crackers due to its neutral flavor, high starch purity, and unique gelatinization properties that promote crispness and light texture. Compared with rice or corn starch, tapioca flour provides superior expansion, transparency, and binding ability, which are essential for achieving the desirable physicochemical and sensory qualities of crispy crackers, was found by Cankal et al.7 The development of cracker products using starch from alternative plant sources effectively leverages local agricultural resources and provides consumers with diverse choices. Despite mushroom-based snacks’ popularity, no studies have assessed P. sajor-caju in tapioca crackers, particularly their effects on texture and oxidative stability. It was hypothesized that fairy mushroom substitution would alter the texture by affecting hardness and factorability, and that higher substitution levels would affect sensory acceptance, even a darker color. Thus, the study investigated the suitability of fairy mushrooms for producing tapioca crispy crackers by varying the mushroom content (20%, 30%, 40%, and 50% of tapioca flour) and analyzing the characteristic, sensory, and shelf-life qualities of the final product. This study also evaluates mushroom protein and fiber content while maintaining shelf stability.
Materials and Methods
Materials
Fresh fairy mushrooms (pieurotus sajor-caju (Fr. Singers)) in the mature stage, not overly fibrous, were obtained from the Banmakokwan community in Chaibadan district, Lopburi province, Thailand. Tapioca flour, corn flour, sugar, salt, seasoning powder, fried onion, coriander root, pepper, and garlic were purchased from a local supermarket in Bangkok, Thailand.
Preparation of mushrooms
The mushrooms were washed with water and drained. Then, the mushrooms were pre-cooked by steaming them in a steamer with boiling water for 30 min, adapted from the method of Charoen et al.8 After steaming, the mushrooms were cooled, and excess water was removed by pressing in cheesecloth at 5 kg for 5 min. The mushrooms were finely chopped and kept in thick polypropylene bags, stored at 4±2 ºC until use.
Preparation of tapioca crispy crackers
In this work, tapioca crispy crackers samples substituted tapioca flour with ground fairy mushrooms of 0, 100, 150, 200, and 250 (g) were studied. The tapioca crispy crackers without ground fairy mushrooms were used as a control sample. The ingredients and composition of the tapioca crispy cracker dough were adapted from the study by Panyoyai et al.,9 and are presented in Table 1.
Table 1: Basic tapioca crispy crackers formula
|
Ingredients |
Quantity | |
| (g) |
(%) |
|
|
Tapioca flour |
500 | 62.03 |
| Corn flour | 10 |
1.25 |
|
Sugar |
30 | 3.72 |
| Salt | 6 |
0.74 |
|
Seasoning powder |
6 | 0.74 |
| Fried onion | 30 |
3.72 |
|
Chopped coriander root |
10 | 1.25 |
| Ground pepper | 4 |
0.50 |
|
Minced garlic |
10 | 1.25 |
| Water | 200 |
24.80 |
|
Total |
806 |
100 |
From Table 1, the tapioca flour was mixed with corn flour and sifted through a 60-mesh sieve to ensure the mixture was free of lumps. Tapioca flour contents in the dough process were varied and partially replaced by ground fairy mushrooms at contents of 0, 100, 150, 200, and 250 (g) of total tapioca flour. Substitution levels (20–50% of tapioca flour) were selected to balance nutritional enhancement with structural integrity. In this process, fairy mushrooms were added and mixed well. Then, all the ingredients except water were added and mixed well. The water was slowly added. The flour mixture and all ingredients were kneaded until a cohesive, non-sticky dough was formed. The dough was then allowed to rest for 15 min. Roll the dough for 200 g into long pieces with a diameter of 1 inch and wrap them tightly with clear wrap. Steam the long dough in boiling water for 1 h. Let the steamed dough cool down and refrigerate it overnight. The refrigerated dough was cut into thin strips about 0.2 cm thick. The pieces of dough are called uncooked tapioca crispy crackers. The uncooked tapioca crispy crackers were baked in a hot cabinet at 60 ºC for 3 h, then fried in palm oil at 180 ºC for 2 min, drained the oil out of the tapioca crispy crackers, and packed in thick polypropylene plastic bags.
Physicochemical measurements
Moisture content measurement
The moisture content of mushroom samples was determined by the oven drying method according to AOAC(2025).10
Water activity measurement
Approximately 2 g of each ground tapioca crispy crackers sample was placed in the water activity tray, and aw was measured using a water activity meter (Aqua Lab, Series 3 WA, USA), recorded, and reported as a ratio. Three of the tapioca crispy crackers were performed for each analysis according to the method of Maisont et al.11
Color measurement
The typical 3 g of each ground tapioca crispy crackers sample was transferred into a petri dish and measured by reading the values at the surface of the ground sample using a colorimeter (Minolta, model CR-10, Japan). Sample color was evaluated in triplicate according to the method of Maisont et al.12 The colorimeter measured the color parameters of the sample in CIE chromaticity coordinates. Regarding lightness (L*) on a scale of 0-100 (0 black and 100 white), redness (a*) in which positive values indicate undertone red and negative values indicate undertone green, and yellowness (b*) in which positive values indicate undertone yellow and negative values indicate undertone blue. The colorimeter was calibrated using a standard white porcelain plate (CIE Standard Illuminant D65).
Expansion measurement
The thickness of 5 points was measured using a cross mark, and the center of each slice of tapioca crispy crackers before and after frying was measured with a Vernier caliper (Mitutoyo Vernier Caliper 530 Series, Japan) and replicated three times according to the method of Maisont et al.12 The expansion of the puffed tapioca crispy crackers was calculated as a percentage of the difference in the average value of thickness before and after frying, compared to the average value of thickness before frying.

Textural measurement
The textural property of tapioca crispy crackers was measured in terms of hardness and fracturability using a TA.XT plus texture analyzer (Stable Micro Systems, Surrey, UK). A 35 mm cylindrical probe for a compression test was used. Texture analysis of the fairy mushroom tapioca crispy crackers was conducted by measuring the compression force (g) up to a 3 mm distance, with pre-test, test, and post-test speeds set at 1 mm/s, and a trigger force of 5 g. The peak value of the fracture force (maximum), at the point when the tapioca crispy crackers would break into two major pieces, was recorded as the hardness. The force at the first peak is taken as the fracturability for each sample. The textural property evolution was assessed on ten pieces of tapioca crispy crackers equilibrated to 25 ºC for each trial. The Texture Expert program version 6.1.1.0 was used for data analysis.
Sensory evaluation
Sensory evaluation of the tapioca crispy crackers was performed with 30 panelists in a sensory laboratory with a separate booth design according to the method adapted from Maisont et al.12 The sensory panel consisted of undergraduate students (19–21 years old) from the 2nd and 3rd years of the Food Science and Technology Program, Phranakhon Rajabhat University. The panel included 5 males and 25 females. The study protocol was reviewed and approved by the Evaluation Committee of the Faculty of Science and Technology, Phranakhon Rajabhat University, Thailand. Before participation, informed consent was obtained from all panelists in accordance with ethical standards currently applied in Thailand, and their privacy rights were strictly observed. To ensure participant safety, allergy screening was carried out before sample distribution, and only individuals without mushroom or food allergies were enrolled. Five samples were each placed on white polystyrene plates labeled with three-digit random numbers and served to panelists in a randomized order. Between each sensory test, panelists were given water to rinse their palate to reduce sensory fatigue. Panelists evaluated the samples for appearance, color, odor, hardness, crispiness, taste, and overall liking using a 7-point hedonic scale, where score 1 represented extreme dislike and 7 represented the opposite extremely like.
Proximate analysis
The proximate composition of the selected tapioca crispy cracker as the final product, including moisture, ash, protein, fat, crude fiber, and carbohydrate, was determined according to the methods established by AOAC(2025).10 The moisture content was determined using oven drying at 105 ºC up to constant weight. The ash content was determined in a muffle furnace at 550 ºC until a white or light grey ash was obtained. The protein content was analyzed using the Kjeldahl technique, applying a nitrogen-to-protein conversion factor of 6.25. Fat content was measured through manual Soxhlet extraction. Crude fiber was assessed by igniting the dried residue left after sample digestion, with the fiber amount determined by the change in weight. Carbohydrates were estimated by subtracting the total of other measured components. All results were expressed as grams per 100 g of dry matter.
![]()
Shelf-Life Study
Analysis of the shelf life of the chosen tapioca crispy cracker sample in triplicate was carried out. Three replications of tapioca crispy crackers were analyzed at weekly intervals for 4 weeks. The samples were sealed in laminated aluminum foil pouches and kept at ambient conditions, 30±2 ºC. Therefore, various attributes related to texture and oxidative stability—such as moisture content, water activity (aw), textural characteristics, peroxide value, and TBARS value—were evaluated. The peroxide value indicates the presence of peroxides, primarily hydroperoxides, as initial products of lipid oxidation. TBARS (thiobarbituric acid reactive substances) analysis quantifies secondary oxidation products like carbonyl compounds, which can influence sensory quality. This test involves the reaction of malondialdehyde (MDA) with thiobarbituric acid, forming a pink complex measurable by spectrophotometry at wavelengths between 532 and 535 nm, according to the method of Maisont et al.12 A linear regression curve of the standard of 1,1,3,3-tetraethoxypropane (TEP) versus the relative light unit for each standard was plotted. The TBARS, as the milligrams of MDA per 1 kg sample, was calculated using the relative light unit obtained from the sample and the equation generated by the standard curve.
Statistical analysis
Tapioca crispy crackers were prepared in triplicate batches; mean values and standard deviations were calculated, and all results were expressed as mean ± SD. Analysis of variance (one-way ANOVA) was carried out using SPSS (IBM SPSS Statistics version 16). Duncan’s new multiple range test was used to find out the statistically significant differences in mean values between treatments at the level of P ≤ 0.05.
Research Ethics Certification
This study was reviewed and approved by the Ethics Evaluation Committee of Phranakhon Rajabhat University, under approval number 01.058/65.
Characteristics of the uncooked tapioca crispy crackers
Fairy mushrooms partially replaced tapioca flour contents in the dough process at contents of 0, 100, 150, 200, and 250 (g) of total tapioca flour to produce uncooked tapioca crispy crackers. The results of the measurements of moisture content, water activity, and color of uncooked tapioca crispy crackers are given in Tables 2 and 3. Incorporating fairy mushrooms led to an increase in the moisture content of uncooked tapioca crispy crackers, rising from 8.33% to 8.79%. The aw of the uncooked tapioca crispy crackers was 0.60-0.63.
Table 2: Moisture content and aw of uncooked tapioca crispy crackers
|
Fairy mushroom (g) |
Moisture content
(%) |
aw |
| 0 | 8.33a ± 0.07 |
0.60c ± 0.003 |
|
100 |
8.37a ± 0.21 | 0.62b ± 0.002 |
| 150 | 8.48a ± 0.54 |
0.63a ± 0.004 |
|
200 |
8.54a ± 0.21 | 0.63a ± 0.002 |
| 250 | 8.79a ± 0.12 |
0.63a ± 0.008 |
Tapioca flour was substituted with ground fairy mushroom at levels of 0 g (0%), 100 g (20%), 150 g (30%), 200 g (40%), and 250 g (50%) of the total tapioca flour.
Mean ± standard deviation values in the same column for each sample followed by different superscript letters are significantly different (p ≤ 0.05).
Table 3: Color of uncooked tapioca crispy crackers
|
Fairy mushroom (g) |
L* | a* | b* |
| 0 | 50.16a ± 0.11 | 8.73d ± 0.15 |
24.06a ± 0.05 |
|
100 |
47.76b ± 0.23 | 9.33c ± 0.23 | 23.36b ± 0.11 |
| 150 | 45.16c ± 0.15 | 9.34c ± 0.05 |
21.36c ± 0.11 |
|
200 |
44.36d ± 0.11 | 10.60b ± 0.10 | 20.13d ± 0.15 |
| 250 | 39.26e ± 0.11 | 11.20a ± 0.26 |
17.06e ± 0.05 |
Tapioca flour was substituted with ground fairy mushroom at levels of 0 g (0%), 100 g (20%), 150 g (30%), 200 g (40%), and 250 g (50%) of the total tapioca flour.
Mean ± standard deviation values in the same column for each sample followed by different superscript letters are significantly different (p ≤ 0.05).
Physicochemical characteristics of tapioca crispy crackers
Moisture content and aw of tapioca crispy crackers
The moisture content and the water activity (aw) of cooked crispy crackers with different percentages of mushroom substitution for tapioca flour are shown in Table 4. The moisture content and aw ranged from 4.13-4.74% and 0.32-0.35.
Table 4: Moisture content and aw of cooked crispy crackers
|
Fairy mushroom content (g) |
Moisture content
(%) |
aw |
| 0 | 4.13b ± 0.13 |
0.32c ± 0.002 |
|
100 |
4.68a ± 0.24 | 0.33b ± 0.006 |
| 150 | 4.69a ± 0.06 |
0.34b ± 0.005 |
|
200 |
4.72a ± 0.05 | 0.35a ± 0.003 |
| 250 | 4.74a ± 0.13 |
0.35a ± 0.002 |
Tapioca flour was substituted with ground fairy mushroom at levels of 0 g (0%), 100 g (20%), 150 g (30%), 200 g (40%), and 250 g (50%) of the total tapioca flour.
Mean ± standard deviation values in the same column for each sample followed by different superscript letters are significantly different (p ≤ 0.05).
Color of cooked tapioca crispy crackers
The color measurement L*, a*, and b* values of tapioca crispy crackers are shown in Table 5. The L* value of tapioca crispy crackers samples substituted tapioca flour with ground fairy mushrooms of 0, 100, 150, 200, and 250 (g) were 53.40, 51.73, 48.63, 44.40, and 40.80, respectively, and it was significantly decreased (p ≤ 0.05) when fairy mushrooms were increased. The a* value of cooked tapioca crispy crackers samples substituted tapioca flour with ground fairy mushrooms of 0, 100, 150, 200, and 250 (g) were 4.86, 6.53, 6.83, 7.70, and 10.70, respectively, and it was significantly decreased (p ≤ 0.05) when fairy mushroom contents were increased (Table 5). While the b* value tapioca crispy crackers samples substituted tapioca flour with ground fairy mushrooms of 0, 100, 150, 200, and 250 (g) were 18.16, 17.36, 16.66, 16.56, and 15.76, respectively, and it was significantly increased (p ≤ 0.05) when fairy mushroom contents were increased.
Table 5: Color of cooked tapioca crispy crackers
|
Fairy mushroom content (g) |
L* | a* | b* |
| 0 | 53.40a ± 0.34 | 4.86e ± 0.05 |
18.16a ± 0.15 |
|
100 |
51.73b ± 0.20 | 6.53d ± 0.37 | 17.36b ± 0.30 |
| 150 | 48.63c ± 0.28 | 6.83c ± 0.05 |
16.66c ± 0.15 |
|
200 |
44.40d ± 0.43 | 7.70b ± 0.10 | 16.56c ± 0.30 |
| 250 | 40.80e ± 0.10 | 10.70a ± 0.10 |
15.76d ± 0.15 |
Tapioca flour was substituted with ground fairy mushroom at levels of 0 g (0%), 100 g (20%), 150 g (30%), 200 g (40%), and 250 g (50%) of the total tapioca flour.
Mean ± standard deviation values in the same column for each sample followed by different superscript letters are significantly different (p ≤ 0.05).
Expansion and textural characteristics of cooked tapioca crispy crackers
The expansion ratio, hardness, and tractability of tapioca crispy crackers samples substituted tapioca flour with ground fairy mushrooms of 0, 100, 150, 200, and 250 (g) were shown in Table 6. From Table 6, the expansion ranged from 129.08-133.00, and textural characteristics, hardness, and factorability of tapioca crispy crackers ranged from 356.89-576.14 g and 17.14-30.69 g, respectively. Expansion drops similarly for all mushroom levels (129-133%, Table 6), but hardness varies widely (356-576 g).
Table 6: Expansion ratio, hardness, and fracturability of cooked tapioca crispy crackers
|
Fairy mushroom content (g) |
Expansion ratio | Characteristics | |
| Hardness (g) | Fracturability (g) | ||
| 0 | 133.00a ± 0.54 | 356.89c ± 25.65 |
17.14d ± 1.63 |
|
100 |
129.48b ± 1.20 | 457.40b ± 31.55 | 23.85c ± 1.15 |
| 150 | 129.40b ± 1.48 | 460.63b ± 26.41 |
26.47b ± 1.19 |
|
200 |
129.23b ± 0.86 | 550.07a ± 11.36 | 28.35b ± 1.11 |
| 250 | 129.08b ± 1.45 | 576.14a ± 9.33 |
30.69a ± 0.74 |
Tapioca flour was substituted with ground fairy mushroom at levels of 0 g (0%), 100 g (20%), 150 g (30%), 200 g (40%), and 250 g (50%) of the total tapioca flour.
Mean ± standard deviation values in the same column for each sample followed by different superscript letters are significantly different (p ≤ 0.05).
Sensory analysis results
The sensory attributes in terms of appearance, color, flavor, taste, crispiness, and overall acceptability for tapioca crispy crackers are presented in Figure 1. Tapioca flour was substituted with ground fairy mushroom at levels of 0 g (0%), 100 g (20%), 150 g (30%), 200 g (40%), and 250 g (50%) of the total tapioca flour. The results showed that there were significant differences (p ≤ 0.05) in the appearance, color, flavor, taste, crispiness, and overall acceptability of the tapioca crispy crackers samples. The highest scores in appearance, color, flavor, taste, crispiness, and overall acceptability were found in tapioca crispy crackers where tapioca flour was substituted with fairy mushrooms at a content of 250 g.
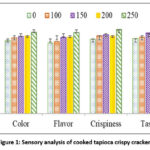 |
Figure 1: Sensory analysis of cooked tapioca crispy crackers |
Characteristics of the final product
Proximate composition
Tapioca crispy crackers samples with fairy mushrooms substituted for 250 g were analyzed for proximate composition according to the AOAC(2025) method.10 The results of the measurements of moisture, protein, fat, fiber, ash, and carbohydrate content in the final tapioca crispy crackers product were 4.74±0.13, 2.39±0.11, 23.31±0.07, 0.24±0.13, 2.49±0.01, and 67.06±0.09, respectively (Table 7).
Table 7: Chemical composition of the final product
|
Compositions |
Content (%) |
| Moisture |
4.74 ± 0.13 |
|
Protein |
2.39 ± 0.11 |
| Fat |
23.31 ± 0.07 |
|
Crude fiber |
0.24 ± 0.01 |
| Ash |
2.49 ± 0.06 |
|
Carbohydrate |
67.06 ± 0.09 |
Shelf-Life
Analysis of the shelf life of tapioca crispy crackers, with 250 g of fairy mushrooms substituted, was conducted weekly over four weeks. The samples were packed in thick polypropylene plastic bags and stored at a room temperature of 30±2 ºC. The shelf-life studies on physicochemical characteristics were carried out on tapioca crispy crackers during storage, and the color results are given in Table 8. The color measurement L*, a*, and b* values of the tapioca crispy crackers with fairy mushrooms substituted 250 g are shown in Table 8. The L* value of the tapioca crispy crackers significantly increased (p ≤ 0.05) when storage time increased. In contrast, the a* and b* values significantly decreased (p ≤ 0.05) with increased storage times.
Table 8: Color of tapioca crispy crackers during storage
|
Weeks |
L* | a* |
b* |
|
0 |
40.76e ± 0.11 | 7.06a ± 0.05 | 16.36ab ± 0.51 |
| 1 | 41.53c ± 0.15 | 6.90ab ± 0.26 |
16.46a ± 0.15 |
|
2 |
41.20d ± 0.10 | 7.00ab ± 0.20 | 16.16ab ± 0.23 |
| 3 | 41.80b ± 0.17 | 6.90ab ± 0.10 |
15.90b ± 0.10 |
|
4 |
42.48a ± 0.50 | 6.73b ± 0.11 |
15.86b ± 0.11 |
Mean ± standard deviation values in the same column for each sample followed by different superscript letters are significantly different (p ≤ 0.05).
The hardness analysis of the tapioca crispy crackers with fairy mushrooms substituted 250 g was showed in Figure 2[a]. It was observed that the product’s hardness decreased with an increase in storage period. The hardness of the product at the start of storage (0th week) was 580.32 g. Following four weeks of storage, the hardness of the crispy crackers decreased to 414.24 g. The crispiness of the tapioca crispy crackers with fairy mushrooms substituted 250 g was evaluated from the fracturability value, showing that as time passes, the product loses its crispiness Figure 2[b]. The fracturability of the product during the first week of storage was 45.44 g. However, after being stored for four weeks, the fracturability decreased to 24.82 g.
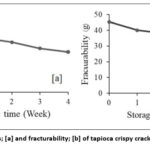 |
Figure 2: Hardness; [a] and fracturability; [b] of tapioca crispy crackers during storage |
Figure 3[a] and 3[b] show that the moisture content and the water activity in the tapioca crispy crackers with fairy mushrooms substituted 250 g, increased with increasing storage time. During the first two weeks, an increase in water activity was observed, ranging from 0.33 to 0.40. During the second to fourth weeks, the water activity of these samples showed no significant change, remaining in the range of 0.40 to 0.43.
The results of the measurement of peroxide value are shown in Figure 3[c]. It was found that the peroxide value during storage of the fairy mushroom tapioca crispy cracker was presented with an initial value of 0.05 g/100g sample, the peroxide value sharply increased after three weeks of storage to 0.07, 0.09, and 0.11 g/100g sample, and the peroxide value was 0.12 g/100g sample for four weeks of storage.
In addition, the Thiobarbituric acid reactive substances (TBARS) of tapioca crispy crackers with fairy mushrooms substituted 250 g were also measured. The results of the measurement of TBARS values (expressed as absolute OD) are given in Figure 3[d]. During storage at 30 ºC, the increase in TBARS values of the fairy mushroom tapioca crispy crackers is presented with an initial value of 1.92 g/100g sample. The TBARS values increased to 2.32, 2.70, 3.27, and 3.92 g/100g sample after four weeks of storage.
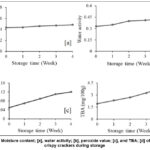 |
Figure 3: Moisture content; [a], water activity; [b], peroxide value; [c], and TBA; [d] of tapioca crispy crackers during storage |
Figure 4 presents the sensory analysis of the tapioca crispy crackers with fairy mushrooms substituted for 250 g during storage. It was carried out with one sample at each storage time across five separate evaluation sessions. As the storage time increased, the panelists’ liking scores of all attributes tended to decrease. Although their scores for appearance, color, rancidity, crispness, taste, and overall likability decreased, the panellists were still able to accept the tapioca crispy cracker.
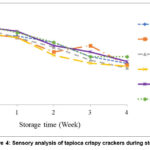 |
Figure 4: Sensory analysis of tapioca crispy crackers during storage |
Discussion
Characteristics of the uncooked tapioca crispy crackers
According to Table 2, it was found that the moisture and aw of the uncooked tapioca crispy crackers increased with an increase in fairy mushrooms. The increase in moisture content and water activity of the uncooked tapioca crispy crackers with higher levels of fairy mushroom incorporation may be attributed to the residual moisture present in the steamed ground mushroom. According to Finimundy et al.,1 although the mushrooms were squeezed to remove excess water after steaming, some moisture remained within the mushroom tissue due to its porous and fibrous structure, contributing to the higher moisture and aw values in the formulated crackers. The color characteristics of uncooked tapioca crispy crackers are presented in Table 3. The L* and a* values of the uncooked tapioca crispy crackers sample y increased (p ≤ 0.05), whereas the b* value decreased with the addition of fairy mushrooms to the tapioca crispy crackers recipe.
Physicochemical characteristics of tapioca crispy crackers
Moisture content and aw of tapioca crispy crackers
The moisture content and aw of tapioca crispy crackers were lower than 10.0% for moisture and less than 0.6 for aw, indicating it is very dry, a factor that inhibits microbial growth and suggests it is shelf-stable, as reported by Mathlouthi,13 which is consistent with the experimental results found by Pichaiyongvongdee et al.,14 in calcium-fortified vegetable crispy waffles with riceberry. Uncooked samples show significant differences (0.60 – 0.63, Table 2), but post-frying aw is similar (0.32 – 0.35, Table 4). Attribute this to the dehydrating effect of frying, but note that mushroom-rich samples retain slightly higher aw. Moisture content and aw of the tapioca crispy crackers, formulated by partially replacing tapioca flour with fairy mushrooms at 0, 100, 150, 200, and 250 g levels, significantly increased with higher levels of mushroom substitution (p ≤ 0.05). Nevertheless, microbial growth was effectively controlled, as described by Larrauri.15 The moisture content increases with the amount of fairy mushrooms due to the water-retaining properties of proteins in the mushroom. Therefore, an increase in ground fairy mushrooms results in higher moisture levels. This is because the increased moisture content in the tapioca crisp crackers causes the aw of the tapioca crisp crackers to increase accordingly.
Color of cooked tapioca crispy crackers
Color is an important quality attribute of fried food. The findings of Othman,16 who reported that the ideal color for fried food is light golden brown, which is due to the browning reaction during frying. The L* value of tapioca crispy crackers samples substituted tapioca flour with ground fairy mushrooms was significantly decreased (p ≤ 0.05) when fairy mushrooms were increased. The crispy crackers were darker. This might be because the use of more fairy mushrooms decreased the expansion rate of the fairy mushroom tapioca crispy crackers. A higher expansion rate produces a more porous, aerated structure with larger air pockets. These air pockets scatter light more effectively, making the cracker appear brighter (higher L*).12 This decrease in the expansion rate of the tapioca crispy crackers affected the brightness value, causing it to decrease as well.
The a* value of cooked tapioca crispy crackers samples substituted tapioca flour with ground fairy mushrooms was significantly decreased (p ≤ 0.05) when fairy mushroom contents were increased (Table 5). While the b* value tapioca crispy crackers samples substituted tapioca flour with ground fairy mushrooms was significantly increased (p ≤ 0.05) when fairy mushroom contents were increased. This was due to the color of ground fairy mushrooms being brown; thus, when brown mushrooms are added and the amount of flour is reduced, the tapioca crispy crackers turn to a dark brownish and lower yellow color compared to the control tapioca crispy crackers. The brown color can be caused by the Maillard reaction and the degradation of heat-sensitive pigments, which occurs between amino acids in the mushrooms and sugars in the flour during high-heat cooking, as reported by Jiapong and Ruttarattanamongkol.17 Furthermore, the samples underwent milling and were then analyzed for color using the Hunter Lab colorimeter. It is important to note that the color of the milled material may differ from that of the surface due to the exposure of the inner material. Also, the study of Sarawong et al.,18 who reported that substituted wheat flour with whole leaf and chloroplast-rich rice grass caused cookies to become darker (lower L*) and greener (higher a-negative) due to chlorophyll content. Darkening of the product’s color when plant-based materials are added, likely due to natural pigments and Maillard reaction effects during heating. It was reported by Ayustaningwarno et al.,19 that the homogenization process involves mixing the light and dark color areas, as well as blending the surface material with the internal tissue and oil in vacuum-fried fruits.
Expansion and textural characteristics of cooked tapioca crispy crackers
The textural properties in fried products result from chemical changes in the frying process. An indicator of crispiness was determined by measuring the force required to break the fried tapioca crispy cracker samples, where a lower breaking force reflects higher crispiness, as described by Su et al.20 From Table 6, expansion drops similarly for all mushroom levels (129-133%, Table 6), but hardness varies widely (356-576 g). At 250 g, protein may dominate over starch, limiting expansion but increasing hardness. It was observed that the addition of fairy mushrooms to the tapioca flour reduced starch content in the mixture, causing poor water absorption and producing smaller and less crispy tapioca samples. This was due to the interaction between the substituted fairy mushroom and the starch granules, which inhibited expansion. More mushrooms substituted for tapioca flour, less protein content, thus less water absorption. The results of this study are consistent with those of Mathlouthi13 and Faridah et al.,21 confirming starch granules require water absorption and gelatinization to create air cells that contribute to the product’s expansion. The results are in good agreement with the findings of Prapasuwannakul et al.22 The functional properties of flour are important in the production of snack products. Mushrooms have a higher bulk density value, meaning they take up less space per unit weight. However, Mihiranie et al.23 documented that flour is lighter and easier to transport; thus, flour occupies more space due to its lower bulk density. The amount of amylopectin in the flour affects the expansion, with higher amounts resulting in better expansion and less hardness. In this experiment, as shown in Table 6, the reduced degree of expansion led to fewer air cells forming, increasing the hardness. High porosity, or the presence of a lot of air, can decrease hardness, as described by Kumar et al.24 Moreover, incorporating fairy mushrooms in tapioca dough improved the fiber content (Table 6), influencing the dough’s rheological characteristics and, consequently, contributing to the high hardness and fracturability of the sample, which is consistent with the experimental results found by Mouminah and Althaiban.25 The studies show that fiber- or protein-rich ingredients can alter the texture negatively or positively, depending on the target product.18,25 Higher hardness may be acceptable or desirable, as in tapioca crispy crackers. Similar data was obtained by Matidza et al.,26 whereby the incorporation of unripe banana flour increased the hardness of the wheat final product. However, findings are limited to lab-scale batches; commercial frying may alter texture.
Sensory analysis
Crispiness is a crucial sensory quality that determines the acceptability of snack products for consumers. Using fairy mushroom content can affect the crispiness of the product in different ways (Figure1). Among all formulations, the 250 g substitution level provided the most favorable balance of sensory and physicochemical attributes. Although higher mushroom content reduced expansion and increased hardness, panelists preferred the 250 g sample for its umami flavor and crispiness, giving it the highest overall liking scores. This formulation was therefore selected as the final product for further analysis.
Characteristics of the final product
Proximate composition
Tapioca crispy crackers samples with fairy mushrooms substituted for 250 g were analyzed for moisture content (Standard oven dry method), protein content (Kjeldahl method), fat content (Soxhlet method), fiber content (Weende method), ash, and carbohydrate contents according to the AOAC method.10 The 250 g substitution was selected because it balanced sensory appeal and physicochemical properties; higher mushroom levels reduced expansion and brightness, but 250 g maintained crispiness, umami flavor, and overall acceptability. Protein only increased to 2.39% (Table 7) negligible compared to the daily requirements (~50 g/day) for the Thai recommendation.
Shelf-Life
The color measurement L*, a*, and b* values of the tapioca crispy crackers with fairy mushrooms substituted 250 g are shown in Table 8. The L* value of the tapioca crispy crackers significantly increased (p ≤ 0.05) when storage time increased. In contrast, the a* and b* values significantly decreased (p ≤ 0.05) with increased storage times, indicating the stored samples became brighter, redder, and less yellow compared to the fresh tapioca crispy crackers sample. Thus, the product color was brown with a brighter. The lowest percentage decrement in L* value is desirable because the product will undergo a frying process in which the browning reaction will occur and cause the product to become darker. The b* values of the samples increased gradually with storage time. These results align with those reported by Othman et al.,16 who studied the effects of different batter coating formulations composed of wheat flour, rice flour, corn flour, crispy flour, and spicy flour on the production of crispy chicken burger patties.
According to the hardness analysis of the tapioca crispy crackers with fairy mushrooms substituted 250 g from Figure 2[a], it was observed that the product’s hardness decreased with an increase in storage period. This softening corresponded with an increase in moisture content over time (Figure 3[a]). This behavior has also been documented by Morais et al.27 The changes undergone by food hardness are directly linked to structural changes undergone during its storage. All samples were kept in the same condition in thick polypropylene plastic bags. Water, due to its plasticizing effect, is one of the main elements responsible for these changes; thus, increasing moisture resulted in a consequent reduction of the cracker hardness. It may be due to the crackers absorbing moisture from the atmosphere, which usually leads to the softening of the crackers, and the speed of moisture pick-up is related to the ambient conditions, as reported by Romeo et al.28
The force required to break the crispy tapioca crackers was used as an indicator of crispiness, where a lower breaking force signifies higher crispiness as can be observed from Figure 2[b], the crispiness of the tapioca crispy crackers with fairy mushrooms substituted 250 g, as evaluated from the fracturability of the tapioca crispy crackers, showed that as time passes, the product loses its crispiness.
The moisture content in the tapioca crispy crackers with fairy mushrooms substituted 250 g, increased with increasing storage time (Figure 3[a]). This result was correlated with Romeo et al.28 This phenomenon was probably due to water migration from the environment, documented by Chowdhury et al.29 These findings demonstrate that variations in storage conditions lead to differences in moisture content. The low moisture content of the products is important for prolonging their shelf life. However, in this study, the moisture content in tapioca crispy crackers must not exceed 12% by weight under the regulation of Thai Community Products Standards 107/2554: Crispy Snack.30
From Figure 3[b], the aw in the tapioca crispy crackers with fairy mushrooms substituted 250 g, increased with increasing storage time. The results follow the moisture results in Figure 3[a]. Romeo et al.28 observed that the decrease in aw was correlated to the moisture content in cookies, and this decrease was less at 30 ºC compared to cookies at 20 ºC. During the first two weeks, an increase in aw was observed. During the second to fourth weeks, the aw of these samples showed no significant change. Considering typical household storage conditions for crispy crackers, the samples were stored in thick polypropylene plastic bags under the same conditions. However, it was found that this type of packaging allows both gas and water vapor to permeate, which can negatively affect product quality. If there is too much moisture in the food, it can lead to spoilage and cause changes in chemical reactions catalyzed by enzymes. This can result in the growth of microorganisms, which is the main cause of food spoilage. However, it has been observed that the aw of fairy mushroom tapioca crispy crackers is below 0.5, meaning no microorganism can grow on it, as documented by Mathlouthi.13
It was found that the peroxide values of fairy mushroom tapioca crispy crackers during storage at temperatures of 30 ºC increased as the storage time increased (Figure 3[c]). The increase in peroxide values during storage of the fairy mushroom tapioca crispy crackers is presented, then sharply increased after three weeks of storage.
In addition, during storage at 30 ºC, TBARS values of fairy mushroom tapioca crispy crackers tended to increase as the storage time increased (Figure 3[d]). Raiyan et al.31 got TBARS values for seaweed-formulated crackers in initial storage time, 1.12 – 1.85 mg/kg sample, similar to this study. This implies that as storage time increases, there is a greater formation and development of secondary oxidation products. Bunkar et al.32 found that the TBARS value of instant Kheer mix powder also increased during storage and that this increase was dependent on temperature.
Fat is the second largest ingredient in snacks, and the presence of free fatty acids indicates lipase activity or other hydrolytic actions. This can lead to the development of rancidity, resulting in an unpleasant taste and odor during storage. Currently, an oversupply of mushrooms in the market has led to a decline in prices.19 Based on the sensory quality assessment of the tapioca crispy crackers with fairy mushrooms substituted 250 g, it was found that as the storage time increased, the panelists’ liking scores tended to decrease (Figure 4). Although their scores for appearance, color, rancidity, crispness, taste, and overall likability decreased, the panellists were still able to accept the tapioca crispy crackers in the 4th week of storage. Therefore, fairy mushroom tapioca crispy crackers can be stored for more than four weeks in thick polypropylene bags at a room temperature of 30 ºC. However, though chemically stable, sensory scores dropped by 20% after 4 weeks, suggesting a 3-week shelf life for premium quality.
Conclusion
The tapioca flour was substituted with fairy mushrooms to produce the tapioca crispy crackers. The color and texture of tapioca crispy crackers were influenced by the addition of fairy mushrooms as a raw material. Crackers formulated with fairy mushrooms exhibited a darker color, increased hardness, and greater fracturability compared to those without mushroom substitution. These results indicate that the inclusion of fairy mushrooms affected both the physical and sensory properties of the product. The texture of tapioca crispy crackers is a key quality attribute influenced by the addition of fairy mushrooms. While hardness increased by 61%, expansion dropped by 3% – a key consideration for industrial production. Among the formulations, the sample containing 250 g of fairy mushrooms received the highest sensory acceptance scores and was selected as the final product. The quality of the selected fairy mushroom–fortified crackers is affected by storage duration; however, they maintained acceptable physical and antioxidant properties for up to four weeks when stored at 30 ºC. Based on these findings, fairy mushroom tapioca crispy crackers show potential as a high-quality snack formulated for higher protein content. Since the product is fried, alternative packaging methods, such as vacuum sealing or nitrogen flushing, could be investigated for further study to enhance the shelf stability of tapioca crispy crackers with fairy mushroom. Evaluating different storage conditions in combination with these packaging approaches could further extend product quality and consumer acceptability.
Acknowledgement
The authors would like to thank Phranakhon Rajabhat University for its financial support in this research work.
Funding Sources
This was financially supported by Phranakhon Rajabhat University with a grant number of 02.004/2565.
Conflict of Interest
The authors do not have any conflicts of interest.
Data Availability Statement
This statement does not apply to this article.
Ethics Statement
The Ethics Evaluation Committee of the Faculty of Science and Technology, Phranakhon Rajabhat University, Thailand, under approval number 01.058/65.
Informed Consent Statement
Informed consent was obtained for the experimentation, ensuring compliance with the standards currently applied in Thailand. The privacy rights of human subjects were always observed.
Clinical Trial Registration
This research does not involve any clinical trials.
Permission to Reproduce Material from Other Sources
Not Applicable
Author Contributions
- Kanitta Oumaree – Conceptualization, Funding Acquisition, Methodology, Data Collection, Analysis, Writing – Review.
- Wisutthana Samutsri – Ethics submission, Analysis, Visualization, Writing – Original Draft & Editing.
- Sujittra Thimthuad – Methodology and Data Collection.
References
- Finimundy TC, Barros L, Calhelha RC, et al. Multifunctions of Pleurotus sajor-caju (Fr.) Singer: A highly nutritious food and a source for bioactive compounds. Food Chem. 2018;245:150–158. doi:10.1016/j.foodchem.2017.10.088.
CrossRef - Panjikkaran ST, Mathew D. An environmentally friendly and cost-effective technique for the commercial cultivation of oyster mushroom [Pleurotus florida (Mont.) Singer]. J Sci Food Agric. 2013;93(4):973–976.
CrossRef - Wan-Mohtar WAAQI, Mahmud N, Supramani S, Ahmad R, Zain NAM, Hassan N. Fruiting-body-base flour from an oyster mushroom—a waste source of antioxidative flour for developing potential functional cookies and steamed-bun. AIMS Agric Food. 2018;3(4):481–492. doi:10.3934/agrfood.2018.4.481.
CrossRef - Grand View Research Inc. Healthy Snacks Market Size, Share & Trends Analysis Report By Product (Frozen & Refrigerated, Dairy), By Claim (Gluten-free, Low/No Fat), By Packaging, By Distribution Channel, By Region, And Segment Forecasts, 2023–2030. 2022. Available from: https://www.grandviewresearch.com/industry-analysis/healthy-snack-market
- Food Intelligence Center. Food Market Share in Thailand. 2022. Available from: https://www.nfi.or.th/datas/files/ News/Issue-July-10%20top%20trend1.pdf
- Lusas EW, Rooney LW. Snack Foods Processing. Pennsylvania, USA: Technomic Publishing Company, Inc.; 2001. doi:10.1201/9780367800871.
CrossRef - Cankal YS, Berk B, Koroglu E, et al. Influence of tapioca, corn, and potato starches on physical and textural characteristics of puffed starch crackers. Akademik Gıda. 2025;23(2):80–90. doi:10.24323/akademik-gida.1746576.
CrossRef - Charoen R, Lakerd S, Kornpetch C. Development of seasoned gray oyster mushroom chips using vacuum frying process. Food Appl Biosci J. 2015;3(2):100–108.
- Panyoyai N, Sanjai S, Mungkan P. Study on preparation and quality of tomato crispy crackers. Thai J Agric Sci. 2011;44(5):513–518.
- AOAC International. Official Methods of Analysis of AOAC International. 18th ed. Gaithersburg, USA: AOAC International; 2005. Available from: https://www.researchgate.net/publication/292783651_AOAC_2005
- Maisont S, Samutsri W, Sansomboon A, Limsuwan P. Drying edible jellyfish (Lobonema smithii) using a parabolic greenhouse solar dryer. Food Res. 2022;6(6):165–173. doi:10.26656/fr.2017.6(6).883.
CrossRef - Maisont S, Samutsri W, Phae-Ngam W, Limsuwan P. Development and characterization of crackers substitution of wheat flour with jellyfish. Front Nutr. 2021;8:772220. doi:10.3389/fnut.2021.772220.
CrossRef - Mathlouthi M. Water content, water activity, water structure and the stability of foodstuffs. Food Control. 2001;12(7):409–417. doi:10.1016/S0956-7135(01)00032-9.
CrossRef - Pichaiyongvongdee S, Rattanapun B, Youdee P, et al. Pre-treatment of vegetables and formula development of calcium-fortified vegetable crispy waffles with riceberry using a mixture design. J Microbiol Biotechnol Food Sci. 2023;13(2):1–7. doi:10.55251/jmbfs.9825.
CrossRef - Larrauri JA. New approaches in the preparation of high dietary fibre powders from fruit by-products. Trends Food Sci Technol. 1999;10(1):3–8. doi:10.1016/S0924-2244(99)00016-3.
CrossRef - Othman SH, Rosli NM, Nordin N, Aziz MA. Formulation of crispy chicken burger patty batter: Properties and storage qualities. AIMS Agric Food. 2022;7(2):426–443. doi:10.3934/agrfood.2022027.
CrossRef - Jiapong S, Ruttarattanamongkol K. Development of direct expanded high protein snack products fortified with Sacha Inchi seed meal. J Microbiol Biotechnol Food Sci. 2021;10(4):680–684.
CrossRef - Sarawong C, Norajit K, Wongtom R, et al. Effect of partial replacement of wheat flour with whole leaf and chloroplast-rich fraction from Thai jasmine rice grass on nutritional and physicochemical properties of cookies. Curr Res Nutr Food Sci. 2024;12(1):212–224.
CrossRef - Ayustaningwarno F, Fogliano V, Verkerk R, Dekker M. Surface color distribution analysis by computer vision compared to sensory testing: vacuum fried fruits as a case study. Food Res Int. 2021;143:110230. doi:10.1016/j.foodres.2021.110230.
CrossRef - Su Y, Gao J, Chen Y, et al. Evaluation of the infrared frying on the physicochemical properties of fried apple slices and the deterioration of oil. Food Chem. 2022;379:132110. doi:10.1016/j.foodchem.2022.132110.
CrossRef - Faridah Y, Noor Nadzirah MY, Chan KC. Effect of varying ratios of oyster mushroom powder to tapioca flour on the physicochemical properties and sensory acceptability of fried mushroom crackers. Malays Appl Biol. 2017;46(1):57–62.
- Prapasuwannakul N. Consumer acceptance of nutritional enrichment of fish crackers used for snacks with fish bones. Adv Phys Ergon Hum Factors. 2018;789:242–250. doi:10.1007/978-3-319-94484-5_26.
CrossRef - Mihiranie S, Jayasundera M, Perera N. Development of snack crackers incorporated with defatted coconut flour. J Microbiol Biotechnol Food Sci. 2017;7(2):153–159. doi:10.15414/jmbfs.2017.7.2.153-159.
CrossRef - Kumar S, Chandra A, Nema PK, et al. Optimization of the frying process in relation to quality characteristics of Khaja (a traditional sweet). J Food Sci Technol. 2022;59(11):4352–4361. doi:10.1007/s13197-022-05509-x.
CrossRef - Mouminah HH, Althaiban MA. Production and evaluation of gluten-free cookies for celiac patients made from rice flour and green banana flour. Curr Res Nutr Food Sci. 2025;13(2). Available from: https://www.foodandnutritionjournal.org/production-and-evaluation-of-gluten-free-cookies
CrossRef - Matidza M, Kgatla TE, Mashau ME. Leavening capacity, physicochemical and textural properties of wheat dough enriched with non-commercial unripe banana flours. AIMS Agric Food. 2023;8(4):978–994. doi:10.3934/agrfood.2023052.
CrossRef - Morais MP, Caliari M, Nabeshima EH, et al. Storage stability of sweet biscuit elaborated with recovered potato starch from effluent of fries industry. J Food Sci Technol. 2004;38(2):216–222. doi:10.1590/fst.32916.
CrossRef - Romeo FV, De Luca S, Piscopo A, Santisi V, Poiana M. Shelf-life of almond pastry cookies with different types of packaging and levels of temperature. Food Sci Technol Int. 2010;16(3):233–238. doi:10.1177/1082013209353836.
CrossRef - Chowdhury K, Khan S, Karim R, et al. Quality and shelf-life evaluation of packaged biscuits marketed in Bangladesh. Bangladesh J Sci Ind Res. 2012;47(1):29–42. doi:10.3329/bjsir.v47i1.10717.
CrossRef - Thai Industrial Standards Institute. Thai Community Products Standards 107/2554: Crispy Snack, Khaogriab. Bangkok, Thailand; 2011. Available from: https://tcps.tisi.go.th/public/StandardList.aspx
- Raiyan A, Hossain MM, Zahid MA, et al. Physicochemical characterization and microbial quality evaluation of Gracilaria tenuistipitata-added crackers. Appl Food Res. 2024;4(2):100623.
CrossRef - Bunkar DS, Jha A, Mahajan A, Unnikrishnan VS. Kinetics of changes in shelf-life parameters during storage of pearl millet-based kheer mix and development of a shelf-life prediction model. J Food Sci Technol. 2014;51(12):3740–3748. doi:10.1007/s13197-012-0892-8.
CrossRef
Abbreviations List
aw – Water activity
TBARS – Thiobarbituric acid reactive substances
MDA – Malondialdehyde
TEP – 1,1,3,3-tetraethoxypropane
Accepted on: 04 Nov 2025
Second Review by: Faridah Yahya
Final Approval by: Dr. Aly El Sheikha


Web of Science Coverage
Emerging Sources Citation Index (ESCI)
2024 Journal Impact Factor: 1.1
Scopus Journal Metrics
CiteScore 2024: 1.9
CiteScore Details
Sustainable Nutrition: Food Systems, Nutrient Retention, and Public Health Impact
![]()
This journal is a member of, and subscribes to the principles of, the Committee on Publication Ethics (COPE)


