Comparative Evaluation of Near-Infrared Spectroscopy and Classical Reference Methods for Nutritional Analysis of Fast-Food Products
 , Daniel Berean2*, Anca Becze3, Nastasia Belc4 and Sorin Daniel Dan1
 1Faculty of Veterinary Medicine, Department of Animal Breeding and Food Safety, University of Agricultural Sciences and Veterinary Medicine Cluj-Napoca, Cluj-Napoca, Romania
2Faculty of Veterinary Medicine, Department of Reproduction, University of Agricultural Sciences and Veterinary Medicine Cluj-Napoca, Cluj-Napoca, Romania
3Research Institute for Analytical Instrumentation, National Institute for Research and Development of Optoelectronics INOE, Cluj-Napoca, Romania
4Food Bioresources Research Division, National Institute of Research and Development for Food Bioresources (IBA Bucharest), Bucharest, Romania
Corresponding Author Email: daniel.berean@usamvcluj.ro
DOI : http://dx.doi.org/10.12944/CRNFSJ.13.3.17
Download this article as:
![]()
Nutritional profiling of fast-food products is essential for both consumer transparency and industrial quality control, yet conventional methods such as Kjeldahl, Soxhlet, and gravimetric assays are time consuming and require specialized laboratories. Near-infrared (NIR) spectroscopy offers a rapid and non-destructive alternative, but its reliability in complex food matrices such as burgers and pizzas remains underexplored. In this study, four types of burgers (10 samples each, three replicates) and thirteen types of pizzas (three replicates each) were analyzed using both reference methods and a Tango FT-NIR spectrometer to determine protein, fat, carbohydrates, sugars, ash, dietary fiber, and dry matter. Results indicated excellent agreement between NIR and classical methods for major components, including protein, fat, carbohydrates, and dry matter, with no statistically significant differences (p > 0.05). However, sugars showed systematic deviations, with overestimation in burgers (p < 0.05) and underestimation in pizzas (p < 0.01). Ash content also differed significantly in pizzas (p < 0.05), while dietary fiber showed the largest discrepancy, with NIR consistently underestimating values (p < 0.05). Despite these limitations, NIR displayed high repeatability, with standard deviations below 0.2% for most parameters. These findings confirm NIR as a robust and efficient tool for routine nutritional screening in fast food, though reference methods remain indispensable for sugars and dietary fiber.
KEYWORDS:Fast-Food Analysis; Food Quality Control; Near-Infrared Spectroscopy; Nutritional Composition; Reference Methods
Introduction
Fast food products represent a rapidly growing sector of the global food industry, characterized by high consumption rates, standardized production, and increasing scrutiny over their nutritional quality and safety.1,2 Due to their complex and heterogeneous composition, often comprising combinations of meat, bread, cheese, oils, and sauces fast foods pose significant analytical challenges. Accurate determination of parameters such as protein, fat, carbohydrates, sugars, ash, dietary fiber, and dry matter is essential not only for quality control but also for regulatory compliance and consumer health. Traditionally, these analyses have relied on classical reference methods, including oven drying for moisture, Soxhlet extraction for fat, Kjeldahl and Dumas methods for protein, and chromatographic or titrimetric approaches for sugars, salt, and additives. While these methods are well established, highly accurate, and widely accepted by regulatory agencies, they are also time consuming, labor intensive, and destructive, making them less practical for the fast paced demands of modern food production.3-7
In recent decades, near-infrared (NIR) spectroscopy has emerged as a powerful alternative for food analysis. The near-infrared (NIR) region, spanning approximately 780–2500 nm, is part of the infrared spectrum and is characterized by overtone and combination vibrations of molecular bonds such as O–H, C–H, and N–H. NIR spectroscopy refers to the analytical technique that utilizes this specific region of electromagnetic radiation to obtain qualitative and quantitative information about the chemical composition of materials.8 Based on the interaction of NIR radiation with molecular vibrations in O–H, C–H, and N–H bonds, this technique enables rapid, non-destructive, and reagent-free analysis of multiple components simultaneously. NIR spectroscopy has been successfully applied in diverse areas of food science, and its integration into fast food analysis offers particular advantages for routine monitoring and real time process control. However, its effectiveness depends on robust chemo-metric modeling, and it may lack the sensitivity required for trace components compared to classical techniques.9-11
Although NIR spectroscopy has been widely applied in food analysis in general, its specific application to fast food products remains relatively limited. Only a few studies have investigated its use in this sector, often focusing on isolated parameters such as fat in fried products, protein in meat patties, or oil quality during frying.12-14 While these studies demonstrate the feasibility of NIR for rapid, non-destructive analysis, a comprehensive evaluation of fast food items as complex, multi component matrices has not yet been fully achieved. Most existing research does not provide a complete description of nutritional parameters such as protein, fat, carbohydrates, sugars, ash, dietary fiber, and dry matter within the same product, nor does it systematically compare NIR performance with classical reference methods across different categories of fast food.4,5,9,11 This gap highlights the need for more integrative studies that assess the full potential of NIR as a routine tool for quality control and nutritional profiling in the fast food industry.
Comparing NIR spectroscopy with classical methods in the context of fast food products is therefore of high relevance. Such a comparison not only highlights the strengths and limitations of each approach but also addresses key issues of analytical speed, cost-effectiveness, environmental sustainability, and industrial feasibility. This study aims to critically evaluate the application of NIR and traditional reference methods for the analysis of fast food products, with a focus on nutritional parameters and future directions for rapid food testing in this dynamic sector.
Materials and Methods
Sample collection and preparation
The study focused on two representative categories of fast food products: burgers and pizza. Four distinct types of burgers and thirteen types of pizza were purchased from major commercial fast food outlets. For the burger category, ten independent samples were collected for each type, while for pizza one sample was obtained for each of the thirteen types. All products were transported to the laboratory under controlled conditions, homogenized immediately, and subdivided to allow parallel analysis by classical reference methods and NIR. For NIR analysis, each burger sample was analyzed in triplicate, resulting in a total of thirty spectra per burger type. For pizza, three replicate measurements were performed for each of the thirteen varieties.
Classical reference methods
The determination of the proximate chemical composition was carried out in an ISO-accredited laboratory using validated reference protocols. Protein was quantified using the Kjeldahl method, which measures total nitrogen content and applies a standard conversion factor (N × 6.25) to obtain protein values.15 Lipid content was determined by Soxhlet extraction with petroleum ether.16 Total carbohydrates were calculated by difference, and sugars were measured using the modified School method, based on reduction of Fehling’s solution after inversion.16 Moisture content was determined by oven drying at 105 °C to constant weight (AOAC 925.10),17 and dry matter was calculated by difference.18 Total dietary fiber was determined using the enzymatic gravimetric AOAC 985.29 method. Ash content was determined by incineration in a muffle furnace at 550 °C (AOAC 923.03). In addition, the energetic value (kcal and kJ/100 g) was calculated in accordance with Regulation (EU) No. 1169/2011 on the provision of food information to consumers.19 For each burger and pizza type, one determination was performed for the classical analyses, which served as reference values for calibration and validation of NIR models.
Near-infrared spectroscopy
Near-infrared spectroscopy was conducted using a Bruker Tango FT-NIR spectrometer equipped with a MATRIX module (Bruker Optics GmbH, Germany). The instrument operated in the spectral range of 780–2500 nm in reflectance mode. Prior to scanning, samples (burgers and pizzas) were homogenized to minimize particle size and packing density heterogeneity, and stored at a consistent temperature (20 – 25 °C)/humidity (30 – 60%) condition to reduce moisture variation. A replicative measurement scheme (e.g., three scans per sample) was applied to assess spectral repeatability. The instrument was calibrated for reflectance measurements using a certified white reference standard and a dark current measurement. For burgers, ten independent samples were analyzed per type, with three replicate spectra collected for each sample, resulting in thirty spectra per burger type. For pizzas, thirteen individual products were analyzed, and three replicate spectra were obtained for each, ensuring reproducibility and minimizing instrumental variability. All spectra were recorded at room temperature with a resolution of 4 cm⁻¹ and averaged from 32 scans to improve the signal to noise ratio. Between measurements, the instrument was calibrated with a reference standard to ensure spectral stability. Spectral resolution, number of scans averaged, and optical path reflectance geometry were optimized to ensure a sufficient signal‑to‑noise ratio (S/N). Raw spectra were subject to preprocessing steps, such as smoothing, baseline correction, multiplicative scatter correction (MSC) or standard normal variate (SNV), and first/second derivative transformation, to minimize physical interferences (scatter, path length variation) and enhance chemical absorption features.20
Chemo-metric analysis
The spectral data were processed using chemo-metric techniques, with partial least squares (PLS) regression employed to establish calibration models for each parameter of interest. Classical reference values obtained from the accredited laboratory were used as calibration and validation targets. Models were optimized and validated to enable the prediction of ash, carbohydrates, dry matter, dietary fiber, fat, protein, and total sugar content, allowing for a direct comparison between the performance of conventional analytical techniques and NIR spectroscopy in fast food analysis.
Statistical analysis
All statistical analyses were performed using SPSS v.27 (IBM Corp.) and Python (Matplotlib and SciPy libraries). Normality of data distribution was verified with the Shapiro Wilk test, and homogeneity of variances was assessed via Levene’s test. Differences between NIR and classical methods were evaluated using paired sample t-tests, with statistical significance set at p < 0.05. One-way ANOVA was employed to examine variability among product types, followed by Tukey’s HSD for post hoc comparisons. Precision was expressed as mean ± standard deviation (SD) across replicates. Reliability of NIR predictions was further evaluated using Pearson’s correlation coefficients and coefficients of determination (R²) against reference values.
Results
Nutritional composition of burgers
The proximate composition of the four burger types is presented in Table 1. Protein values determined by the Kjeldahl method averaged 9.20%, while NIR spectroscopy yielded a slightly higher mean of 9.35 ± 0.08%. The variability between the three replicate NIR determinations for each burger sample was minimal, with a standard deviation generally below 0.10%, indicating high reproducibility. No significant difference was found between the two methods (p = 0.21).
Fat content followed a similar pattern: classical Soxhlet extraction returned 10.10%, while NIR measurements gave 10.00 ± 0.10%, with replicate variation again restricted to ≤0.12%. Carbohydrates accounted for approximately 36.0% according to EU Regulation 1169/2011, closely mirrored by NIR at 36.25 ± 0.20%, with replicate results differing by less than 0.15%.
Sugars, however, showed a small but significant discrepancy. The School method determined a mean of 8.40%, whereas NIR consistently overestimated values, averaging 8.65 ± 0.15%. Although the difference was statistically significant (p < 0.05), the triplicate NIR determinations showed good consistency, with intra-sample variability under 0.2%. Ash content was stable across methods, with 1.90% obtained gravimetrically and 1.85 ± 0.05% by NIR (p = 0.33).
Dietary fiber showed a notable difference: the classical method measured 3.00%, while NIR significantly underestimated the content at 2.20 ± 0.35% (p = 0.01), indicating caution when using NIR for fiber determination. In contrast, dry matter was consistent across methods, with 49.00% determined classically and 49.10 ± 0.50% by NIR (p = 0.52), reflecting reliable performance of NIR for this parameter.
Table 1: Comparison of classical and NIR determinations for burgers (mean ± SD, %; n=4 types, 10 samples/type, 3 replicates/sample for NIR).
| Parameter | Classical Method | NIR (mean ± SD) | p-value |
| Protein (%) | 9.20 | 9.35 ± 0.08 | 0.21 |
| Fat (%) | 10.10 | 10.00 ± 0.10 | 0.47 |
| Carbohydrates (%) | 36.00 | 36.25 ± 0.20 | 0.18 |
| Sugars (%) | 8.40 | 8.65* ± 0.15 | 0.04 |
| Ash (%) | 1.90 | 1.85 ± 0.05 | 0.33 |
| Dietary Fiber (%) | 3.00 | 2.20* ± 0.35 | 0.01 |
| Dry Matter (%) | 49.00 | 49.10 ± 0.50 | 0.52 |
* = significant (p < 0.05);
Nutritional composition of pizzas
For pizzas, classical reference methods revealed higher protein and carbohydrate contents compared to burgers (Table 2). Protein levels reached 12.00% by the Kjeldahl method, while NIR estimated slightly higher values at 12.25 ± 0.12%. Triplicate NIR analyses for each sample displayed a standard deviation of approximately 0.10%, confirming high repeatability. The difference between classical and NIR was statistically significant (p = 0.03).
Fat contents were more balanced: 9.10% by Soxhlet extraction versus 8.90 ± 0.15% by NIR (p = 0.12), with replicate values differing by less than 0.15%. Carbohydrates dominated the pizza composition, with 37.40% obtained classically and 37.55 ± 0.25% by NIR. Variability across the three determinations remained below 0.2%, and the difference was not significant (p = 0.29).
Sugars presented the most evident divergence. The School method indicated 4.10%, while NIR underestimated with 3.80 ± 0.20%. The triplicate measurements were consistent (SD ≈ 0.18%), yet the mean difference was highly significant (p = 0.01). Ash content showed a similar trend, with 2.50% classically and 2.60 ± 0.08% by NIR, with replicate variability under 0.1% but a significant difference at p = 0.04.
Dietary fiber was also underestimated by NIR, with 2.60% measured classically versus 2.10 ± 0.25% by NIR, showing a significant difference (p = 0.02). In contrast, dry matter was consistent between methods, with 57.50% determined classically and 57.30 ± 0.40% by NIR (p = 0.40), reflecting reliable NIR performance for this parameter.
Table 2: Comparison of classical and NIR determinations for pizzas (mean ± SD, %; n=13 types, 3 replicates/sample for NIR).
| Parameter | Classical Method | NIR (mean ± SD) | p-value |
| Protein (%) | 12.00 | 12.25* ± 0.12 | 0.03 |
| Fat (%) | 9.10 | 8.90 ± 0.15 | 0.12 |
| Carbohydrates (%) | 37.40 | 37.55 ± 0.25 | 0.29 |
| Sugars (%) | 4.10 | 3.80* ± 0.20 | 0.01 |
| Ash (%) | 2.50 | 2.60* ± 0.08 | 0.04 |
| Dietary Fiber (%) | 2.60 | 2.10* ± 0.25 | 0.02 |
| Dry Matter (%) | 57.50 | 57.30 ± 0.40 | 0.40 |
* = significant (p < 0.05).
Discussion
In the present study, reproducibility was assessed on four burger types (ten units per type, each analyzed in triplicate) and thirteen pizza types (each analyzed in triplicate), using FT-NIR spectroscopy. This experimental design generated a robust dataset for evaluating variability both within and across samples. The exceptionally low variability observed in our NIR measurements, standard deviations generally below 0.2 % across triplicate scans, reflects strong repeatability, which is the agreement between successive measurements under identical conditions. This consistency aligns with broader NIR literature, where averaging multiple spectra is known to improve model stability and predictive precision.20,21 Such reliability reaffirms NIR’s suitability for routine screening workflows in fast-food quality control.
Our findings show that protein and fat levels in burgers and pizzas were closely matched between classical methods (Kjeldahl for protein, Soxhlet for fat) and NIR spectroscopy, with only minor deviations (Figure 1a,1b). In pizzas, a slight overestimation was observed for protein (+0.25 %), whereas fat values remained essentially unchanged between methods. This agreement highlights the suitability of NIR for quantifying macronutrients that are present in relatively high concentrations and exhibit strong, distinct absorption features in the near-infrared region. The performance of NIR is particularly robust for fat, where predictive accuracy is consistently reported to reach correlation coefficients of 0.98–0.99 in complex food matrices.22,23 Protein predictions, while generally less precise due to overlapping bands with water and carbohydrates, still fall within acceptable tolerances for industrial applications, typically achieving R² values above 0.90.11 In the present study, the variation between methods remained below 0.3 %, reinforcing the reliability of NIR for rapid nutritional profiling in fast-food products.
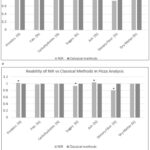 |
Figure 1: Relative agreement of NIR spectroscopy with classical reference methods for burgers (a) and pizzas (b). Classical values were set as baseline (100%), and NIR predictions are expressed as percentages of these reference values. |
The comparison also emphasizes critical differences in workflow efficiency. Classical methods, while considered reference standards, are laborious, time consuming, and destructive: The Kjeldahl procedure requires extensive digestion, distillation, and titration steps, often taking 6–8 hours per batch of samples, while Soxhlet extraction for fat analysis can require 4–6 hours per run with large volumes of organic solvents.24 These approaches provide high accuracy but demand significant laboratory infrastructure, trained personnel, and strict adherence to ISO protocols. In contrast, NIR spectroscopy is a rapid, non-destructive technique that requires minimal or no sample preparation. It can generate results within minutes, enabling high throughput screening of large numbers of samples and significantly reducing both operational costs and labor demands. This makes NIR particularly advantageous for real-time monitoring and quality control in food production, where speed and efficiency are critical without compromising predictive accuracy.9,25 Nevertheless, NIR does not fully replace classical methods. Its calibration models must be built and validated against reference data, and accuracy can be influenced by sample heterogeneity, matrix effects, and spectral overlap. For this reason, NIR is often positioned as a complementary technique, ideal for routine monitoring, while classical methods remain indispensable for regulatory compliance and official labeling.26
Regarding the carbohydrate content, estimations obtained via NIR spectroscopy showed strong agreement with those obtained by classical calculations according to EU Regulation 1169/2011 (Figure 1a,1b). The differences between methods were slight and statistically non-significant, confirming that NIR models are highly effective in predicting bulk carbohydrate fractions in complex food matrices. This performance is consistent with previous studies, which have reported that NIR spectroscopy reliably captures total carbohydrate composition in agricultural products such as cereals, fruits, and dairy based products, where overlapping vibrational bands of C–H, O–H, and N–H groups provide sufficient spectral information.27-29
A key strength of NIR in carbohydrate analysis is its ability to use multi-component regression models to capture the combined spectral contributions of starches, oligosaccharides, and dietary fiber. These models can account for matrix variability, which explains the robustness of NIR predictions observed in our dataset. For instance, in both burgers and pizzas, the variation between classical and NIR values remained below 0.2 %, which falls within the analytical tolerance typically accepted in industrial food screening. However, the technique also presents limitations when finer compositional details are required. Distinguishing between starch, dietary fiber, and specific sugar fractions remains challenging because of strong spectral overlap in the 1400–2400 nm region.11 As highlighted in earlier work,26 NIR alone cannot fully resolve individual carbohydrate components without advanced calibration and chemo-metric techniques, such as partial least squares regression combined with variable selection algorithms. Furthermore, heterogeneity in processed foods, particularly in pizzas with varied toppings and crust compositions, can introduce localized scattering effects that slightly reduce prediction precision. Despite these challenges, the advantages of NIR over classical approaches are notable. The conventional calculation of carbohydrate content by difference, while standardized and accepted for labeling purposes, can propagate errors from other determinations (protein, fat, moisture, and ash) and is not a direct measurement of carbohydrates. By contrast, NIR provides a rapid, non-destructive, and direct spectral estimate of total carbohydrates in under two minutes per sample, with no need for chemical reagents or labor-intensive steps. This rapid throughput makes it particularly appealing for food industry applications where timely quality control decisions are critical.
Sugars demonstrated the most pronounced discrepancies in our analysis. NIR slightly overestimated sugar content in burgers (+0.25 %, p < 0.05) and significantly underestimated it in pizzas (–0.30 %, p < 0.05). These results are in line with previous reports indicating that the predictive accuracy of NIR spectroscopy decreases when applied to minor constituents embedded in heterogeneous food matrices. The difficulties in sugar determination arise primarily from the overlapping of absorption bands with water and starch in the 1400–2400 nm region, which reduces the specificity of sugar-related signals.26,30,31 Moisture interference further complicates the analysis, particularly in pizza doughs where variable hydration masks subtle spectral differences, while spatial heterogeneity created by crust, sauce, and toppings introduces additional scattering effects and contributes to variability in the readings.32
The discrepancies observed in dietary fiber quantification highlight an important limitation of NIR spectroscopy. Unlike protein or fat, dietary fiber represents a chemically complex and heterogeneous fraction, often defined operationally rather than chemically. Classical methods, such as enzymatic gravimetric approaches standardized by AOAC—directly measure non digestible polysaccharides and lignin. In contrast, NIR detects functional group vibrations, which may overlap with signals from starches, sugars, or moisture, leading to weaker calibration models for fiber. Literature consistently reports that dietary fiber is among the most challenging components to predict accurately with NIR, especially in composite or processed food matrices like pizzas and burgers.33,34 The pronounced underestimation in both burgers, and pizzas (-26.7% and –19.2% relative deviation) confirms that NIR requires more targeted calibrations or hybrid chemo-metric approaches to achieve reliable fiber predictions.
In contrast, dry matter exhibited excellent agreement between classical and NIR methods. This outcome is expected, as dry matter essentially reflects water content, which strongly absorbs in the NIR region due to overtone and combination bands of O–H stretching. Consequently, moisture and dry matter predictions are among the most robust and widely validated applications of NIR in food analysis.35 Our findings support this consensus: deviations remained below 0.3% in both burgers and pizzas, with standard deviations under 0.5%, confirming NIR’s reliability for moisture related determinations in fast food matrices.
These challenges are not unique to fast-food products. Similar inconsistencies have been described in studies on granulated and lump sugars, where non-uniform noise patterns and background interferences were shown to compromise spectral reproducibility.36 Reviews of carbohydrate analysis confirm that, while NIR models can reliably estimate total carbohydrate content, they struggle to resolve individual components such as mono and disaccharides without extensive calibration and chemo metric refinement. In order to address these limitations, researchers have highlighted the need for broader calibration datasets that capture the full variability of target matrices. Preprocessing techniques such as standard normal variate transformation and derivative filtering have been shown to reduce baseline drift and correct scattering artifacts, thereby improving partial least squares regression models applied to sugar prediction. Recent developments in machine learning, including neural network approaches and active learning frameworks, offer further potential to enhance prediction accuracy by focusing on the most informative spectral regions.37-39 Taken together, the discrepancies we observed for sugars underline a central limitation of NIR spectroscopy. While the technique performs exceptionally well for bulk macronutrients such as protein, fat, and total carbohydrates, its reliability for sugars remains conditional on matrix complexity, moisture variability, and model calibration strategies. For routine industrial applications, this suggests that NIR is best deployed as a rapid screening tool, while confirmatory sugar determinations in regulatory contexts continue to rely on standardized wet-chemistry methods.
Although the differences in ash content between classical and NIR determinations were modest, ranging between 0.1 and 0.2 %, they were statistically significant in pizzas (p < 0.05). This finding reflects a broader consensus in the literature that NIR spectroscopy is inherently limited in detecting minerals and inorganic compounds, since these do not exhibit strong fundamental absorptions in the near-infrared region.11,40 Instead, the NIR signal associated with ash is often indirect, captured through correlations with organic matter that covaries with mineral content.41 As a result, while NIR can provide indicative estimates for minerals, it cannot replace the precision of classical gravimetric methods, which remain the gold standard for labeling and regulatory compliance. In fast-food matrices where mineral fortification or variability is relevant, relying exclusively on NIR would risk under or over estimation, reinforcing the importance of hybrid analytical approaches.
The broader implications of these results for the food industry are significant. NIR spectroscopy offers a rapid, non-destructive, and cost efficient alternative to classical wet chemistry, enabling routine nutritional profiling with minimal sample preparation. Its particular strength lies in the accurate quantification of major macronutrients such as proteins, fats, and carbohydrates, where our study found strong correlations with classical methods. This performance is consistent with prior findings in dairy, meat, and cereal products, where NIR has been validated as a robust tool for quality monitoring.27-29 For industrial fast food chains, the ability to screen large numbers of samples quickly can improve supply chain consistency and facilitate compliance with nutritional labeling regulations.
Nonetheless, limitations persist for constituents such as sugars and ash, where NIR predictions were less reliable. In practice, this suggests that a tiered approach may be optimal: NIR for routine, high throughput screening of bulk nutrients, supplemented by confirmatory wet chemistry for components that are present in smaller concentrations or are more variable. Such integration could balance efficiency with analytical rigor, reducing overall costs while maintaining compliance with EU Regulation 1169/2011 and comparable standards elsewhere.
A critical limitation of the present study is the relatively narrow sample base, comprising four burger types and thirteen pizza varieties, each tested in triplicate. While sufficient to demonstrate proof of concept, this dataset does not capture the full variability inherent in fast-food formulations across different brands, production sites, or seasonal raw materials. Literature consistently emphasizes that the robustness of NIR calibration models depends heavily on the diversity of the training set; models constructed on restricted datasets tend to perform poorly when applied to external samples.42,43 Expanding the calibration database to include wider ranges of ingredients, processing conditions, and geographical origins will be crucial for translating NIR into industry wide monitoring tools.
Future research should also focus on refining chemo metric strategies to improve predictive performance for difficult analyses. Approaches such as active learning, automated selection of informative spectral intervals, and advanced machine learning algorithms like neural networks and ensemble methods are increasingly being applied to food spectroscopy.44 These techniques reduce the need for exhaustive calibration while enhancing accuracy for minor constituents. In addition, hybrid systems combining NIR with complementary modalities such as mid infrared or hyperspectral imaging have shown promise in resolving compositional complexities in multi-component foods.45 Such developments could eventually allow for the reliable quantification of sugars, minerals, and other challenging parameters directly within industrial settings, broadening the scope of NIR beyond its current macronutrient focus.
Conclusion
This study demonstrated that NIR spectroscopy provides high reproducibility and strong agreement with classical methods for determining protein, fat, and carbohydrate content in fast food products. However, sugars and ash showed significant deviations (p < 0.05), indicating that conventional analysis remains necessary for these components. By evaluating two representative product categories, burgers and pizzas, and observing consistent performance patterns across both, our results suggest that these findings may be extended to other fast-food matrices. Overall, NIR emerges as a rapid, non-destructive tool with strong potential for industry wide nutritional screening, particularly when complemented by targeted classical methods for constituents where predictive accuracy is limited. Its implementation could enable fast-food manufacturers to perform routine quality control more efficiently, reduce analysis costs, and facilitate real time monitoring of nutritional composition across large production batches.
Acknowledgement
The authors would like to acknowledge the valuable contributions of the following institutions: the National Institute for Research and Development of Optoelectronics INOE 2000, Research Institute for Analytical Instrumentation (Cluj-Napoca, Romania), for performing the NIR determinations, and the National Institute of Research and Development for Food Bioresources – IBA Bucharest (Bucharest, Romania), for carrying out the classical analyses. Their support and expertise were essential to this work.
Funding Sources
The authors received no financial support for the research, authorship, and/or publication of this article.
Conflict of Interest
The authors do not have any conflict of interest.
Data Availability Statement
The manuscript incorporates all datasets produced or examined throughout this research study.
Ethics Statement
This research did not involve human participants, animal subjects, or any material that requires ethical approval.
Informed Consent Statement
This study did not involve human participants, and therefore, informed consent was not required.
Clinical Trial Registration
This research does not involve any clinical trials.
Permission to Reproduce Material from Other Sources
Not applicable
Author Contributions
- Raluca Cimpean: Conceptualization, Methodology, Validation, Investigation, Writing—original draft preparation.
- Daniel Berean: Conceptualization, Software, Formal Analysis, Writing—Review and Editing.
- Anca Becze: Validation, Data curation Visualization.
- Nastasia Belc: Formal analysis, Resources.
- Sorin Daniel Dan: Funding Acquisition, Resources, Supervision, Validation, Project Administration.
References
- Monteiro CA, Moubarac JC, Cannon G et al., Ultra-processed products are becoming dominant in the global food system. Obes Rev. 2013 Nov;14 Suppl 2:21-8. doi: 10.1111/obr.12107.
CrossRef - Rauber F, Campagnolo PD, Hoffman DJ et al., Consumption of ultra-processed food products and its effects on children’s lipid profiles: a longitudinal study. Nutr Metab Cardiovasc Dis. 2015 Jan;25(1):116-22. doi: 10.1016/j.numecd.2014.08.001.
CrossRef - Thiex N, Richardson CR. Challenges in measuring moisture content of feeds. J Anim Sci. 2003 Dec;81(12):3255-66. doi: 10.2527/2003.81123255x.
CrossRef - Xinyu Y, Xinyue T, Lingchen T et al., Royal Jelly Fatty Acids: Chemical Composition, Extraction, Biological Activity, and Prospect, Journal of Functional Foods, Volume 111, 2023, 105868, ISSN 1756-4646, https://doi.org/10.1016/j.jff.2023.105868.
CrossRef - Thompson M, Owen L, Wilkinson K et al., A comparison of the Kjeldahl and Dumas methods for the determination of protein in foods, using data from a proficiency testing scheme. 2002 Dec;127(12):1666-8. doi: 10.1039/b208973b.
CrossRef - Cortés-Herrera C, Artavia G, Leiva A et al., Liquid Chromatography Analysis of Common Nutritional Components, in Feed and Food. 2018 Dec 20;8(1):1. doi: 10.3390/foods8010001.
CrossRef - Haiyan W, Fenglan Z, Jin C et al., Comparison of Chromatographic and Titrimetric Methods for the Determination of the a-amino Nitrogen in Standard Solution and Fish Protein Hydrolysates. Journal of Food Research, 2012. Doi: 1. 174-174. 10.5539/jfr.v1n4p174.
CrossRef - Li J, Li Y, Huang M et al., The most fundamental and popular literature on functional near-infrared spectroscopy: a bibliometric analysis of the top 100 most cited articles. Front Neurol. 2024 May 2;15:1388306. doi: 10.3389/fneur.2024.1388306.
CrossRef - Beć, K. B., Grabska, J., Huck, C. W. Miniaturized NIR spectroscopy in food analysis and quality control: Promises, challenges, and perspectives. Foods, 2022, 11(10), 1465.
CrossRef - Zareef, M., Chen, Q., Hassan, M. M., et al., An overview on the applications of typical non-linear algorithms coupled with NIR spectroscopy in food analysis. Food Engineering Reviews, 2020, 12(2), 173-190.
CrossRef - Grassi, S., Alamprese, C. (2018). Advances in NIR spectroscopy applied to process analytical technology in food industries. Current Opinion in Food Science, 22, 17-21.
CrossRef - Linlin Z, Min Z, Haixiang et al. Monitoring of free fatty acid content in mixed frying oils by means of LF-NMR and NIR combined with BP-ANN, Food Control, Volume 133, Part A, 2022, 108599, ISSN 0956-7135, https://doi.org/10.1016/j.foodcont.2021.108599.
CrossRef - Edwards K, Hoffman LC, Manley M, et al., Raw Beef Patty Analysis Using Near-Infrared Hyperspectral Imaging: Identification of Four Patty Categories. Sensors (Basel). 2023 Jan 7;23(2):697. doi: 10.3390/s23020697.
CrossRef - Liu Y, Sun L, Bai H, et al., Detection for Frying Times of Various Edible Oils Based on Near-Infrared Spectroscopy. Applied Sciences. 2020; 10(21):7789. https://doi.org/10.3390/app10217789.
CrossRef - Chromý V, Vinklárková B, Šprongl L, et al., The Kjeldahl method as a primary reference procedure for total protein in certified reference materials used in clinical chemistry. I. A review of Kjeldahl methods adopted by laboratory medicine. Crit Rev Anal Chem. 2015;45(2):106-11. doi: 10.1080/10408347.2014.892820. PMID: 25558772.
CrossRef - Neal B, Sacks G, Swinburn B, et al., Monitoring the levels of important nutrients in the food supply. Obes Rev. 2013 Oct;14 Suppl 1:49-58. doi: 10.1111/obr.12075. PMID: 24074210.
CrossRef - RAE J. Fehling’s solution and its modifications. Pharm J. 1948 Feb 21;106(4399):133. PMID: 18933769.
- Leffler TP, Moser CR, McManus BJ, et al., Determination of moisture and fat in meats by microwave and nuclear magnetic resonance analysis: collaborative study. J AOAC Int. 2008 Jul-Aug;91(4):802-10. PMID: 18727540.
CrossRef - Regulation (EU) No 1169/2011 of the European Parliament and of the Council.
- Cozzolino D. The Ability of Near Infrared (NIR) Spectroscopy to Predict Functional Properties in Foods: Challenges and Opportunities. Molecules. 2021 Nov 19;26(22):6981. doi: 10.3390/molecules26226981.
CrossRef - Fodor, M., Matkovits, A., Benes, E. L., et al. The Role of Near-Infrared Spectroscopy in Food Quality Assurance: A Review of the Past Two Decades. Foods, 2024, 13(21), 3501. https://doi.org/10.3390/foods13213501
CrossRef - Davies T. Book Reviews: Practical NIR Spectroscopy with Applications in Food and Beverage Analysis, Ft-NIR Atlas: Something Old, Something New. NIR news. 1993;4(5):12. doi:1255/nirn.212
CrossRef - Haiyan C., Yong H., Theory and application of near infrared reflectance spectroscopy in determination of food quality,Trends in Food Science and Technology,Volume 18, Issue 2,2007,Pages 72-83, ISSN 0924-2244,https://doi.org/10.1016/j.tifs.2006.09.003.
CrossRef - AOAC International. Official Methods of Analysis, 20th Edition. AOAC, 2016.
- He, W., Zeng, Q., Non-Invasive Food Authentication Using Vibrational Spectroscopy Techniques for Low-Resolution Food Fingerprinting. Applied Sciences, 2025, 15(11), 5948. https://doi.org/10.3390/app15115948
CrossRef - Pasquini C., Near infrared spectroscopy: A mature analytical technique with new perspectives – A review. Anal Chim Acta. 2018 Oct 5;1026:8-36. doi: 10.1016/j.aca.2018.04.004. Epub 2018 Apr 17. PMID: 29852997.
CrossRef - Pandiselvam R, Prithviraj V, Manikantan MR, et al., Recent advancements in NIR spectroscopy for assessing the quality and safety of horticultural products: A comprehensive review. Front Nutr. 2022 Oct 12;9:973457. doi: 10.3389/fnut.2022.973457.
CrossRef - Tsuchikawa S., Ma T., Inagaki T., Application of near-infrared spectroscopy to agriculture and forestry. Anal Sci. 2022 Apr;38(4):635-642. doi: 10.1007/s44211-022-00106-6.
CrossRef - Hebling E., Tavares J.P., da Silva Medeiros M.L., et al., Near-infrared techniques for fraud detection in dairy products: A review. J Food Sci. 2022 May;87(5):1943-1960. doi: 10.1111/1750-3841.16143. Epub 2022 Mar 31. PMID: 35362099.
CrossRef - López, M. G., García-González, A. S., Franco-Robles, E., Carbohydrate Analysis by NIRS-Chemo-metric s. InTech. 2017, doi: 10.5772/67208.
CrossRef - Gruska, R. M., Kunicka-Styczyńska, A., Molska, M. (2025). Application of Fourier Transform Near-Infrared Spectroscopy and Chemo-metric s for Quantitative Analysis of Milk of Lime (MOL) Used in the Sugar Industry. Molecules, 30(11), 2308. https://doi.org/10.3390/molecules30112308.
CrossRef - Malvandi A, Feng H, Kamruzzaman M. Application of NIR spectroscopy and multivariate analysis for Non-destructive evaluation of apple moisture content during ultrasonic drying. Spectrochim Acta A Mol Biomol Spectrosc. 2022 Mar 15;269:120733. doi: 10.1016/j.saa.2021.120733.
CrossRef - Kim Y, Singh M, Kays SE., Near-infrared spectroscopy for measurement of total dietary fiber in homogenized meals. J Agric Food Chem. 2006 Jan 25;54(2):292-8. doi: 10.1021/jf051975b. PMID: 16417282.
CrossRef - Badaró AT, Morimitsu FL, Ferreira AR, et al., Identification of fiber added to semolina by near infrared (NIR) spectral techniques. Food Chem. 2019 Aug 15;289:195-203. doi: 10.1016/j.foodchem.2019.03.057. Epub 2019 Mar 12. PMID: 30955603.
CrossRef - Parra-Forero D, Valencia-Echavarría DM, Mestra-Vargas LI, et al., Use of near-infrared reflectance spectroscopy on feces to estimate digestibility and dry matter intake of dietary nutritional characteristics under grazing conditions in Colombian creole steers. Trop Anim Health Prod. 2023 Apr 29;55(3):178. doi: 10.1007/s11250-023-03571-x.
CrossRef - Amodio M, Ceglie F, Chaudhry M, et al., Potential of NIR spectroscopy for predicting internal quality and discriminating among strawberry fruits from different production systems. Postharvest Biology and Technology. 2017, 125. 112-121. 10.1016/j.postharvbio.2016.11.013.
CrossRef - Xi H, Gong Y., Optical Non-Invasive Glucose Monitoring Using Aqueous Humor: A Review. Sensors (Basel). 2025 Jul 7;25(13):4236. doi: 10.3390/s25134236.
CrossRef - Biswas A, Chaudhari SR., Exploring the role of NIR spectroscopy in quantifying and verifying honey authenticity: A review. Food Chem. 2024 Jul 1;445:138712. doi: 10.1016/j.foodchem.2024.138712.
CrossRef - He H., Sun D.W., Pu H., et al.. Applications of Raman spectroscopic techniques for quality and safety evaluation of milk: A review of recent developments. Crit Rev Food Sci Nutr. 2019;59(5):770-793. doi: 10.1080/10408398.2018.1528436.
CrossRef - Cozzolino, D. Conventional Near-Infrared Spectroscopy and Hyperspectral Imaging: Similarities, Differences, Advantages, and Limitations. Molecules, 2025, 30(12), 2479. https://doi.org/10.3390/molecules3012247
CrossRef - Sakirkin SL, Morgan CL, MacDonald JC, et al., Effect of diet composition on the determination of ash and moisture content in solid cattle manure using visible and near-infrared spectroscopy. Appl Spectrosc. 2011 Sep;65(9):1056-61. doi: 10.1366/11-06333. PMID: 21929861.
CrossRef - Beć KB, Grabska J, Huck CW. In silico NIR spectroscopy – A review. Molecular fingerprint, interpretation of calibration models, understanding of matrix effects and instrumental difference. Spectrochim Acta A Mol Biomol Spectrosc. 2022 Oct 15;279:121438. doi: 10.1016/j.saa.2022.121438.
CrossRef - Duan C, Liu X, Cai W, et al. Spectral Encoder to Extract the Features of Near-Infrared Spectra for Multivariate Calibration. J Chem Inf Model. 2022 Aug 22;62(16):3695-3703. doi: 10.1021/acs.jcim.2c00786. Epub 2022 Aug 2. PMID: 35916486.
CrossRef - Yves R., Pascal C., Lene M., et al., A review of near infrared spectroscopy and chemo-metric s in pharmaceutical technologies, Journal of Pharmaceutical and Biomedical Analysis, Volume 44, Issue 3, 2007, Pages 683-700, ISSN 0731-7085, https://doi.org/10.1016/j.jpba.2007.03.023.
CrossRef - Weijie L., Vincent B., Benoit J., et al., Comparison of near-infrared, mid-infrared, Raman spectroscopy and near-infrared hyperspectral imaging to determine chemical, structural and rheological properties of apple purees. Journal of Food Engineering, 2022, 323, pp.111002. 10.1016/j.jfoodeng.2022.111002. hal-03604054.
CrossRef
Accepted on: 07 Nov 2025
Second Review by: Emilia Latorre
Final Approval by: Dr. Kresimir Mastanjević


Web of Science Coverage
Emerging Sources Citation Index (ESCI)
2024 Journal Impact Factor: 1.1
Scopus Journal Metrics
CiteScore 2024: 1.9
CiteScore Details
Sustainable Nutrition: Food Systems, Nutrient Retention, and Public Health Impact
![]()
This journal is a member of, and subscribes to the principles of, the Committee on Publication Ethics (COPE)


