Effect of Pretreatment Methods using Citric Acid and Sodium Metabisulfite on Browning Prevention of Yacon (Smallanthus sonchifolius)
 , Nguyen Hoang An, Le Thi Thanh Nga, Pham Phuong Thanh, Nguyen Van Hungand Vu Thu Trang
 Department of Food Engineering, School of Chemistry and Life Sciences, Hanoi University of Science and Technology, Dai Co Viet, Hanoi, Vietnam
Corresponding author: Hanh.nguyenthi@hust.edu.vn
DOI : http://dx.doi.org/10.12944/CRNFSJ.13.2.17
Download this article as:
![]()
Yacon (Smallanthus sonchifolius) is a highly nutritious tuber rich in fructooligosaccharides (FOS), which possesses prebiotic properties and provides various health benefits. During processing, the freshly cut surface of yacon slices turns brown rapidly owing to the activity of polyphenol oxidase (PPO) and peroxidase (POD) enzymes. Therefore, controlling enzymatic browning is essential to preserve the desirable properties of yacon during processing. This research aimed to evaluate the effects of individual and combined treatments of anti-browning agents (citric acid and sodium metabisulfite (Na2S2O5)) on color stability and enzyme inhibition. After peeling and slicing, yacon slices were immersed in the prepared solutions at a solid-to-liquid ratio of 1:2 (w/v). Yacon tubers treated with the mixture of Na2S2O5 (0.5%) and citric acid (0.15%) for 15 min showed the most effective pretreatment results. Under this condition, the PPO and POD activities decreased by 89% and 90%, respectively, and the browning index (BI) reached the lowest (30.75 ± 0.34). Moreover, the lightness (L*) reached the highest (43.30 ± 0.16) compared to the other methods examined, indicating that the method retained the characteristic color of the fresh tubers. This study contributes to the development of appropriate preservation techniques to extend the shelf life of yacon and enhance its potential applications in further product processing.
KEYWORDS:Citric acid; Pretreatment; Polyphenoloxidase; Peroxidase; Sodium metabisulfite; Yacon
Introduction
Yacon (Smallanthus sonchifolius), native to the Andes, is currently found in many countries such as New Zealand, Japan, South Korea, and China.1,2 It has also gained increasing attention in Vietnam due to its outstanding health benefits. Yacon is widely cultivated in Bat Xat, Lao Cai province of Vietnam, and is considered a specialty of this mountainous region.
Yacon tubers contain high levels of fructooligosaccharides (FOS),2 which promotes the growth of Bifidobacterium spp. and Lactobacillus spp. in the gut, hence improving digestion and the immune system.3–6 Additionally, yacon tuber contains inulin and powerful antioxidants, mainly flavonoids and phenolic compounds,6 which contribute to its anti-cancer, antioxidant, antidiabetic, and weight management properties.4,7–10 Several research studies 9,11,12 have reported that yacon extract can inhibit cancer cell growth and support colon cancer prevention. Yacon has also shown antidiabetic effects by regulating blood glucose levels and improving insulin resistance.8,10,13 Furthermore, studies on humans indicate that consuming yacon powder helps to reductions in weight, body fat, and waist circumference.7
Despite their numerous benefits, yacon tubers have not been processed efficiently. One of the main reasons is their rapid oxidation, which leads to discoloration, reduces aesthetics, and negatively impacts the quality of processed products. During processing, yacon turns brown quickly after peeling, primarily due to the activity of polyphenol oxidase (PPO) and peroxidase (POD). These enzymes catalyze the oxidation of phenolic compounds, resulting in darkening on the fruit slice’s surface.14–17
In plant cells, polyphenol oxidase (EC 1.10.3.1) is found in plastids, while phenolic substances are found in the vacuoles. The enzymatic browning reaction is initiated when PPO and phenolic compounds come into contact at damaged cell areas.18 PPO catalyzes the oxidation of o-diphenols to o-quinones and the o-hydroxylation of monophenols to o-diphenols when molecular oxygen is present. Quinones are highly reactive, electrophilic compounds that can polymerize with phenols or other quinones to generate pigments that are either black or brown.19 Consequently, controlling enzymatic browning is important in processing to fully utilize the potential of yacon.
One of the conventional methods to prevent enzymatic browning is the use of chemical inhibitor agents such as citric acid and sodium metabisulfite (Na2S2O5). The inhibitory effect of these substances on fruits and vegetables has been reported in previous studies.17,20,21 Among the acids, citric acid is widely used to prevent enzymatic browning of various food products owing to its affordable, ease of use and wide range of applications. Citric acid inhibits enzymatic browning by reducing the pH and forming complexes with metal ions at the active sites of PPO.19 Meanwhile, sulfites are also economical and efficient anti-browning agents. Sodium metabisulfite prevents browning by reacting with quinones and inhibiting their polymerization into brown pigments.15 Although sulfites are highly effective and cost-efficient, concerns about their allergic reactions in some individuals, particularly in asthmatic patients, may arise.19 Therefore, it is essential to study the use of this substance at low concentrations to competently preserve the products while minimizing potential risks.
The study aims to support future processing of yacon by assessing pretreatment methods to prevent enzymatic browning. For this purpose, physico-chemical properties of raw yacon tubers were determined, followed by the evaluation of anti-browning effects using citric acid and sodium metabisulfite, individually and in combination.
Materials and Methods
Materials
Yacon tubers, grown for a period of 6 to 8 months, were collected in late September from Bat Xat, Lao Cai, Vietnam. After harvesting, the yacon tubers were promptly transported to the laboratory within 24 hours to ensure the freshness of the raw material.
Sample preparation
Yacon tubers were washed, peeled and sliced to a thickness of 1 ± 0.05 cm before determining optimal pretreating parameters (concentration, time) of chemical agents, individually and in combination. These parameters were identified based on the analysis of color and PPO, POD activity.
Yacon tubers were washed, peeled, and then pressed using a Sharp KS-888 screw press to collect the juice and separate the pulp. Juice samples were used to analyze some physical and chemical parameters.
Identification of each agent’s optimal concentration and processing time
The concentration and immersion time of the agents can be considered as critical points in the processing, since very high concentrations and prolonged immersion can lead to significant losses of FOS due to the hydrolysis of this carbohydrate into mono- and disaccharides, such as glucose, fructose and sucrose.22 Therefore, the study conducted the following experimental procedures:
Yacon slices were individually immersed in different concentrations of chemical solutions: citric acid (0%, 0.1%, 0.15%, 0.2%, 0.25%, 0.3%) and Na2S2O5 (0%, 0.1%, 0.3%, 0.5%, 0.7%) in the ratio of 1:2 (w/v) for 20 min to determine the most effective treatment concentration of each chemical agent. At the identified optimal concentration of each agent, yacon slices were immersed in different durations (10, 20, 30 min) before conducting analysis of color and enzyme activity.
Identification of the optimal mixed agent composition
These two chemicals were mixed at different ratios and then assessed for their efficiency on color stability, enzyme activity, and immersed duration as above. The optimal concentration of citric acid was fixed while gradually reducing the concentration of Na2S2O5 (0.15% citric acid + 0.5% Na2S2O5; 0.15% citric acid + 0.3% Na2S2O5; 0.15% citric acid + 0.1% Na2S2O5; 0.15% citric acid + 0% Na2S2O5) for 20 min to determine the optimal concentration of Na₂S₂O₅. At the optimal ratio, yacon slices were immersed in different durations before conducting an analysis of color and enzyme activity. The immersion durations depended on the optimal time of each agent, as previously demonstrated. The shorter durations enhance the meaning of this study in practical applications.
Analytical methods
Determination of weight, length and diameter
A sample of 5 tubers was randomly selected and measured using a vernier caliper, with the average length and diameter recorded in centimeters. The weight of the tubers was determined using an electronic balance and expressed in grams.
Moisture content
Moisture content was measured using the techniques outlined in AOAC (2010).23 It was calculated based on the difference between the initial and final dry mass, according to the formula:
Moisture (%) = [(W1 – W2)/W1] x 100
where W1 is weight (g) of sample before drying, W2 is weight (g) of sample after drying.
Total sugars and reducing sugars
The Miller method was used to quantify the reducing sugars.24 The reaction mix, consisting of 0.3 mL of DNS reagent and 0.5 mL of the diluted sample, was heated for 5 min at 100°C and then rapidly cooled. The value of absorbance at 540 nm was measured by a UV-vis spectrophotometer (PD-3000UV, Apel Co., Japan). The standard curve used glucose (0.1–1 g/L). Determine total sugars similarly after hydrolyzing the juice sample with 2% HCl for 45 min at 100°C, followed by neutralizing the solution with 10% NaOH.
Total phenolic content
The total phenolic content (TPC) was determined using the Folin–Ciocalteu (F-C) method25 with a modification. A test tube was prepared including 1 mL of F-C reagent and 0.2 mL of juice sample. After vortexing and incubating for three min, 0.8 mL of 7.5% Na2CO3 was added, and the mixture was reacted for a further hour at ambient temperature without light. A UV-vis spectrophotometer (PD-3000UV, Apel Co., Japan) was used to measure the absorbance of the solution at 765 nm. To produce the standard curve, gallic acid was utilized at concentrations between 25 and 125 mg/L.
Antioxidant activity and scavenging
The scavenging activity was evaluated using the DPPH method.26 After the sample and the DPPH solution mixture reacted for one hour in the dark, the absorbance was measured at 517 nm by a UV-vis spectrophotometer. The scavenging percentage (%SP) was calculated as follows:
%SP = [(Abl-Asa)/Abl] x 100
where Abl represents the absorbance of the blank, and Asa denotes the absorbance of the sample.
The antioxidant capacity, expressed as IC₅₀, was determined from the scavenging percentage and a standard curve constructed with vitamin C at the point where y = 50%.
The quantity of vitamin C
Iodometric titration was used to measure the quantity of vitamin C, based on the principle of oxidation-reduction reaction between ascorbic acid and iodine solution.27 Starch indicator solution was prepared by dissolving 0.5 g of starch in 100 mL of boiling water and letting it cool. Dissolving 2.50 g of KI and 0.134 g of KIO₃ in 100 mL of purified water, 15 mL of 3M H₂SO₄ was added to create a 0.01N iodine solution. The solution was then made up to 250 mL. Standardization was performed using 5 mL of 0.5% ascorbic acid along with 3 drops of starch indicator. The same was done with a 5 mL juice sample. The content of vitamin C was calculated as follows:
Vitamin C = (V1/V2) x C0 x (100/Ws) (mg/100g)
where V1 is volume (mL) of iodine used for the sample, V2 (mL) is volume (mL) of iodine used for the standard, and C0 is concentration of the standard ascorbic acid (mg/mL), Ws is fresh weight equivalent to the 5 mL juice sample used for titration.
Total acidity
The AOAC 942.15 method was used to determine titratable acidity.28 For each analysis, 5 mL of the juice sample was mixed with 20 mL of distilled water. The mixture was titrated with 0.1 N NaOH using 3 drops of 1% phenolphthalein solution prepared in ethanol (60%) as an indicator. Titration was completed when a pale pink appeared and remained visible for around 30 seconds. The total titratable acidity was expressed as % citric acid equivalent.
Evaluation of the PPO and POD activities
Enzyme extract of yacon was obtained by homogenizing 10 g of tubers with 20 mL of 0.05 M phosphate buffer at pH = 7 for 2 min. The mixture was then centrifuged for 13 min at 3500 rpm. The supernatant obtained was the crude enzymatic extract.
Determination of PPO activity: According to Rodrigues ORL, Asquieri ER and Orsi DC,19 the PPO activity was determined by measuring the increase in absorbance at 420 nm at 25°C using a UV-Vis spectrophotometer. The substrate solution included 0.01 M catechol in 0.1 M phosphate buffer, pH = 7.0. Prepare the reaction sample containing 0.1 mL of enzyme extract and 2.9 mL of substrate solution. The blank sample included 0.1 mL of phosphate buffer and 2.9 mL of substrate solution. In a 30˚C water bath, the tube containing the reaction sample was reacted for 5 min. The absorbance was monitored for 5 min at 420 nm, recording the results once every minute. The quantity of enzyme that increased absorbance by 0.001 per minute per milliliter was considered one unit of enzyme activity.19
Determination of POD activity: Based on the test according to the method of Nagle and Hard,29 guaiacol is used as the substrate. Prepare a 2.5 mL reaction sample consisting of: 0.05 mL guaiacol 0.1%, 2.3 mL sodium acetate buffer (pH=6.0), 0.05 mL H2O2 0.1% and 0.1 mL enzyme extract. The blank sample consisted of 0.05 mL of 0.1% guaiacol, 2.3 mL of sodium acetate buffer (pH=6.0), 0.05 mL of 0.1% H2O2. The tube containing the reaction sample was reacted for 5 min in a 30˚C water bath, and the absorbance was measured at 470 nm. POD activity unit was defined as the same as the PPO activity unit.
Color measurement
The surface color of the yacon slice was randomly determined at 3 different points. The color change was measured in the CIE-Lab color system with the three-axis L*, a*, b*. In which, the L* axis represented the lightness with values from black (0) to white (100), the a* axis represented the chroma from green (-120) to red (+120), the b* axis also represented the chroma from blue (-120) to yellow (+120).30
To determine the level of browning during processing, the L*, a*, b* values were used to calculate the browning index according to the following equation30 :
![]()
Statistical analysis
All experiments were performed in five repeated measurements. The data were presented as mean ± standard deviation (SD) and as percentage relative activity. One-way ANOVA was used to determine statistically significant differences with SNK test (p<0.05) by SPSS Statistics 20.
Results
Chemical and physical characteristics of raw yacon tubers
The physical evaluation of raw yacon tubers showed an average length, diameter, and weight of tuber as 20.6 ± 3.6 cm, 7.4 ± 0.8 cm, and 465 ± 107.65 g, respectively (Table 1). The tubers had a high moisture content of 87.43 ± 1.02% and a low titratable acidity of 0.063 ± 0.001%. The reducing sugars and total sugars were 3.79 ± 0.02% and 6.67 ± 0.19%, respectively. The ascorbic acid content was 2.30 ± 0.14 mg/100 g. The total phenolic content averaged 30.67 ± 0.88 mg GAE/100 g, and the DPPH radical scavenging activity was 1475.67 ± 8.65 mg AAE/100 g.
Table 1: Physico-chemical characteristics of raw yacon tubers.
|
Physical characteristics |
Value |
| Length (cm) |
20.6 ± 3.6 |
|
Diameter (cm) |
7.4 ± 0.8 |
| Weight (g) |
465 ± 10.77 |
|
Moisture (%) |
87.43 ± 1.02 |
| Chemical characteristics |
Value |
|
Reducing sugars (%) |
3.79 ± 0.02 |
| Total sugars (%) |
6.67 ± 0.19 |
|
Total phenolic content (mg GAE/100 g) |
30.67 ± 0.88 |
| Vitamin C (mg/100 g) |
2.30 ± 0.14 |
|
Titratable acidity (% citric acid equivalent) |
0.063 ± 0.001 |
| Scavenging activity (mg AAE/100 g) |
1475.67 ± 8.65 |
Effect of citric acid concentration and immersion time on the enzyme activities and the discoloration of yacon tubers
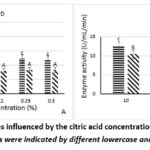 |
Figure 1: PPO and POD activities influenced by the citric acid concentration (A) and immersion time (B). Significant differences in values were indicated by different lowercase and uppercase letters (p<0.05). |
Figure 1 illustrates the activities of PPO and POD during treatment with citric acid at different concentrations and immersion times. POD activity tended to remain lower than PPO activity under all treatment conditions.
Figure 1A demonstrated that the initial PPO and POD activities of raw yacon were 22.00 ± 1.41 U/mL/min and 18.80 ± 1.09 U/mL/min, respectively. After treatment, the activities of both enzymes decreased significantly. At 0.15% citric acid, the enzyme activities decreased to the lowest of 7.60 ± 0.89 U/mL/min for PPO activity and 7.20 ± 1.09 U/mL/min for POD activity, corresponding to a 65.45% and 61.70% decrease in PPO, POD activity compared to the sample treated with 0% citric acid. When the citric acid concentration further exceeded 0.15%, PPO activities tended to slightly increase while no significant differences in POD activities were observed. This suggested that 0.15% citric acid is the optimal concentration for impeding the enzyme activities.
At this concentration, the immersion time was studied. Figure 1B showed that enzyme activities reached their minimum values at 20 min, followed by a slight increase with longer immersion time. Specifically, at 30 min, the PPO and POD activities were 10.4 ± 0.89 U/mL/min and 8.4 ± 0.89 U/mL/min, respectively, representing increases of 26.92% and 14.29% compared to the sample treated for 20 min. Therefore, treatment with 0.15% citric acid for 20 min was identified as the optimal condition for reducing the enzyme activities.
Table 2: Color of yacon tubers influenced by the citric acid concentration and immersion time
|
Sample |
L* | a* | b* | BI |
| Citric acid (0%) | 28.09 ± 0.13a | -0.91 ± 0.07a | 10.66 ± 0.02a |
43.21 ± 0.34e |
|
Citric acid (0.1%) |
35.90 ± 0.09a | -0.23 ± 0.03a | 11.55 ± 0.04b | 36.83 ± 0.18d |
| Citric acid (0.15%) | 37.08 ± 0.08e | -0.26 ± 0.03a | 11.35 ± 0.03a |
34.64 ± 0.18a |
|
Citric acid (0.2%) |
36.60 ± 0.02d | -0.25 ± 0.02a | 11.53 ± 0.02b | 35.91 ± 0.10b |
| Citric acid (0.25%) | 36.07 ± 0.07b | -0.29 ± 0.03a | 11.50 ± 0.04b |
36.31 ± 0.18c |
|
Citric acid (0.3%) |
36.21 ± 0.01c | -0.24 ± 0.04a | 11.50 ± 0.01b |
36.27 ± 0.11c |
|
At 0.15% citric acid |
||||
| Time (min) | L* | a* | b* |
BI |
|
10 |
35.82 ± 0.03b | -0.22 ± 0.03a | 11.54 ± 0.07b | 36.92 ± 0.24c |
| 20 | 37.08 ± 0.08a | -0.26 ± 0.03a | 11.35 ± 0.03a |
34.64 ± 0.18a |
|
30 |
36.55 ± 0.03b | -0.25 ± 0.02a | 11.48 ± 0.03b |
35.78 ± 0.08b |
Within a single column, various superscript letters show significant differences (p < 0.05).
The color parameters under varying citric acid concentration and immersion times were presented in Table 2. The results indicated that untreated yacon slices (0% citric acid) browned quickly with the highest BI value (43.21 ± 0.34). As the citric acid concentration increased, the L* value also increased, indicating higher lightness, while the BI value decreased, suggesting effective inhibition of browning. In addition, the increase in the positive b* value indicated a brighter yellow color. Notably, the sample treated with 0.15% citric acid showed the lowest BI value (34.64 ± 0.18) and the highest L* value, indicating it as the optimal concentration.
The evaluation of immersion times (10, 20, and 30 min) at the chosen concentration showed that 20 min was the most effective duration with the highest L* and the lowest BI value, with significant differences compared to other immersion times. At 30 min, there was a slight decline in L* value and a minor increase in BI value; however, the differences were not substantial. Therefore, treatment with 0.15% citric acid for 20 min was identified as the most effective method to preserve the original color of yacon slices.
Effect of sodium metabisulfite concentration and immersion time on the enzyme activities and the discoloration of yacon tubers
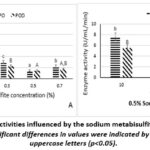 |
Figure 2: PPO and POD activities influenced by the sodium metabisulfite concentration (A) and immersion time (B). Significant differences in values were indicated by different lowercase and uppercase letters (p<0.05). |
In the control sample (0% Na₂S₂O₅), POD activity (18.80 ± 1.09 U/mL/min) was significantly lower than PPO activity (22.00 ± 1.41 U/mL/min). This trend persisted across all treatments, with POD consistently exhibiting a lower activity than PPO when the Na₂S₂O₅ concentration increased. At the concentration of 0.1 and 0.5% Na2S2O5, the PPO and POD enzyme activity was relatively similar.
In general, the treated samples showed a significant reduction in both enzyme activities with the increase of Na₂S₂O₅ concentration (Figure 2A). Notably, at 0.5% Na2S2O5, the activities of the PPO and POD decreased remarkably to 3.6 ± 0.89 U/mL/min. These results were statistically significant in comparison to other concentrations. However, when the concentration was further raised to 0.7%, PPO activity tended to increase slightly (5.6 ± 0.89 U/mL/min), suggesting potential limitations in enzyme inhibition at higher concentrations.
The results of Figure 2B indicated that immersion time also affected the enzyme inhibition efficiency in the tubers. The longer the immersion time resulted in greater the reduction in the PPO activity. In the sample treated with 0.5% Na2S2O5 for 10 min, the activities of PPO and POD were 7.60 ± 0.89 U/mL/min and 5.60 ± 0.89 U/mL/min, respectively. Increasing the immersion time to 20 min, the treatment efficiency was recorded to nearly double, specifically PPO and POD activity were both 3.60 ± 0.89 U/mL/min. However, from 20 min onwards, the enzyme inhibition efficiency was not significantly different. The findings indicated that immersion in a 0.5% Na2S2O5 solution for 20 min was the optimal condition.
The color parameters recorded after 20 min of Na2S2O5 immersion are presented in Table 3. The data showed that treatment by Na2S2O5 can retain the color characteristic of the raw yacon slice.
Table 3: Color of yacon tubers influenced by the sodium metabisulfite concentration and immersion time
|
Samples |
L* | a* | b* | BI |
| Na2S2O5 (0%) | 28.09 ± 0.13a | -0.91 ± 0.07a | 10.66 ± 0.02a |
43.21 ± 0.34d |
|
Na2S2O5 (0.1%) |
37.52 ± 0.03b | -0.56 ± 0.06b | 11.69 ± 0.07b | 34.78 ± 0.29c |
| Na2S2O5 (0.3%) | 38.10 ± 0.08c | -0.46 ± 0.03c | 11.70 ± 0.01b |
34.38 ± 0.07b |
|
Na2S2O5 (0.5%) |
39.41 ± 0.04e | -0.39 ± 0.05c | 11.81 ± 0.03c | 33.54 ± 0.01a |
| Na2S2O5 (0.7%) | 39.05 ± 0.07d | -0.44 ± 0.06c | 11.80 ± 0.03c |
33.79 ± 0.26a |
|
At 0.5% Na2S2O5 |
||||
| Time (min) | L* | a* | b* |
BI |
|
10 |
38.55 ± 0.04a | -0.4 ± 0.11a | 11.78 ± 0.03a | 34.32 ± 0.29b |
| 20 | 39.41 ± 0.04c | -0.39 ± 0.05a | 11.81 ± 0.03a |
33.54 ± 0.01a |
|
30 |
39.18 ± 0.11b | -0.44 ± 0.03a | 11.82 ± 0.04a |
33.71 ± 0.26a |
Within a single column, various superscript letters show significant differences (p < 0.05).
All samples showed an increase in L* value compared to the control sample and a decrease in the BI as the Na2S2O5 treatment concentration increased (Table 3). The sample treated with 0.5% Na2S2O5 recorded the highest value for L* (39.41 ± 0.04) and the lowest BI (33.54 ± 0.01). No significant differences were obtained in the 0.7% sample for L* (39.05 ± 0.07) and the BI (33.79 ± 0.26) compared with 0.5%. Similarly, through the investigation of treatment time at a concentration of 0.5% Na2S2O5, increasing the immersion time from 10 to 20 min improved the color values. Yet, statistical analysis showed that no further enhancement was noted between the 20- and 30-minute immersion. Therefore, based on both enzymatic activity and color retention, the method of immersion in 0.5% Na2S2O5 for 20 min gave the best result in maintaining the color and limiting the enzyme activity of the tubers.
Effect of citric acid in combination with sodium metabisulfite and immersion time on the enzyme activities and the discoloration of yacon tubers
To investigate the synergistic effect of sodium metabisulfite and citric acid, the optimal concentration of citric acid (0.15%) while gradually reducing the concentration of Na2S2O5 (0.5%, 0.3%, 0.1%, 0%). Once the optimal concentration of Na2S2O5 based on the enzyme activity inhibition was determined, further experiments was conducted to identify the ideal immersed times (5, 10, 15, 20 min) for processing yacon tubers.
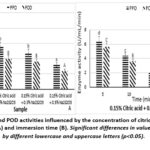 |
Figure 3: PPO and POD activities influenced by the concentration of citric acid and sodium metabisulfite (A) and immersion time (B). Significant differences in values were indicated by different lowercase and uppercase letters (p<0.05). |
The results of Figure 3 demonstrated that enzyme activities declined gradually when the concentration of Na2S2O5 increased. The combination of 0.5% Na2S2O5 and 0.15% citric acid was identified as the most effective treatment ratio. At this concentration, the enzyme activities decreased to the lowest of 3.20 ± 1.10 U/mL/min for PPO activity and 2.40 ± 0.89 U/mL/min for POD activity. In comparison to the individual treatments of citric acid (Figure 1A) and Na2S2O5 (Figure 2A), using combinations of chemical agents brought superior inhibitory effects. PPO and POD activities were reduced by 5.60 ± 0.89 and 4.00 ± 0.00 U/mL/min, respectively, at 0.1% Na2S2O5 concentration; and enzyme activities were reduced by 4.80 ± 1.10 and 3.60 ± 0.89 U/mL/min, respectively, at 0.3% Na2S2O5 concentration.
Subsequently, at the optimal chemical combination (0.5% Na₂S₂O₅ + 0.15% citric acid), different immersion durations were investigated. As illustrated in Figure 3B, 15-min immersion was the most effective time to inhibit the PPO and POD enzyme activity, representing a relatively similar value, at 2.00 ± 0.00 U/mL/min. They were reduced by roughly 90% compared to the control sample. The enzyme activities decreased to 6.40 ± 0.89 in PPO and 5.60 ± 0.89 U/mL/min in POD at 5 min, followed by a further reduction to 4.40 ± 0.89 in PPO and 3.60 ± 0.89 U/mL/min in POD at 10 min. At 20 min, the enzyme activities reached 3.20 ± 1.10 and 2.40 ± 0.89 U/mL/min, in terms of PPO and POD, respectively. Across all treatments, POD activity tended to remain consistently lower than PPO activity.
Table 4: Color of yacon tubers influenced by the concentration of citric acid and sodium metabisulfite and immersion time
|
Sample |
L* | a* | b* | BI |
| Citric acid (0.15%)
+ Na2S2O5 (0%) |
37.08 ± 0.08a | -0.26 ± 0.03c | 11.35 ± 0.03a |
34.64 ± 0.18c |
| Citric acid (0.15%)
+ Na2S2O5 (0.1%) |
39.04 ± 0.13a | -0.42 ± 0.07ab | 11.78 ± 003a | 33.75 ± 0.22b |
| Citric acid (0.15%)
+ Na2S2O5 (0.3%) |
39.37 ± 0.13b | -0.37 ± 0.03b | 11.81 ± 0.03a |
33.63 ± 0.24b |
|
Citric acid (0.15%) + Na2S2O5 (0.5%) |
41.16 ± 0.11a | -0.46 ± 0.02a | 11.91 ± 0.03b |
32.04 ± 0.18a |
|
At 0.15% citric acid and 0.5% Na2S2O5 |
||||
| Time (min) | L* | a* | b* |
BI |
|
5 |
38.34 ± 0.09a | -0.81 ± 0.06a | 11.90 ± 0.14a | 34.11 ± 0.58d |
| 10 | 40.23 ± 0.05b | -0.36 ± 0.03b | 11.96 ± 0.03ab |
33.28 ± 0.14c |
|
15 |
43.30 ± 0.16d | -0.42 ± 0.02b | 12.07 ± 0.09b | 30.75 ± 0.34a |
| 20 | 41.16 ± 0.11c | -0.46 ± 0.02b | 11.91 ± 0.03a |
32.04 ± 0.18b |
Within a single column, various superscript letters show significant differences (p < 0.05).
Corresponding color attributes, compared with the sample treated with 0.15% citric acid for 20 min, the b* value of the combined chemical treatment showed a tendency to gradually enhance the yellow color of yacon slices. Conversely, the L* value was higher and the BI value was lower, indicating the combined treatment samples were lighter and less brown in color.
As summarized in Table 4, it can be seen that the color of yacon slices was moderately impacted by the immersion time. The optimal time was 15 min, producing the most favorable color outcomes, with the highest L* value (43.30 ± 0.16) and the lowest BI value (30.75 ± 0.34). This result was consistent with the enzyme activities in Figure 3B. These indicators showed a considerable improvement in comparison with the sample treated with 0.15% citric acid only.
Discussion
Chemical and physical characteristics of raw yacon tubers
The physico-chemical characteristics and antioxidant properties of raw yacon tubers are shown in Table 1. Regarding the physical properties analysis, the yacon tubers’ average dimensions of length, diameter, and weight recorded in this study were notably higher than the results for yacon cultivated in Nauni, Solan, India (as 12.15 ± 1.38 cm, 3.39 ± 0.53 cm, 131.2 ± 26.83 g, respectively).21 Comparing the moisture attribute of raw yacon tubers, a significantly higher moisture content was observed in this study (87.43%) than the findings of Lago CC 20 and Gangta R 21 (corresponding to 81.70 and 83.33%). Similarly, the total titratable acidity of yacon was slightly higher, with 0.063% citric acid equivalent, as opposed to those obtained by Prati P 31 (0.05%). These minor discrepancies may be attributed to the plants’ age, cultivation altitude, harvesting time, environmental conditions, and soil moisture at the growing site. Meanwhile, the values of vitamin C (2.30 mg/100g), reducing sugar (3.79%), and total sugar content (6.67%) in this research is generally consistent with the previous published studies. 3,6,21,31 According to Gangta R 21 and Prati P 31; the yacon tubers presented a relatively similar vitamin C value (2.20 mg/100g) and reducing sugar content (3.94%) with a mildly higher total sugar content (7.86%). The literature has highlighted that yacon’s elevated moisture content contributed to its perishability, while its significant levels of phenolics and sugars, combined with low acidity, enhanced its susceptibility to enzymatic browning processes.
The chemical analysis indicated that yacon tubers had a TPC of 30.67 ± 0.88 mg GAE/100 g and a DPPH free radical scavenging capacity of 1475.67 ± 8.65 mg AAE/100 g. These values demonstrated that yacon was a rich source of natural antioxidants, with levels comparable to or exceeding those found in several commonly consumed fruits. Specifically, TPC in apples ranged from about 377 to 839 mg GAE/100 g fresh, pears from 6.4 – 17.7 mg GAE/100 g, and ripe bananas from 42 – 54 mg GAE/100 g, depending on the variety.33–35
In addition, the relatively high total sugar and reducing sugar content (6.67 ± 0.19% and 3.79 ± 0.02%) also reflected the potential for outstanding biological value. In particular, total sugar included a substantial number of FOS, a functional carbohydrate with prebiotic effects. Meanwhile, reducing sugar, primarily glucose and fructose, contributed to a natural sweetness, was easy to absorb, and was favorable for fermentation-based applications. The characteristics of yacon have emphasized its potential, which is not only limited to a prebiotic source but also has high antioxidant properties and natural sweetness, supporting its application in the development of nutritious functional food products, such as syrup, fermented drinks, or jam.36,37
Effect of citric acid concentration and immersion time on the enzyme activities and the discoloration of yacon tubers
According to Figure 1, it is observed that POD activity was consistently lower than PPO activity in all treatments, which aligns with the role of PPO as the primary enzyme responsible for the browning process. PPO catalyzed phenolic compounds in the presence of oxygen through the o-hydroxylation reaction to form o-quinone, which had a distinctive brown color. POD also contributed to browning; however, its activity depends on the presence of hydrogen peroxide (H₂O₂), an essential substrate for POD oxidizes phenols to quinones. Notably, some studies suggest that these enzymes may function synergistically. While PPO directly oxidizes phenolic compounds using readily available oxygen in the tuber tissue, especially after mechanical damage, POD requires H₂O₂, by-products of the PPO-catalyzed oxidation reactions. This functional relationship helps explain the consistently higher PPO activity compared to POD observed in this study and may accelerate browning reactions, leading to more pronounced browning effects. 38
With individual treatments, citric acid was used to form complexes with metal cations (copper) presented in the active sites of PPO, POD and maintain the pH (pH<3) below the optimal value for the catalytic activity of these enzymes.19,39 The treatment using 0.15% citric acid for 20 min was demonstrated as the most effective method to retain the original color of yacon tubers. This result is consistent with those found by Gangta R, 21 which showed that yacon powder treated with 0.15% citric acid for 20 min retained the best color and flavor characteristics.
When the citric acid concentration and immersion time were further increased beyond 0.15% and 20 min, respectively, cellular damage may occur, which could result in a slight increase of enzyme activities and partial offset of browning inhibitory. During shorter treatment (in the range of 0 to 20 min), citric acid primarily acted on the cell surface and the outer cell layers, lowering the surface pH and inhibiting PPO, POD activity. However, with prolonged exposure, citric acid can penetrate deeper into the cells, reducing the intracellular pH, denaturing membrane proteins and causing disruption of the cell membrane and vacuolar membrane.40 Consequently, PPO enzymes in plastids may be released, allowing direct contact with phenolic substrates in the vacuoles, leading to increased enzyme activity and browning index.
Effect of sodium metabisulfite concentration and immersion time on the enzyme activities and the discoloration of yacon tubers
According to Rodrigues ORL, Asquieri ER and Orsi DC,19 the color change in yacon tubers was related to the activity of endogenous polyphenol oxidase and peroxidase enzymes and the content of phenolic compounds. As illustrated in Figure 2 and Table 3, a clear correlation was observed between the browning index and PPO and POD enzyme activity. Specifically, the higher the PPO activity, the greater the increase in BI value. This supported the mechanism in PPO and POD catalyzed the oxidation of phenolic substrates to unstable quinones, which then polymerized into brown or black pigments. The accumulation of these pigments results in an increasing value in browning intensity. The more of these pigments formed, the higher the browning index was measured.41
The findings of this study, presented in Figure 2 has demonstrated that treating yacon tuber slices with 0.5% Na₂S₂O₅ for 20 min effectively inhibited enzymatic browning. This was evidenced by the significant reduction in the activities of PPO and POD by 84% and 81% compared to the control, respectively. Concurrently, the 0.5% Na₂S₂O₅ treated slices exhibited the highest L* value and lowest BI value, as shown in Table 3, indicating the optimal treatment. This is consistent with the study of Krishnan JG and Padmaja G 16 where the 0.5% concentration of Na2S2O5 treatment on yam flour has significantly enhanced brightness and reduced browning index, compared to the 0.25 and 1.00% concentration.
The enzymatic browning inhibition was explained by Na2S2O5’s strong antioxidant properties. When dissolved in water, Na₂S₂O₅ generates sulfurous acid (H₂SO₃) and sulfite ions (SO₃²⁻). While H₂SO₃ reduced the pH value below the optimal range for the catalytic activity of PPO and POD enzymes, 19 sulfite ions acted as a reducing agent, preventing the enzymatic oxidation of phenolic compounds. In more specific terms, this compound blocks oxidation by reacting with o-quinones to convert them back into phenolic form, preventing colored pigment formation. 15 In addition, sulfite consumed dissolved oxygen and reacted directly with H₂O₂ to form sulfate (SO₄²⁻), thereby depleting oxygen and H₂O₂ needed for PPO and POD activity. 14
Moreover, it can be observed that POD activity remained consistently lower than PPO activity across all treatments. As mentioned above, Na₂S₂O₅ acts as a potent antioxidant that disrupts the oxidation reactions of both PPO and POD by competing with oxygen (needed by PPO) and H₂O₂ (required by POD). However, the limited availability of H₂O₂ in yacon tubers’ tissues may explain the consistently lower POD activity. Supporting these findings, a previous study on banana slices indicated that the 0.1% Na₂S₂O₅ solution inhibited 92.60% of PPO and 76.04% of POD after 10 min, whereas 96.74% PPO and 87.50% POD inhibition occurred by increasing the concentration to 0.2%. 45 Both treatments showed more pronounced inhibition of PPO activity than POD. This aligns with the findings in this study on yacon tubers, where Na₂S₂O₅ also exhibited a stronger inhibitory effect on PPO than POD.
Effect of citric acid in combination with sodium metabisulfite and immersion time on the enzyme activities and the discoloration of yacon tubers
To date, in addition to conventional heat treatment methods, researchers have paid much attention to the use of chemical agents—such as organic acids (tartaric acid, citric acid, malic acid, oxalic acid and ascorbic acid), sodium metabisulfite, potassium metabisulfite, L-cysteine, EDTA —to control enzymatic browning in fruits and vegetables. Different chemical agents affected enzymes’ activity through a distinct mode of action, and application of a mixture of these agents created a synergistic effect, resulting in more efficient inhibition of enzymes and improvement of color retention, while reducing the physicochemical alterations and sensory deterioration of fresh-cut products.
The effectiveness of the combination of these agents has been documented on a variety of fruit and vegetable products. For example, ascorbic acid (AA) and sodium metabisulfite (SMB) significantly inhibited the browning process in minimally processed apples, which was confirmed to be superior to ascorbic acid alone (Cort WR et al. 46), while their combined use was also shown to be effective in reducing enzymatic browning in potatoes at a ratio of 0.25% SMB +0.25% AA (Nascimento RFD and Canteri MHG, 2019 39). Similarly, treatments with sodium metabisulfite and citric acid (CA) prolonged the shelf life and improved the color retention of sweet potatoes treated with 2% SMB adjusted to pH 2.91 with CA (Sgroppo SC, Vergara LE, Tenev MD 47), and chilli treated at 0.3% SMB + 1% CA suggested a positive effect on preserving color and functional components including ascorbic acid, carotenoids and phenolics (Chaethong K and Pongsawatmanit R 42), while banana powder reported a ratio of 0.1% SMB + 0.5% CA to be more effective in browning inhibitory but still retention of the physico-chemical properties compared to using SMB alone (Kamal MM, Ove TA et al. 48). These findings suggest that the optimal concentrations and ratios of chemical agents vary depending on the characteristics of each food. Therefore, it is necessary to study and tailor processing strategies according to the specific tissue structure and enzymatic characteristics of each product.
In the study of Gangta R, Thakur NS, Hamid, Gautam S, Thakur A, 21 the role of 3% citric acid and 0.5% sodium metabisulfite was independently examined on minimally processed yacon. Both agents were found to exhibit strong inhibition of browning enzyme activity (POD). However, the findings revealed that citric acid was more effective in preserving color (L* values), texture, and physicochemical stability and possessed higher sensory scores, while sodium metabisulfite received lower sensory acceptability due to the sulfurous off-flavor. However, the research paper did not investigate the combination of these agents, therefore, leaving a gap in evaluating whether synergistic effects might improve browning inhibitory while reducing undesirable sensory effects.
Addressing this gap, the present study emphasized yacon tubers with the combination treatment of chemical agents. It was demonstrated from Figures 1 and 2 that both citric acid and sodium metabisulfite were effective in inhibiting the browning of yacon slices by significantly impeding the activity of PPO and POD. Moreover, their simultaneous application showed greater inhibitory effects, as they reduced the enzyme activity up to 90% with 0.5% Na₂S₂O₅ + 0.15% citric acid treatment, illustrated in Figure 3. Besides, the optimal immersion time was shortened to 15 min compared with using each agent individually (at 20 min), demonstrating the improved effectiveness in industrial utilization. As shown in Table 4, the highest L* value and the lowest BI value were obtained with this combination ratio, proving a clear correlation between the browning index and PPO and POD enzyme activity. These findings support the synergistic role of these agents and establish an effective, non-thermal approach to maintaining the postharvest quality of yacon tubers.
Conclusion
This study evaluated the effectiveness of inhibitors in preventing enzymatic browning and maintaining the color of yacon. The results showed that the treatment method of immersing yacon slices in 0.15% citric acid or 0.5% sodium metabisulfite for 20 min was efficient in controlling browning caused by PPO and POD. However, the most effective method was achieved by immersing yacon slices in a solution of 0.15% citric acid and 0.5% sodium metabisulfite for 15 min. Future studies may focus on developing bioactive products from yacon, such as FOS-rich juice or syrup, after treating yacon slices with a combination of citric acid and sodium metabisulfite, based on the findings. These products may benefit patients suffering from chronic diseases such as diabetes and obesity.
Acknowledgement
The authors gratefully acknowledge Hanoi University of Science and Technology (HUST) for facilitating this study and the research team for their support.
Funding Sources
The authors received no financial support for the research, authorship, and/or publication of this article.
Conflict of Interest
The authors do not have any conflict of interest.
Data Availability Statement
This statement does not apply to this article.
Ethics Statement
This research did not involve human participants, animal subjects, or any material that requires
ethical approval.
Informed Consent Statement
This study did not involve human participants, and therefore, informed consent was not required.
Clinical Trial Registration
This research does not involve any clinical trials.
Permission to Reproduce Material from Other Sources
Not Applicable
Author Contributions
- Nguyen Thi Hanh: Data Collection, Data Curation, Validation, Writing (Original Draft, Review, Editing)
- Nguyen Hoang An: Data Collection, Data Curation
- Le Thi Thanh Nga: Data Collection, Writing
- Pham Phuong Thanh: Data Collection, Writing
- Nguyen Van Hung: Review
- Vu Thu Trang: Conceptualization
References
- Ojansivu I, Ferreira CL, Salminen S. Yacon, a new source of prebiotic oligosaccharides with a history of safe use. Trends Food Sci Technol. 2011;22(1):40-46. doi:10.1016/j.tifs.2010.11.005
CrossRef - Yan MR, Welch R, Rush EC, Xiang X, Wang X. A sustainable wholesome foodstuff; health effects and potential dietotherapy applications of yacon. Nutrients. 2019;11(11). doi:10.3390/nu11112632
CrossRef - Respondek F, Gerard P, Bossis M, Boschat L, Bruneau A, Rabot S, Wagner A, Martin JC. Short-Chain Fructo-Oligosaccharides Modulate Intestinal Microbiota and Metabolic Parameters of Humanized Gnotobiotic Diet Induced Obesity Mice. PLoS One. 2013;8(8). doi:10.1371/journal.pone.0071026
CrossRef - Cao Y, Ma ZF, Zhang H, Jin Y, Zhang Y, Hayford F. Phytochemical propertiess and nutrigenomic implications of yacon as a potential source of prebiotic: Current evidence and future directions. Foods. 2018;7(4). doi:10.3390/foods7040059
CrossRef - Silva DMN, Lima RR, Oliveira FL, Teixeira LJQ, Machado LCA. Physical and chemical characterization of yacon tuberous roots at different altitudes and planting times. Hortic Bras. 2018;36(2):199-204. doi:10.1590/s0102-053620180209
CrossRef - Campos D, Betalleluz-Pallardel I, Chirinos R, Aguilar-Galvez A, Noratto G, Pedreschi R. Prebiotic effects of yacon (Smallanthus sonchifolius Poepp. & Endl), a source of fructooligosaccharides and phenolic compounds with antioxidant activity. Food Chem. 2012;135(3):1592-1599. doi:10.1016/j.foodchem.2012.05.088
CrossRef - Machado AM, da Silva NBM, Chaves JBP, Alfenas R de CG. Consumption of yacon flour improves body composition and intestinal function in overweight adults: A randomized, double-blind, placebo-controlled clinical trial. Clin Nutr ESPEN. 2019;29:22-29. doi:10.1016/j.clnesp.2018.12.082
CrossRef - Habib NC, Honoré SM, Genta SB, Sánchez SS. Hypolipidemic effect of Smallanthus sonchifolius (yacon) roots on diabetic rats: Biochemical approach. Chem Biol Interact. 2011;194(1):31-39. doi:10.1016/j.cbi.2011.08.009
CrossRef - da Silva Almeida AP, Avi CM, Barbisan LF, de Moura NA, Caetano BFR, Romualdo GR, Sivieri K. Yacon (Smallanthus sonchifolius) and Lactobacillus acidophilus CRL 1014 reduce the early phases of colon carcinogenesis in male Wistar rats. Food Res Int. 2015;74:48-54. doi:10.1016/j.foodres.2015.04.034
CrossRef - Habib NC, Serra-Barcellona C, Honoré SM, Genta SB, Sánchez SS. Yacon roots (Smallanthus sonchifolius) improve oxidative stress in diabetic rats. Pharm Biol. 2015;53(8):1183-1193. doi:10.3109/13880209.2014.970285
CrossRef - Raman M, Ambalam P, Kondepudi KK, Pithva S, Kothari C, Patel AT, Purama RK, Dave JM, Vyas BR. Potential of probiotics, prebiotics and synbiotics for management of colorectal cancer. Gut Microbes. 2013;4(3):181-192. doi:10.4161/gmic.23919
CrossRef - de Moura NA, Caetano BFR, Sivieri K, Urbano LH, Cabello C, Rodrigues MAM, Barbisan LF. Protective effects of yacon (Smallanthus sonchifolius) intake on experimental colon carcinogenesis. Food Chem Toxicol. 2012;50(8):2902-2910. doi:10.1016/j.fct.2012.05.006
CrossRef - Scheid MMA, Genaro PS, Moreno YMF, Pastore GM. Freeze-dried powdered yacon: effects of FOS on serum glucose, lipids and intestinal transit in the elderly. Eur J Nutr. 2014;53(7):1457-1464. doi:10.1007/s00394-013-0648-x
CrossRef - Arora S, Siddiqui S, Gehlot R, Ahmed N. Effects of Anti-Browning Pretreatments on Browning of Banana Pulp. Int J Curr Microbiol Appl Sci. 2018;7(04):242-249. doi:10.20546/ijcmas.2018.704.027
CrossRef - Lim WY, Wong CW. Inhibitory effect of chemical and natural anti-browning agents on polyphenol oxidase from ginger (Zingiber officinale Roscoe). J Food Sci Technol. 2018;55(8):3001-3007. doi:10.1007/s13197-018-3218-7
CrossRef - Krishnan JG, Padmaja G, Moorthy SN, Suja G, Sajeev MS. Effect of pre-soaking treatments on the nutritional profile and browning index of sweet potato and yam flours. Innov Food Sci Emerg Technol. 2010;11(2):387-393. doi:10.1016/j.ifset.2010.01.010
CrossRef - Canino L, Boudboud A, Aziz M, M’barek HN, Hajjaj H, Lhoussain H, Meulenaer BD, Mazouz H. Effect of Pretreatment and Process Parameters on the Chemical and Biochemical Properties of Moroccan Apricots (Prunus armeniaca L. Var. Canino). J Food Chem Nanotechnol. 2023;9(3):113-123. doi:10.17756/jfcn.2023-157
CrossRef - Holderbaum DF, Kon T, Kudo T, Guerra MP. Enzymatic Browning, Polyphenol Oxidase Activity, and Polyphenols in Four Apple Cultivars: Dynamics during Fruit Development. Dynamics during Fruit Development. HortScience. 2025; 45(8):1150-1154. doi:10.21273/HORTSCI.45.8.1150
CrossRef - Rodrigues ORL, Asquieri ER, Orsi DC. Prevention of enzymatic browning of yacon flour by the combined use of anti-browning agents and the study of its chemical composition. Food Sci Technol. 2014;34(2):275-280. doi:10.1590/fst.2014.0045
CrossRef - Lago CC, Bernstein A, Brandelli A, Noreña CZ. Characterization of Powdered Yacon (Smallanthus sonchifolius) Juice and Pulp. Food Bioprocess Tech. 2012;5(6):2183-2191. doi:10.1007/s11947-011-0617-4
CrossRef - Gangta R, Thakur NS, Hamid, Gautam S, Thakur A. Optimization of pre-drying treatment and drying mode for reducing browning to produce shelf stable fructooligosaccharide rich yacon (Ground Apple) powder. S Afr J Bot. 2023;157:96-105. doi:10.1016/j.sajb.2023. 03.051
CrossRef - Vieira NM, Dionisio AP, De Souza Goes T, Da Silva Araújo IM, De Figueiredo RW. Optimization of the acid treatment of yacon for the inactivation of polyphenoloxidase with maintenance of the functional properties. Braz J Food Technol. 2018;21. doi:10.1590/1981-6723.06316
CrossRef - Association of Official Analytical Chemist (AOAC). Official Methods of Analysis. 18th edition. AOAC International, Washington DC. 2010.
- Gusakov A V, Kondratyeva EG, Sinitsyn AP. Comparison of Two Methods for Assaying Reducing Sugars in the Determination of Carbohydrase Activities. Int J Anal Chem. 2011;2011:1-4. doi:10.1155/2011/283658
CrossRef - Obanda M, Owuor PO, Taylor SJ. Flavanol Composition and Caffeine Content of Green Leaf as Quality Potential Indicators of Kenyan Black Teas. Sci Food Agri. 1997;74(2):209-215. doi:10.1002/(SICI)1097-0010(199706)74:2<209::AID-JSFA789>3.0.CO;2-4
CrossRef - Koudoro YA, Agbangnan DCP, Yèhouénou B, Tchobo FP, Alitonou GA, Avlessi F, Akoègninou A, Sohounhloué KCD. Chemical characterization and biological activities of extracts from two plants (Cissus quadrangularis and Acacia polyacantha) used in veterinary medicine in Benin. J Pharmacogn Phytochem. 2015;3(6):91-96.
- Nweze CC, Erhabor OG, Nweze CC, Abdulganiyu MG, Erhabor OG. Comparative analysis of vitamin C in fresh fruits juice of Malus domestica, Citrus sinensi, Ananas comosus and Citrullus lanatus by iodometric titration. Int J Sci Environ Technol. 2019;4(1):17-22.
- Association of Official Analytical Chemist (AOAC). Official Methods of Analysis. 18th edition. AOAC International, Gaithersburg. 2005: Method 942.05.
- Saengnil K, Chumyam A, Faiyue B, Uthaibutra J. Use of chlorine dioxide fumigation to alleviate enzymatic browning of harvested “Daw” longan pericarp during storage under ambient conditions. Postharvest Biol Technol. 2014;91:49-56. doi:10.1016/j.postharvbio. 2013.12.016
CrossRef - Suyatma N, Prangdimurti E. Effect of blanching and pectin coating as pre-frying treatments to reduce acrylamide formation in banana chips. Int Food Res J. 2015;22(3):936-942.
- Prati P, Berbari SAG, Pacheco MTB, Da Silva MG, Nacazume N. Estabilidade dos componentes funcionais de geleia de yacon, goiaba e acerola, sem adição de açúcares. Braz J Food Technol. 2010;12(04):285-294. doi:10.4260/bjft2009800900023
CrossRef - Khajehei F, Merkt N, Claupein W, Graeff-Hoenninger S. Yacon (Smallanthus sonchifolius Poepp. & Endl.) as a novel source of health promoting compounds: Antioxidant activity, phytochemicals and sugar content in flesh, peel, and whole tubers of seven cultivars. Molecules. 2018;23(2). doi:10.3390/molecules23020278
CrossRef - Ssonko UL, Muranga FI. Phenolic compounds identification and antioxidant activity in bananas of AAB and ABB genomes grown in Uganda. Br J Res. 2020;4(2):17. doi:10.21767/2577-0586.4.2.17
- Piluzza G, Campesi G, D’hallewin G, Molinu MG, Re GA, Sanna F, et al. Antioxidants in fruit fractions of Mediterranean ancient pear cultivars. Molecules. 2023;28(8). doi:10.3390/molecules28083559
CrossRef - Gavrilă MF, Vijan LE, Cosmulescu S. Biochemical profile and antioxidant activity of fresh fruits from apple genotypes. Appl Sci (Switzerland). 2025;15(5). doi:10.3390/app15052534
CrossRef - de Almeida Paula HA, Abranches MV, de Luces Fortes Ferreira CL. Yacon (Smallanthus sonchifolius): a food with multiple functions. Crit Rev Food Sci Nutr. 2015;55(1):32-40. doi:10.1080/10408398.2011.645259
CrossRef - Pereira MF, de Codes Soares I, Cabral MM, de Freitas PA, Sousa GMA, Magalhães SC, et al. Impacts of yacon syrup (Smallanthus sonchifolius) on human health: a systematic review of scientific evidence from the last decade. Nutrients . 2025;17(5). doi:10.3390/nu17050888
CrossRef - Xiao L, Huang H, Liu W, Li X, Zhao J, Liang S, Guan Q, Yan H, Wang X, Chen Y. Integrated transcriptome and proteome analysis reveals the regulatory mechanisms of citric acid and L-cysteine treatment in mitigating browning and senescence of postharvest litchi fruit. LWT. 2025;221. doi:10.1016/j.lwt.2025.117604
CrossRef - Vasconcelos CM, de Oliveira EB, Rossi SN, Arantes LF, Puschmann R, Chaves JBP. Evaluating strategies to control enzymatic browning of minimally processed yacon (Smallanthus sonchifolius). Food Bioprocess Tech. 2015;8(9):1982-1994. doi:10.1007/s11947-015-1558-0
CrossRef - Bhushan B, Kumar S, Mahawar MK, Jalgaonkar K, Dukare AS, Bibwe B, Meena VS, Negi N, Narwal RK, Pal A. Nullifying phosphatidic acid effect and controlling phospholipase D associated browning in litchi pericarp through combinatorial application of hexanal and inositol. Sci Rep. 2019;9(1). doi:10.1038/s41598-019-38694-5
CrossRef - Limbaga JC, Esguerra EB, Castillo-Israel KAT. Enzymatic browning and chemical composition of whole yacon [Smallanthus sonchifolius (Poepp.) H. Rob.] tubers as affected by blanching. Food Res. 2020;4(5):1554-1562. doi:10.26656/fr.2017.4(5).107
CrossRef - Chaethong K, Pongsawatmanit R. Influence of sodium metabisulfite and citric acid in soaking process after blanching on quality and storage stability of dried chili. J Food Process Preserv. 2015;39(6):2161-2170. doi:10.1111/jfpp.12460
CrossRef - Liang YS, Chen NL, Ke LS. Influence of dipping in sodium metabisulfite on pericarp browning of litchi cv. Yu Her Pau (Feizixiao). Postharvest Biol Technol. 2012;68:72-77. doi:10.1016/j.postharvbio.2012.02.005
CrossRef - do Nascimento RF, Canteri MHG. Use of sodium metabisulfite and ascorbic acid as anti-browning agents in processed potatoes. Br Food J. 2020;122(2):380-389. doi:10.1108/BFJ-05-2019-0322
CrossRef - Ibrahim W, Elmoniem GA, Eissa H, Saad S, El-Aleem IA, Helmy A. Effect of thermal and chemical pre-treatments on oxidative enzyme activities of banana and apple slices. J Food Dairy Sci. 2008;33(11):7923-7931. doi:10.21608/jfds.2008.125174
CrossRef - Cort WR, Bece AM, So JM, F GG. Effect of L-ascorbic acid and sodium metabisulfite in the inhibition of the enzymatic browning of minimally processed apple. Int J Agric Res. 2008;3(3):196-201. doi:10.3923/ijar.2008.196.201
CrossRef - Sgroppo SC, Vergara LE, Tenev MD. Effects of sodium metabisulphite and citric acid on the shelf life of fresh cut sweet potatoes. Span J Agric Res. 2010;8(3):686-693. doi:10.5424/sjar/2010083-1266
CrossRef - Kamal MM, Ove TA, Saifullah SB, Haque MR. Effects of citric acid and potassium metabisulphite pre-treatment on the physical and biochemical properties of dehydrated Amritsagar banana powder. Trends Sci. 2022;19(5):2893. doi:10.48048/tis.2022.2893
CrossRef
Abbreviations List
|
AA |
: Ascorbic acid |
|
AAE |
: Ascorbic Acid Equivalent |
| AOAC |
: Association of Official Analytical Chemists |
|
BI |
: Browning index |
| CA |
: Citric acid |
|
DNS |
: 3,5-Dinitrosalicylic acid |
| DPPH |
: 2,2-diphenyl-1-picrylhydrazyl |
|
F-C |
: Folin-Ciocalteu |
| FOS |
: Fructooligosaccharides |
|
GAE |
: Gallic acid equivalence |
| L* |
: Lightness |
|
POD |
: Peroxidase |
| PPO |
: Polyphenoloxidase |
|
SD |
: Standard deviation |
| SMS |
: Sodium metabisulfite |
|
TPC |
: Total phenolic content |
Accepted on: 21 Jun 2025
Second Review by: Aji Sukoco
Final Approval by: Dr. Nikhil Mahnot


Web of Science Coverage
Emerging Sources Citation Index (ESCI)
2024 Journal Impact Factor: 1.1
Scopus Journal Metrics
CiteScore 2024: 1.9
CiteScore Details
Sustainable Nutrition: Food Systems, Nutrient Retention, and Public Health Impact
![]()
This journal is a member of, and subscribes to the principles of, the Committee on Publication Ethics (COPE)


