Assessment of Grain Handling, Consumption and Risk of Exposure to Aflatoxins Among Adolescents in Secondary Schools Using Urinary Aflatoxin M1 Biomarker
 , Sylvester Tembaand Neema Kassim
 School of Life Science and Bioengineering, The Nelson Mandela African Institution of Science and Technology, Arusha, Tanzania.
Corresponding Author E-mail: madoshif@nm-aist.ac.tz
DOI : http://dx.doi.org/10.12944/CRNFSJ.13.2.10
Download this article as:
![]()
Aflatoxin contamination poses a significant public health concern, particularly in low-resource settings where dietary habits and food handling practices increase exposure risks to vulnerable populations. This study examined grain handling, consumption and the risk of exposure to aflatoxin among secondary school adolescents in Mvomero District, Morogoro-Tanzania. The study used a descriptive cross-sectional design employing stratified multistage proportionate sampling to obtain 396 secondary school adolescents and a non-probability, purposive sampling to obtain 33 teachers responsible for school meals from 33 schools. Data were collected using surveys, food frequency questionnaires and 24-hour dietary recalls. Urinary Aflatoxin M1 (AFM1) was analyzed using Enzyme-Linked Immunosorbent Assay (ELISA). The study was conducted across secondary schools in Mvomero district in Morogoro region of Tanzania, between February and May 2024. The findings revealed high aflatoxin exposure among secondary school adolescents in Mvomero District, Tanzania, with a median urinary AFM1 level of 0.035 ng/mL (IQR = 0.07 ng/mL), exceeding the hepatocellular cancer risk threshold of 0.0036 ng/mL. Higher AFM1 concentrations were significantly associated with the consumption of aflatoxin-susceptible grains (p < .05) and were notably higher in younger adolescents (0.039 ng/mL) than older ones (0.024 ng/mL; p = .04). Poor grain handling practices contributed to this exposure, as 96.9% of schools stored grains in non-protective polypropylene bags. Additionally, meals lacked diversity with 93.8% of schools relying mainly on maize and all using beans. Although a national school feeding guideline exists, none of the schools have begun its implementation, indicating a lack of enforcement. These results underscore the dual influence of diet and age on aflatoxin exposure and call for urgent interventions, including improved grain storage, enhanced public awareness, dietary diversification, and enforcement of school feeding policies to mitigate health risks in this vulnerable population.
KEYWORDS:Adolescents; Aflatoxin M1; ELISA; Exposure; School feeding; Urinary biomarker
Introduction
Food safety is a global concern, as contaminated food is estimated to cause various foodborne diseases to 600 million people globally,1 resulting in about 2.2 million deaths in developing countries annually.2 Among many causes of foodborne diseases are harmful toxins, including aflatoxins (AFs). In developing countries such as Tanzania, frequent exposure to high levels of toxic fungal metabolites such as AFs is common and poses significant health risks, especially to developing adolescents.3 Acute exposure to AF can lead to potentially fatal aflatoxicosis4 while chronic exposure to aflatoxins can lead to liver cancer, birth defects, immune suppression, impaired growth and development and protein-energy malnutrition.5–7 Due to the ubiquitous nature of aflatoxins-producing fungi, they contaminate a wide array of food crops and dietary staples, during planting, harvesting and post-harvest handling at different stages including drying, storage, transportation and processing.8 Maintaining food safety is relatively ineffective as food systems (FSs) are poor.9 Inspections are normally done after acute outbreaks6 but not as a proactive measure to prevent contamination and/or exposure. In developing countries, food systems are characterized by weak regulatory mechanisms to monitor both contamination and exposure along the food chain and the inability to enforce required AF standards.6
In Tanzania, the implementation of the Fee-Free Basic Education Policy of 2016 led to the initiation of the Secondary Education Quality Improvement Project (SEQuIP) to tackle issues of access, quality, and equity in secondary education.10 Among its various initiatives, SEQuIP mandated the provision of school meals in both day and boarding secondary schools through school feeding programs (SFPs). While this policy aimed to support student growth and learning, it did not address the critical aspects of sourcing and quality of food materials, particularly concerning their safety and nutritional value.11 School feeding programs lack surveillance and routine food safety testing, relying on monotonous feeding of maize-based foods, which are highly susceptible to aflatoxins.3,5,12 Notably, maize, the primary staple food in Tanzanian schools, largely obtained by material contributions and parent-funded purchases, is often of low quality with unknown safety status,9 potentially increasing the risk of aflatoxin exposure among adolescents. Secondary school adolescents experience rapid physiological and physical body growth and development, which results in increased food consumption and frequency.13 In addition to high food intake, SFPs compel them to potentially unsafe food with less diversity3 which could increase the risk of exposure and put their health in danger. Therefore, monitoring aflatoxin exposure among adolescents in both day and boarding schools consuming maize-based meals is crucial to inform and trigger appropriate nutritional and safety interventions.
To regulate the SFPs, the National Guideline on School Feeding and Nutritional Services for Basic Education Students (NSFNS) was established.14 However present, the NSFNS has adopted a decentralized approach to school feeding where meals are primarily determined by individual schools and influenced by factors such as accessibility, fees or agreements between the school and parent forums.14 Notably, in public day secondary schools, meal programs are managed and overseen by established parent committees.9 This implies the lack of a clear countrywide financing policy on school feeding, highlighting the difficulty in controlling and monitoring the quality of school meals. This creates a huge discrepancy and loopholes for potential poor feeding in schools where decisions are not informed by quality and safety.
Aflatoxins are potent carcinogens belonging to the group of mycotoxins produced as secondary metabolites by strains of Aspergillus fungi, notably A. flavus, A. parasiticus and A. nomius.15 Naturally, they exist in multiple forms, including B1, B2, G1, and G215 with aflatoxin B1 being abundantly available, highly potent and classified as a group 1 carcinogen by the International Agency for Research on Cancer (IARC).16 Aflatoxin B1(AFB1) is oxidized by the cytochrome P450 enzyme in the liver into a hydroxylated derivative, aflatoxin M1(AFM1).17 It is then excreted and can be detected in human biological fluids such as serum, breast milk and urine.18 Human exposure to AFB1 has been determined by biomonitoring through the excretion of its metabolites in urine, milk and blood.18 Individual exposure to AFB1 can be accurately assessed using biomarkers such as AFM1 in urine, which reflects its dietary intake over the preceding 24 hours.
Aflatoxin M1 is water soluble and is excreted in urine at a range of 1.2% – 2.2% of the ingested AFB1.19 Using urinary AFM1 biomarker has the advantage over food-based aflatoxin contamination quantifying methods used to estimate the extent of human exposure to AFB1 as it accounts for uptake, metabolism, distribution, excretion, heterogeneity, level of consumption and takes into account all routes of exposure.20 Urinary AFM1 is a validated biomarker of recent human exposure to Aflatoxins.20,21 Despite well-documented risks associated with aflatoxin exposure, there remains a critical gap in biomonitoring-based exposure data among school-aged adolescents in Tanzania, a physiologically vulnerable group that has been largely overlooked in surveillance studies. Most existing studies have focused on food contamination rather than direct human exposure and few have targeted adolescent populations consuming school-provided meals.3,12 This study addresses this gap by applying a validated biomarker, urinary AFM1 to assess recent aflatoxin exposure among adolescents in secondary schools in Mvomero District. Additionally, the study highlights overlooked intervention points within school feeding programs, where food quality and safety remain unmonitored due to decentralized meal management systems. By filling these evidence gaps, the study contributes valuable insights to inform targeted public health interventions and strengthen food safety and quality in school settings.
Materials and Methods
Study Area
The study was carried out in the Mvomero District in Morogoro Region, Tanzania (Fig. 1). The study location was purposely selected due to previous reports indicating high incidences of aflatoxin contamination of agricultural produce in the area.22 Furthermore, the region experiences a humid to sub-humid climate, a favourable condition for fungal growth. The area is highly agriculturally productive, with 80% of the population earning their living through it.23 In addition, both public and private implement SFPs, with the region leading in maize and beans production, making up the main meal in school feeding programs.24
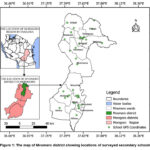 |
Figure 1: The map of Mvomero district showing locations of surveyed secondary schools |
Study Design
The study employed a descriptive cross-sectional design that was carried out in all secondary schools, inclusive of both private and public-owned schools in the Mvomero district. Teachers responsible for school meals provided information on demographic details, grain sources, storage and handling practices through multi-module, semi-structured questionnaires designed based on a previous study by Nicholaus et al.3 While the food handling practices questionnaire was specific for teachers, students were given food frequency and 24-hour dietary recall questionnaires and were required to provide information on demographic characteristics and consumption of AF-susceptible food. The fieldwork took place from February to March 2024. Ethical approval for this study was obtained from the Kibong’oto-Nelson Mandela-Cedha Health Research Ethical Committee (KNCHREC). Then, written research permission was obtained from the President’s Office, Regional Administration and Local Government (PO-RALG) through the Morogoro Regional Administrative Secretary Office and communicated to the District Administrative Secretary Office, District Education Office and the respective Head of Schools. The purpose of the study was thoroughly explained to each participant and written consent was obtained before urine sample and food consumption data were collected.
Sampling design and procedures
Sampling design
This study employed both probability and non-probability sampling designs. The probability sampling approach was used to obtain samples from the students’ population, specifically utilizing proportional random sampling, while the non-probability purposive sampling approach was used to obtain teachers responsible for school meals.
Sample size determination
The sample size was calculated inclusive of a 10% non-response rate using Fischer’s formula as described in Naing et al.25,26
Where N = sample size, Z = statistic for a level of confidence (1.96 for 95% confidence level), P = assumed prevalence of urinary AFM1 biomarker (50%) and d = precision (0.05). Additionally, a 10% non-response rate of the sample size was added to make a total sample of 422 urine samples. A total of 369 respondents agreed to provide urine samples that were analyzed for the AFM1 biomarker. The study assumed a prevalence of 50% for urinary AFM1 biomarkers. This prevalence is recommended in studies without a documented prevalence.27 The only previous study assessing aflatoxin exposure among Tanzanian adolescents employed a deterministic method for the estimation of dietary exposure, potentially differing from the accurate prevalence of urinary AFM1.3,12
Sampling procedure
The study employed a proportional stratified multi-stage sampling procedure to ensure representation from each school, class level and gender of students in Mvomero district. Using the proportional sample allocation formula as described by Singh and Masuku. 28,29
Where: ni = sample size for school i, Ni = student population of school i, N = total student population (18,200) and n = total sample size (422)
A total of 422 students from 33 secondary schools were proportionally sampled based on school size, with 28 participants from the largest school and 4 from the smallest. The sample was further stratified by class level (Form I to IV or VI) and used for urine collection to assess AFM1 levels and 24-hour dietary recall. From this group, a proportional subsample of 138 class-level representatives was selected to complete a detailed food frequency questionnaire. Additionally, one teacher responsible for school meals were purposively sampled from each school (33 in total) to complete a questionnaire on food handling, storage and preparation practices, aimed at evaluating potential aflatoxin contamination risks in the school setting.
Selection of respondents
Respondents in this study included both students and teachers responsible for school meals. Students were selected randomly using the balloting technique.30 In this technique, students were chosen using non-repetitive random selection through a ballot system. The researcher circulated ballot bowls for boys and girls designated by distinct colors; the bowls contained ballot papers pre-marked ‘yes’ or ‘no’, that matched the total number of students present on the particular survey day, for students to pick.30 Students who picked a “yes” paper and had consented to participate in the research were interviewed and asked to provide urine samples at their own will. Whereas teachers were selected using a purposive sampling technique. In this technique, the researcher asked for a list of teachers responsible for school meals from the school administration. For schools with more than one teacher responsible for school meals, the chairperson of the school feeding program team was selected, while the only teacher responsible for school meals was selected in schools with a single teacher. The selected teachers, one from each school, were interviewed on the handling practices and consumption of school meals upon their consent.
Dietary intake data collection tools
To collect dietary intake data, researchers employed both the 24-hour dietary recall and the Food Frequency Questionnaire (FFQ) methods. Dietary intake data, including the types and quantities of food consumed by participants, were collected using a 24-hour dietary recall developed by Ambikapathi et al,31 and modified to fit the current study. Respondents were required to recall all meals and beverages consumed from 6:00 am on the day prior to the survey to 6:00 am on the day of data collection. To accurately capture dietary intake, it was conducted using a four-stage multi-pass procedure (quick list, probe for forgotten foods, review and detailed description and final review and clarification). Portion sizes of aflatoxin-susceptible cooked foods were estimated using digital kitchen scales. Common school utensils such as cups, plates and packages were calibrated and converted into standardized gram equivalents using the Tanzania Food Composition Tables and Food-Based Dietary Guidelines in Excel.32,33
While the 24-hour dietary recall is useful in capturing detailed short-term food intake, it is limited in its ability to reflect habitual dietary patterns and variations in consumption. To address this limitation, a sub-sample of 138 respondents, obtained by drawing one respondent from each stratum (form I to IV from 30 ordinary level schools and form I to VI from 3 advanced level schools) was administered a Food Frequency Questionnaire (FFQ) to capture information on food consumption in the past 30 days. The FFQ previously validated by Zack et al,34 was customized to align with the requirements of the current study and employed to capture longer-term dietary habits and account for potential variation in food consumption. This approach was selected for its simplicity and cost-effectiveness, allowing its application in limited-resource settings.35
Urine sample collection
About 40 ml of midstream urine was collected from students who gave consent (n = 369) using urine containers. Urine collection was done by a trained and registered health professional to ensure the participant’s comfort and ethical treatment. Immediately after collection, urine samples were kept in a car freezer at −4°C and then transported to the laboratory of Mvomero District Hospital. The samples were aliquoted and stored frozen at −20°C, then transported to the NM‐AIST laboratory, where they were stored at −20°C prior to analysis to prevent further development of metabolites.
Analysis of aflatoxin M1 in urine
Validation of method performance and quality assurance
The machine was calibrated before analysis of samples by running AFM1 standards at varied concentrations of 0.05, 0.15, 0.45, 1.35 and 4.05 ng/mL to generate a calibration curve with R2 = 0.998. The method performance was validated by evaluating precision and accuracy (as recovery), linearity and limit of detection (LOD) and limit of quantification (LOQ) according to the National Association of Testing Authorities.36 To determine accuracy and precision, blank samples of urine were spiked with AFM1 standards at concentrations of 1.0, 2.0 and 4.0 ng/mL. The percentage recovery from the spiked sample was calculated after carrying out procedures and conditions for extraction and analysis, the same as that of the samples. The recovery percentage was calculated using a formula described in the National Association of Testing Authorities (NATA).36
![]()
The LOD and LOQ were determined using the visual method as described in NATA.36 Spiking samples with progressively lower concentrations of AFM1 standards enabled the determination of the method’s detection limit and limit of quantification. Across the evaluated concentration range, the method demonstrated linearity and yielded an average recovery of 92.37%. The limit of quantification (LOQ) and the limit of detection (LOD) were found to be 0.007ng/mL and 0.004ng/mL, respectively.
Determination of aflatoxin M1 in urine by ELISA
Aflatoxin M1 in the urine samples was assayed by a quantitative ELISA kit assay (Elabscience Bionovation Inc., Houston, Texas, USA) according to the manufacturer’s instructions. Initially, all reagents and aliquoted urine samples were brought to room temperature (25°C). The urine samples were then centrifuged at 4000 rpm for 5 minutes using a benchtop microcentrifuge (VWR 2400‐37, rotor 2434‐37) to sediment any solid particles. Supernatants were collected and diluted at a ratio of 1:9 with reconstitution buffer. Following this, 50 µL of horseradish peroxidase (HRP) conjugate was added to each mixing well, after which 50 µL of each diluted standard and sample was dispensed into the corresponding mixing wells containing the conjugate.
To the mixture (100 µL) in each mixing well, 50 µL of antibody-working solution was added. The mixture (150 µL) was thoroughly mixed by gently swirling (5 seconds), the plate was covered and then incubated at ambient temperature for 30 minutes in shading light. After incubation, the content of each microwell was discarded, and the microwells were washed three times with PBS-Tween wash buffer and dried using an automated microplate washer (Thermo Scientific™). Aliquots (50 µL) of Tetramethylbenzidine (TMB) enzyme substrates A and B were sequentially added, with each addition followed by a 15-minute incubation at room temperature. Subsequently, 50 µL of stop solution was introduced to the wells. The optical densities (OD) of the resulting reaction mixtures in the microtitre plates were then measured at 450 nm using a BIOTEK ELx808 Microplate Reader. Aflatoxin concentrations in the samples were determined by referencing a standard curve generated from AFM1 standard solutions (0–4.05 ng/mL), based on the inverse relationship between absorbance intensity and AFM1 concentration.
Results
Socio-demographic characteristics of the respondents
A total of 396 adolescents from secondary schools participated in the study, with a slight male majority (54%). Participants ranged in age from 13 to 16 years, with a mean age of 16.5 ± 1.5 years. When grouped, most students (75.5%) were between 12 and 17 years old, while 24.5% fell within the 18–23 age range. The majority of students (94%) attended public schools, and 76% were from day schools, compared to 24% from boarding schools. Most respondents (94%) came from co-educational schools, with a small portion (6%) from boys-only schools; no participants were from girls-only institutions.
Regarding teachers responsible for school meal supervision, respondents were predominantly male (72.7%) and primarily from the arts discipline (69.7%). Concerning school characteristics, most of the schools (93.9%) were public and day schools were more common (66.7%) than boarding schools (33.3%). The majority (90.9%) offered education from Form I to IV, with only 9.1% extending to Form VI. Co-educational schools made up 93.9% of the sample, while only 6.1% were boys-only schools.
School meal ingredients and sources
School meals were dominated by cereal grains, where the majority of both day and boarding schools reported higher use of maize (93.8%), beans (100%), rice (56.3%) and wheat (6.2%). These grains were sourced through parents’ contributions (75%) and purchases (53.1%) from markets (52.9%), individual farmers (52.9%) and registered suppliers (18.8%). Of the purchased grains, majority (75%) procured dehulled grains and flour and a small portion (25%) undehulled grains. While the majority of the schools sourced their grains within the Mvomero District (70.5%), few schools purchased grains from other places (29.4%) mainly Morogoro municipality (11.7%) and Morogoro district (5.8%) within the Morogoro region, and Kibaha district (11.7%) from Pwani region (Table 1).
Table 1: Grains used in school meals and their sources (N = 32)
|
Variables |
n |
Percent (%) |
|
Grains Used |
||
| Maize | 30 |
93.8 |
|
Rice |
18 | 56.3 |
| Beans | 32 |
100 |
|
Wheat |
2 | 6.2 |
|
Sources of Grains |
|
|
| Purchases | 11 |
34.4 |
|
Parents’ contributions |
15 | 46.8 |
| Parents’ contributions and purchases | 6 |
18.8 |
|
Source of Purchases |
||
| Markets | 9(17) |
52.9 |
|
Registered Suppliers |
3(17) | 18.8 |
| Individual Farmers | 9(17) |
52.9 |
|
Type of grains/flour purchased |
||
| Dehulled grains and flour | 9(12) |
75.0 |
|
Undehulled grains |
3(12) | 25.0 |
| Location of Grain Purchase |
|
|
|
Within Mvomero |
12(17) | 70.5 |
| Outside Mvomero | 5(17) |
29.4 |
|
Purchase Outside Mvomero |
||
| Kibaha-Pwani | 2(17) |
11.7 |
|
Morogoro municipality |
2(17) | 11.7 |
| Morogoro district | 1(17) |
5.8 |
Grain storage practices
The majority of the schools store grains in polypropylene bags (96.9%), cement floor (3.1%) and plastic drums (3.1%). Prior to sourcing, storage times were relatively similar between parent-contributed and purchased grains. The majority of parents’ contributed grains had been stored between 0 to 1 month (79.2%) and 2 to 3 months (20.8%), while purchased grains had a storage time range between 0 to 1 month (82.3%) and 2 to 3 months (17.6%). While the study could not ascertain the use of pesticides in the initial storage for both purchased and parents-contributed grains, all schools (100%) reported to have not used pesticides in grain storage (Table 2).
Table 2: Grains storage practices (N = 32)
|
Variables |
n |
Percent (%) |
|
School storage of grains |
||
| Traditional polypropylene bags | 31 |
96.9 |
|
Cement floor |
1 | 3.1 |
| Buckets/Plastic drum | 1 |
3.1 |
|
Pesticide Application in school stores |
||
| No | 32 |
100.0 |
|
Treated with pesticide before school acquisition |
||
| Yes | 1 |
3.1 |
|
I don’t know |
31 | 96.9 |
| Prior Storage Time for Parents’ Contributed Grains |
|
|
|
0-1 Months |
19(24) | 79.2 |
| 2-3 Months | 5(24) |
20.8 |
|
Prior Storage Time for Purchased Grains |
||
| 0-1 Months | 14(17) |
82.3 |
|
1-2 Months |
0 | 0 |
| 2-3 Months | 3(17) |
17.6 |
School meal plan and provision
The majority of the day schools (90.5%) provided meals once a day and only a small fraction (9.5%) provided meals twice a day. On the other hand, all boarding schools (100%) offered three meals a day. Almost all schools (93.8%) lack formal guidelines for meals, while only two schools (6.3%) have their own developed guidelines. Meal planning in more than half (59.4%) of the schools is done collaboratively between parents and the school administration, while a few schools rely solely on the school administration (21.9%) or the parents (15.6%). None of the schools had nutrition guidelines, and almost all schools (93.8%) made their meal choices based on availability. On the other hand, all schools (100%) use a standardized serving vessel to ensure equal ration (Table 3).
Table 3: School meal provision, guidelines and choices (N=32)
|
Variables |
n(N) |
Percent (%) |
|
School meal provision frequency |
||
| Day schools providing once a day | 19(21) |
90.5 |
|
Day schools providing twice a day |
2(21) | 9.5 |
| Boarding schools providing thrice a day | 11(11) |
100 |
|
Presence of school meal guidelines |
||
|
Yes |
2 |
6.3 |
| No | 30 |
93.8 |
|
School meal planning |
||
| Parents | 5 |
15.6 |
|
Parents and school administration |
19 | 59.4 |
| School administration | 7 |
21.9 |
|
Drivers of school meal choices |
||
| Availability | 30 |
93.8 |
|
Nutrition/Safety |
0 | 0 |
| The presence of a standardized serving vessel |
|
|
|
Yes |
32 | 100 |
| No | 0 |
0 |
|
Presence of Nutrition guideline |
||
| Yes | 0 |
0 |
|
No |
32 |
100 |
School meals consumption pattern
The study revealed the consumption of various food items in secondary schools, including breakfast, lunch and supper. For breakfast, maize porridge was the most consumed food item, accounting for 69% of meals, followed by tea and African buns, contributing 15%. During lunch, food consumption was dominated by beans (38%) and stiff porridge (36%), while maize-bean meal (14%) and other food items such as rice (3%) and vegetables (1%) were consumed less frequently. Supper was similarly characterized by beans (34%) and stiff porridge (27%) as the primary choices, followed by rice (14%) and smaller proportions of vegetables (8%), meat (6%), and fruits (4%) (Fig. 2).
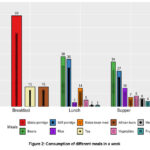 |
Figure 2: Consumption of different meals in a week. |
Adolescents’ meal consumption habits
The food frequency and 24-hour dietary recall results highlighted key dietary habits among secondary school adolescents. Starchy foods, particularly dehulled stiff porridge, were the leading staples, consumed daily by 79% of participants with a mean intake of 241 g at lunch and 239 g at supper. Dehulled maize-bean meal was consumed daily by 34%, with the highest mean supper intake (475 ± 73 g). Rice was consumed 1–2 times a week by 50%, while undehulled stiff porridge was rarely eaten.
Roots, tubers, and plantains, such as potatoes and cooked bananas, were rarely consumed, with only occasional inclusion in meals. Potatoes averaged 256 ± 143 g at supper, while cassava and sweet potatoes were eaten even less frequently. Dairy, meat, and fish were limited in the diet. Milk was occasionally consumed, averaging 208 ± 72 g at lunch and 353 ± 123 g at supper, while meat, fish, and sardines were consumed in small amounts.
Legumes and nuts were dominated by beans, consumed daily by 82% of respondents (124 ± 5 g at lunch). Groundnuts were consumed occasionally in small portions. Fruits and vegetables had low daily consumption frequencies, with tomatoes (54%) and onions (88%) being the most regularly eaten vegetables, often as condiments. Fruits like bananas and mangoes were consumed 1–2 times a week or less, contributing to modest portions (118–125 g).
Fats and oils were dominated by vegetable oil, consumed daily by 96%, while peanut butter and animal fat were rarely eaten. Beverages and snacks showed moderate to high daily consumption, with black tea and snacks consumed daily by 29% and 53% of participants, respectively, in small amounts (61 ± 30 g for snacks). Carbonated drinks were rarely consumed and, when taken, in minimal amounts (Table 4).
Table 4: The frequency of consumption and amount of food consumed by adolescents in secondary schools.
|
Variable |
Frequency of consumption of food items (N = 138) | Dietary Recall (N = 369) | |||||||||
|
Every day
(n (%)) |
3-4 per week
(n (%)) |
1-2 per week (n (%)) | Rarely (1-3 per month) (n (%)) | Never
(n (%)) |
Breakfast (g) | Lunch (g) | Supper (g) | ||||
| Mean ± SD | Range | Mean ± SD | Range | Mean ± SD |
Range |
||||||
|
Starchy foods |
|||||||||||
| Dehulled maize-bean meal | 47 (34) | 9 (7) | 57 (41) | 17 (12) | 8 (6) | – | – | 470 ± 85 | 100-500 | 475 ± 73 |
250-500 |
|
Porridge |
61 (44) | – | 6 (4) | 39 (28) | 32 (23) | 471 ± 81 | 250-500 | – | – | – | – |
| Rice | 13 (9) | 29 (21) | 69 (50) | 24 (17) | 3 (2) | 206 ± 55 | 125-250 | – | – | 250 ± 43 |
62-500 |
|
Dehulled stiff porridge |
109 (79) | 7 (5) | – | 4 (3) | 18 (13) | – | – | 241 ± 42 | 125-500 | 239 ± 42 | 75-375 |
| Undehulled stiff porridge | 19 (14) | – | 1 (1) | 12 (9) | 106 (77) | – | – | 430±41 | 250-500 | 435 ± 38 |
250-500 |
|
Roots, tubers and plantains |
|||||||||||
|
Cooked Banana |
9 (7) | 5 (4) | 26 (19) | 47 (34) | 51 (37) | 219 ± 91 | 125-400 | – | – | 318 ± 103 |
200-500 |
| Fried Banana | 5 (4) | 4 (3) | 5 (4) | 41 (30) | 83 (60) | – | – | – | – | – |
– |
|
Cassava |
6 (4) | 7 (5) | 3 (2) | 54 (39) | 68 (49) | 137 ± 78 | 2-300 | – | – | – | – |
| Sweet potato | 4 (3) | – | 10 (7) | 66 (48) | 58 (42) | – | – | – | – | – |
– |
|
Potatoes |
3 (2) | 8 (6) | 21 (15) | 45 (33) | 61 (44) | 116 ± 58 | 40-250 | – | – | 256 ± 143 | 120-500 |
|
Dairy, meats and fish |
|||||||||||
|
Meat |
1 (1) | 9 (7) | 62 (45) | 63 (46) | 3 (2) | 78 ± 67 | 30-125 | 91 ± 55 | 40-200 | 103 ± 33 | 30-250 |
| Eggs | 1 (1) | 2 (1) | – | 62 (45) | 73 (53) | – | – | – | – | – |
– |
|
Fish |
9 (7) | 11 (8) | 8 (6) | 48 (35) | 62 (45) | – | – | 153 ± 57 | 100-300 | 147 ± 64 | 20-300 |
| Sardines | 21 (15) | 12 (9) | 11 (8) | 28 (20) | 65 (47) | – | – | – | – | – |
– |
|
Milk |
6 (4) | 2 (1) | 5 (4) | 78 (57) | 47 (34) | – | – | 208 ± 72 | 125-250 | 353 ± 123 | 250-500 |
| Yoghurt | 3 (2) | 1 (1) | 5 (4) | 74 (54) | 55 (40) | – | – | – | – | – |
– |
|
Legumes and nuts |
|||||||||||
|
Beans |
113 (82) | 9 (7) | 2 (1) | 13 (9) | 1 (1) | – | – | 124 ± 5 | 75-125 | 126 ± 20 | 62-250 |
| Green peas | – | 1 (1) | 12 (9) | 35 (25) | 90 (65) | – | – | – | – | – |
– |
|
Groundnuts |
10 (7) | 9 (7) | 43 (31) | 48 (35) | 28 (20) | 42 ± 14 | 25-50 | – | – | 47 ± 42 | 20-125 |
| Fruits | – | – | – | – | – | – | – | 118 ± 53 | 100-300 | 125 ± 51 |
100-250 |
|
Banana |
10 (7) | 23 (17) | 64 (46) | 31 (22) | 10 (7) | – | – | – | – | – | – |
| Mango | 4 (3) | 11 (8) | 44 (32) | 48 (35) | 31 (22) | – | – | – | – | – |
– |
|
Vegetables |
113 ± 18 | 100-125 | 97 ± 45 | 50-250 | 124 ± 43 | 10-250 | |||||
| Cabbage | 1 (1) | 4 (3) | 59 (43) | 39 (28) | 35 (25) | – | – | – | – | – |
– |
|
Spinach |
1 (1) | 4 (3) | 28 (20) | 87 (63) | 18 (13) | – | – | – | – | – | – |
| Carrot | 42 (30) | 3 (2) | 11 (8) | 33 (24) | 49 (36) | – | – | – | – | – |
– |
|
Tomato |
75 (54) | 5 (4) | 16 (12) | 32 (23) | 9 (7) | – | – | – | – | – | – |
| Onion | 122 (88) | 2 (1) | 1 (1) | 5 (4) | 8 (6) | – | – | – | – | – |
– |
|
Fats and oils |
|||||||||||
|
Vegetable oil |
132 (96) | 1 (1) | – | 3 (2) | 2 (1) | – | – | – | – | – |
– |
| Animal fat | 6 (4) | 1 (1) | 1 (1) | 12 (9) | 118 (86) | – | – | – | – | – |
– |
|
Peanut butter |
3 (2) | 11 (8) | 13 (9) | 47 (34) | 64 (46) | – | – | – | – | 47 ± 42 | 2-125 |
|
Beverages |
|||||||||||
|
Carbonated soft drink |
11 (8) | 14 (10) | 16 (12) | 82 (59) | 15 (11) | – | – | – | – | – | – |
| Black tea | 40 (29) | 6 (4) | 14 (10) | 34 (25) | 44 (32) | 249 ± 16 | 100-300 | – | – | 234 ± 43 |
125-250 |
|
Snacks |
73 (53) | 6 (4) | 9 (7) | 27 (20) | 23 (17) | 61 ± 30 | 30-150 | – | – | – | – |
Aflatoxin M1 in urine and associated risk of exposure
The analysis of Aflatoxin M1 in urine samples revealed that almost all respondents excreted detectable AFM1. In terms of occurrence, 76.15% (281 samples) of the urine samples tested positive for AFM1 (range 0.005 – 5.685 ng/mL), while only 23.85% (88 samples) tested negative. Of the samples that tested positive, the median concentration of AFM1 in urine was 0.035 ng/mL, with an interquartile range of 0.07 ng/mL.
The results on risk categorization based on detectable urinary AFM1 established threshold of 3.6 ng/L37 revealed that 100% of the positive samples (281) fell within the risk category, whereas none were classified as posing no risk (Table 5).
Further analysis was conducted where multiple linear regression and binomial logistic regression were performed at a 95% confidence level and significance at p < .05 to assess the influence of demographic characteristics on the amount of AFM1 excreted in urine and the risk of exposure to AF, respectively. The results of both regression analyses were non-significant, potentially implying that the concentration of excreted AFM1 was more influenced by dietary factors.
Table 5: Aflatoxin M1 in urine and associated risk of exposure
|
Variable |
Measure |
|
|
Amount of AFM1 in urine (ng/mL) |
Median | IQR |
| 0.035 |
0.07 |
|
|
Aflatoxin M1 occurrence |
Frequency | Percentage (%) |
| Negative | 88 |
23.85 |
|
Positive |
281 | 76.15 |
| Risk category * | ||
|
No Risk |
0 | 0 |
| Risk | 281 |
100 |
*The risk categorization is based on a threshold of 0.0036 ng/mL reported by Sun et al37
The amount of urinary AFM1 by demographic characteristics of student respondents
A Wilcoxon rank-sum test (WRT) was performed to assess differences in excretion of aflatoxin M1 across demographic characteristics of student respondents with detectable AFM1. The results showed no statistically significant difference between males and females (W = 8357.0, p = 0.983), indicating similar aflatoxin levels across genders. However, a significant difference was observed between age groups (W = 7303.0, p = 0.040), with younger adolescents aged 12–17 having higher median concentrations (0.039 ng/mL, IQR = 0.090) compared to elder adolescents aged 18–23 (0.024 ng/mL, IQR = 0.045). Additionally, adolescents from different school systems showed a significant difference (W = 822.5, p = 0.003), with co-education schools showing higher median concentrations (0.036 ng/mL, IQR = 0.074) compared to boys’ schools (0.011 ng/mL, IQR = 0.014). While no significant difference was found in adolescents from schools with different accommodation types and school ownership with boarding and day schools (W = 5808.0, p = 0.131) and public and private schools (W = 1894.0, p = 0.219) (Table 6). The findings on students from different school systems and school ownership were further analyzed through the bootstrap analysis to account for sample imbalances. The results showed a significant mean difference between students from co-education and boys’ schools (mean difference = 0.172, 95% CI [0.120, 0.224], p = 0.012) and no significant difference between students from public and private schools (mean difference = 0.022, 95% CI [-0.24, 0.20], p = 0.854) in support of the WRT results.
Table 6: Association between demographic characteristics of student respondents and the amount of excreted AFM1
| Variables | n | Median (IQR)(ng/mL) | W | p-value |
|
Gender |
8357.0 | 0.983 | ||
| Female | 130 | 0.036 (0.084) | ||
|
Male |
151 | 0.034 (0.065) | ||
| Age group | 7303.0 |
0.040 |
||
|
12 – 17 |
210 | 0.039 (0.090) | ||
| 18 – 23 | 71 | 0.024 (0.045) | ||
|
School system |
822.5 | 0.003 | ||
| Boys | 14 | 0.011 (0.014) | ||
|
Co-education |
267 | 0.036 (0.074) | ||
| School accommodation | 5808.0 |
0.131 |
||
|
Boarding |
72 | 0.028 (0.064) | ||
| Day | 209 | 0.036 (0.082) | ||
|
School ownership |
1894.0 | 0.219 | ||
| Public | 261 | 0.033 (0.079) | ||
|
Private |
20 |
0.047 (0.028) |
The relationship between consumption of AF-susceptible food and urinary AFM1 excretion
The results of a Spearman’s rank test on the association between the consumption of susceptible foods and excretion of AFM1 revealed that among cereals, maize-bean meal consumption was positively correlated with AFM1 levels (ρ = 0.216, p < .001), indicating higher excretion with increased intake. In contrast, porridge and rice (ρ = −0.118, p = .023) showed a weak but statistically significant negative correlation with AFM1 levels, while stiff porridge had no significant association (p = 0.5324). Within legumes and nuts, bean consumption exhibited a weak negative correlation with excreted AFM1 (ρ = −0.113, p = .030), whereas nuts and butter and dairy were not significantly associated (p = .069) and (p = 0.705) respectively (Table 7).
Table 7: The association between consumption of susceptible food and the excreted AFM1
|
Susceptible food consumed |
Mean ± SD | Spearman’s rho (ρ) |
p-value |
|
Cereals |
|||
| Maize-bean meal | 265.92 ± 241.53 | 0.216 |
< .001 |
|
Porridge |
182.25 ± 237.78 | -0.118 | 0.023 |
| Rice | 121.85 ± 147.02 | -0.118 |
0.023 |
|
Stiff porridge |
200.43 ± 149.25 | -0.033 | 0.532 |
| Legumes and nuts | |||
|
Beans |
87.12 ± 85.3 | -0.113 | 0.03 |
| Nuts/butter | 1.27 ± 8.61 | -0.095 |
0.069 |
|
Dairy |
|||
| Milk and its products | 17.68 ± 79.23 | -0.02 |
0.705 |
Discussion
School grain sources, handling and storage practices
The findings on food handling practices in secondary schools reveal dominance of cereals, aligning with trends in sub-Saharan Africa, where school meals are dominated by cereal grains, particularly maize and beans, reflecting regional dietary patterns. However, cereals and legumes alone often fail to meet nutritional requirements.38 Similar patterns are reported in Kenya and Uganda, where affordability, availability and culturally accepted staples drive the reliance on these grains.39,40
Grains were sourced through parental contributions and purchases, relying heavily on local markets and farmers, a tendency also observed in Ghana.41 This practice may be associated with the rapid growth of local grain millers in Tanzania and a tendency to reduce the logistical cost of purchasing grains by schools.42 The minimal use of registered suppliers raises concerns about food quality assurance, as informal markets are associated with low quality and potentially higher risks of aflatoxin contamination.43
The predominant use of polypropylene bags for grain storage mirrors findings in Ghana and other studies in Tanzania.43 While accessible and affordable, these bags are ineffective against pests and moisture control, increasing fungal contamination risks, particularly during the rainy season. The lack of pesticide usage for grain storage and the low awareness of pesticide application not only reflect resource and knowledge gaps but also present an opportunity to replace the use of pesticides for grain storage. Pesticide use is associated with leaving residues that can potentially increase the burden of non-communicable diseases when handling practices are not fully followed.44 Schools should be encouraged to use safer alternatives to controlling contamination such as Purdue Improved Crop Storage (PICS) bags and metal silos through capacity-building initiatives, as recommended in studies from Coastal Tanzania.45
Food consumption among adolescents
The study found that majority of day schools provide only one meal per day, with fewer offering two meals, while all boarding schools provided three meals daily. These findings contrast with findings by Nicholaus et al,3 who reported that most boarding schools (62.8%) provided two to three meals daily. Furthermore, limited meal frequency increases the risk of energy and nutrient deficiencies among adolescents, negatively affecting growth, health, and cognitive development.46 The absence of formal meal guidelines and nutrition-specific planning mirrored findings from Tanzania and Uganda, where school meals were often unstructured and guided by food availability.9,39 Collaborative meal planning between parents and schools commonly resulted in insufficient nutritional focus due to financial and logistical constraints, a challenge also noted in Rwanda.47
Adolescents’ diets heavily relied on starchy staples like stiff porridge and maize-bean meals, reflecting widespread dependence on affordable and locally accessible energy sources. Similar tendencies were reported another study Tanzania, where stiff porridge and beans dominated meals, leading to risks of micronutrient deficiencies.46 Roots, tubers, and plantains were rarely included and the infrequent consumption of meat, fish, and dairy underscored inadequacy of protein and micronutrient intake, consistent with reports from Nigeria.48 Fruits and vegetables were consumed at worryingly low frequencies, with tomatoes and onions primarily used as ingredients and fruits like bananas and mangoes eaten sporadically. Milk was occasionally consumed, but in quantities insufficient to meet nutritional requirements which may be linked to lifestyle and dietary habits.
Snacks and beverages such as black tea and wheat snacks were moderately consumed, reflecting efforts by adolescents to diversify monotonous diets and limited choices.48 Although snacks provide quick energy, they often lack essential nutrients, further contributing to the inadequate dietary quality observed among adolescents. However, carbonated drinks were rarely consumed, likely due to limited resources.
Influence of demographic characteristics and dietary habits on urinary AFM1 excretion
The analysis revealed no statistically significant differences between gender, school ownership and school accommodation type with urinary AFM1 levels. This aligns with findings from other studies in Egypt,49 Malaysia,7 and Iran,18 where no gender differences in aflatoxin biomarker concentrations were observed. These results suggest that aflatoxin exposure is primarily community-wide and dietary, and might be less influenced by specific demographic attributes. However, statistically significant differences were observed between school systems and age groups where excreted AFM1 levels concurred with studies in countries such as China and Ghana37,50 that have occasionally reported age-related variations in aflatoxin biomarkers. The difference in excreted levels of AFM1 for school-related characteristics might be linked to variations in dietary habits, although it was minimal in the relatively uniform dietary practices of the studied population. Conversely, the observed age-related differences, where young adolescents (12-17 years) excreted higher AFM1 levels than older adolescents (18-23 years), might reflect the differences in body immunity and detoxification capacity. This was evident in a study conducted in Switzerland, where young adolescents were found to have lower immunity as compared to older adolescents.51
The positive correlation between maize-bean meal consumption and urinary AFM1 levels (ρ=0.216, P<.001) underscores the role of maize as a major source of aflatoxin exposure. Similar findings have been reported in Malaysia,52 where grains were frequently contaminated with aflatoxins. Conversely, the weak negative correlations observed with porridge, rice, and beans may potentially suggest lower AF contamination of these foods. Studies have reported an insignificant reduction of AF when maize is dehulled,53 while rice is known to contain low aflatoxin.54 The absence of significant associations between milk and dairy products and urinary AFM1 levels aligns with findings from Iran55 and contrasts with the findings in Malaysia,56 which found a significant association between milk and dairy products. These findings concur with a previous study,3 which reported that consumption of AF susceptible grains is the primary route of exposure, suggesting a critical area for effective interventions to mitigate aflatoxin exposure in this vulnerable population.
Risk of exposure to aflatoxin among adolescents
The findings revealed a high prevalence of urinary Aflatoxin M1 (AFM1) observed in this study, with majority of adolescents testing positive, highlighting a widespread aflatoxin exposure within the population. This finding mirrors studies conducted in sub-Saharan Africa and other places globally, where similarly high prevalence rates have been reported. For instance, about 99% positivity in urinary aflatoxin biomarkers among children was reported in four Villages in Tanzania.57 Similarly, high prevalence, such as 91.2% in Ghanaian children,50 65% in Brazilian adults19 and 100% in Malaysian adults58 were documented. Such pervasive exposure is largely attributed to the contamination of staple foods due to poor storage practices and favorable climatic conditions for fungal growth. Risk categorization based on the threshold of 3.6 ng/L37 indicated that 100% of participants were within the risk category, reflecting significant exposure levels. This is consistent with studies in Malaysia,58 where most participants exceeded permissible exposure limits.
The present study found the median AFM1 concentration to be (0.035 ng/mL), similar to the one reported in Malaysia (0.042 ng/mL)58 and China (0.04 ng/mL).59 Nevertheless, it is relatively lower than concentrations reported in countries like Malaysia (1.23ng/mL),52 and Nigeria (0.3 ng/mL)21 but higher than reported in Iran (0.022 ng/mL)55 and Egypt (0.023 ng/mL).49 Although the concentration of AFM1 in this study is moderate, it still reflects a significant exposure risk that warrants attention. Aflatoxin M1 serves as a specific biomarker for AFB1 exposure, which is classified as a Group 1 carcinogen,16 meaning no level of exposure is considered safe. However, these findings are limited to schools within a single district and one agroecological zone, with data restricted to a specific season. As aflatoxin contamination in grains varies by season and location, these results may not be generalized to the entire calendar year and other agroecological zones in the country.
Strengths and limitations of the study
The study’s key strength of the present study was the use of urinary AFM1 biomarker analysis, an objective method for assessing recent aflatoxin exposure, reducing recall bias and increasing data reliability. It also employed inclusive tools such as surveys, dietary recalls and interviews to capture grain handling practices and dietary habits. The large sample size of 396 (369 provided urine samples) secondary school adolescents, including 33 teachers, improved the representativeness of the findings while focusing on adolescents, a vulnerable population, adding to its significance. However, the study had limitations, including its cross-sectional design, which hindered the establishment of causal relationships and did not account for seasonal variation. Urinary biomarkers provide insights into short-term exposure and do not address long-term exposure. Additionally, self-reported dietary data may have introduced recall bias and the absence of direct aflatoxin testing in food samples limited the ability to link contamination in food to the biomarkers of exposure.
Conclusion
This study examined grain handling, dietary consumption and the risk of aflatoxin exposure among secondary school adolescents in Mvomero District, Tanzania, using the urinary Aflatoxin M1 biomarker. Findings revealed high aflatoxin exposure linked to frequent consumption AF-susceptible food, poor grain storage practices and unregulated grain sourcing. Exposure levels were significantly influenced by adolescents’ age group highlighting age-related risks. Notably, this study presents a novel application of the urinary AFM1 biomarker among school-aged adolescents in a Tanzanian context, a population group and setting that remains under-researched. Despite the existence of a national school nutrition guideline, there is a gap in policy implementation. A strategic opportunity may exist to improve school meals by relying on official suppliers and systematically utilizing the aflatoxin M1 bio-marker in exposure assessment. While the findings provide valuable insights, they are limited by geographical scope and seasonal variability, and should therefore be interpreted with caution. Future research should focus on developing evidence-based interventions, including improved grain storage and cost-effective routine monitoring systems for aflatoxin contamination and exposure. This study highlights urgent aflatoxin risks in school meals and calls for targeted, evidence-based interventions to safeguard adolescents’ health.
Acknowledgement
The authors greatly acknowledge all responsible Authorities in Morogoro regions, secondary school students, teachers responsible for school meals and heads of schools in Mvomero District for giving their time, responding to the questionnaires and assisting during sample collection. The authors’ special gratitude also goes to the research assistants for their technical support during the sample collection.
Funding Sources
This research was funded by the Higher Education Students’ Loans Board (HESLB) and benefited from the AFM1 analysis infrastructure and resources of the Mycotoxins Mitigation Trial (MMT) project under grant number OPP1155626. The sponsors were not involved in any capacity during the study design, collection, analysis and interpretation of data; nor in the writing of the manuscript.
Conflict of Interest
The authors do not have any conflict of interest.
Data Availability Statement
The datasets analyzed in this study are available from the corresponding author upon reasonable request.
Ethics Statement
This study received ethical approval from the Kibong’oto-Nelson Mandela-Cedha Northern Tanzania Health Research Ethics Committee (KNCHREC) on July 15, 2024, under approval number KNCHREC00015/01/2024.
Informed Consent Statement
Written informed consent was obtained from all study participants.
Clinical Trial Registration
This study did not involve any clinical trials
Permission to Reproduce Materials from Other Sources
This study does not include any reproduced materials. All tables and figures presented in the manuscript are original and generated from the data collected and analyzed in this study
Author contributions
- Frank Madoshi: Conceptualization, Methodology, Data Collection, Sample and Data Analysis and Writing – Original Draft.
- Neema Kassim: Conceptualization, Supervision and Guidance, Funding Acquisition and Writing – Review and Editing.
- Sylvester Gerald Temba: Supervision, Data collection and Laboratory Analysis.
References
- World Health Organization (WHO). Estimates of the Global Burden of Foodborne Diseases: Foodborne Disease Burden Epidemiology Reference Group 2007-2015. Encycl Parasitol. Published online 2016:1068-1069. doi:10.1007/978-3-662-43978-4_3884
CrossRef - Singh RL, Mondal S. Current Issues in Food Safety With Reference to Human Health. In: Singh RL, Mondal S, eds. Food Safety and Human Health. Academic Press; 2019:1-14. doi:https://doi.org/10.1016/B978-0-12-816333-7.00001-1
CrossRef - Nicholaus C, Martin HD, Matemu A, Kimiywe J, Kassim N. Risk of Aflatoxin Exposure Among Adolescents in Boarding Schools in Kilimanjaro Region, Tanzania. World Mycotoxin J. 2021;14(2):221-235. doi:10.3920/WMJ2011.x001
CrossRef - Azziz-Baumgartner E, Lindblade K, Gieseker K, et al. Case-control study of an acute aflatoxicosis outbreak, Kenya, 2004. Environ Health Perspect. 2005;113(12):1779-1783. doi:10.1289/ehp.8384
CrossRef - Gong Y, Wilson S, Mwatha JK, et al. Aflatoxin exposure may contribute to chronic hepatomegaly in Kenyan school children. Environ Health Perspect. 2012;120(6):893-896. doi:10.1289/ehp.1104357
CrossRef - Owaga E, Muga R, Mumbo H, Aila F. Chronic dietary aflatoxins exposure in Kenya and emerging public health concerns of impaired growth and immune suppression in children. Int J Biol Chem Sci. 2011;5(3):1325-1336. doi:10.4314/ijbcs.v5i3.72287
CrossRef - Sabran MR, Rosita J, Sokhini AMM, Aqilah ARN. Association between aflatoxin M1 excreted in human urine samples with the consumption of milk and dairy products. Bull Environ Contam Toxicol. 2012;89(6):1115-1119. doi:10.1007/s00128-012-0853-y
CrossRef - Ismail A, Gonçalves BL, de Neeff D V, et al. Aflatoxin in foodstuffs: Occurrence and recent advances in decontamination. Food Res Int. 2018;113:74-85. doi:https://doi.org/10.1016/j.foodres.2018.06.067
CrossRef - Roothaert R, Mpogole H, Hunter D, Ochieng J, Kejo D. Policies, Multi-Stakeholder Approaches and Home-Grown School Feeding Programs for Improving Quality, Equity and Sustainability of School Meals in Northern Tanzania. Front Sustain Food Syst. 2021;5(February). doi:10.3389/fsufs.2021.621608
CrossRef - World Bank. Tanzania – Secondary Education Quality Improvement Project (SEQuIP).; 2019. http://documents1.worldbank.org/curated/en/099042424093521023/pdf/P1704801d12e9a01b193cf107ec002115f7.pdf
- FAO and WFP. Home-Grown School Feeding Resource Framework Synopsis-March 2018. FAO and WFP; 2018. https://www.wfp.org/publications/home-grown-school-feeding-resource-framework
- Kibwana M, Kimbokota F, Christopher R, Mmongoyo JA. Aflatoxins in stored maize, maize flours, and stiff porridge consumed in schools: A case study of Dodoma region, Tanzania. Food Control. 2023;146(June 2022):109519. doi:10.1016/j.foodcont.2022.109519
CrossRef - Stang J, Story M. Adolescent growth and devel_opment. In Guidelines for Adolescent Nutrition Services. In: Guidelines for Adolescent Nutrition Services. University of Minnesota; 2005:1-8.
- United Republic of Tanzania. National Guidelines on School Feeding and Nutrition Services to Basic Education Students.; 2020. https://www.fao.org/docs/devschoolfoodlibraries/materials-from-countries/national-guidelines-on-school-feeding-and-nutrition-services-to-basic-education-students-(2020).pdf
- Liu Y, Wu F. Global burden of Aflatoxin-induced hepatocellular carcinoma: A risk assessment. Environ Health Perspect. 2010;118(6):818-824. doi:10.1289/ehp.0901388
CrossRef - IARC. List of Classifications: Carcinogenic Agents by Cancer Sites with Sufficient or Limited Evidence in Humans , Volumes 1 to 113. Int Agency Res Cancer. Published online 2020:1-12. https://monographs.iarc.fr/agents-classified-by-the-iarc/
- Shahbazi Y, Nikousefat Z, Karami N. Occurrence, seasonal variation and risk assessment of exposure to aflatoxin M1 in Iranian traditional cheeses. Food Control. 2017;Volume 79:Pages 356-362. https://doi.org/10.1016/j.foodcont.2017.04.021
CrossRef - Mason S, Hajimohammadi B, Ehrampoush MH, Khabiri F, Soltani M. A survey on relationship between diet and urinary excretion of aflatoxin M1: A screening pilot study on Iranian population. J Food Qual Hazards Control. 2015;2(2):66-70.
- Romero A de C, Ferreira TRB, Dias CT dos S, Calori-Domingues MA, da Gloria EM. Occurrence of AFM1 in urine samples of a Brazilian population and association with food consumption. Food Control. 2010;21(4):554-558. doi:10.1016/j.foodcont.2009.08.004
CrossRef - Ediage E, Diana Di Mavungu J, Song S, Wu A, Van Peteghem C, De Saeger S. A direct assessment of mycotoxin biomarkers in human urine samples by liquid chromatography tandem mass spectrometry. Anal Chim Acta. 2012;741:58-69. doi:https://doi.org/10.1016/ j.aca.2012.06.038
CrossRef - Ezekiel CN, Warth B, Ogara IM, et al. Mycotoxin exposure in rural residents in northern Nigeria: A pilot study using multi-urinary biomarkers. Environ Int. 2014;66:138-145. doi:10.1016/j.envint.2014.02.003
CrossRef - Temba BA, Darnell RE, Gichangi A, et al. The Influence of Weather on the Occurrence of Aflatoxin B1 in Harvested Maize from Kenya and Tanzania. Published online 2021:1-13.
CrossRef - Rumisha SF, Shayo EH, Mboera LEG. Spatio ‑ temporal prevalence of malaria and anaemia in relation to agro ‑ ecosystems in Mvomero district , Tanzania. Malar J. Published online 2019:1-15. doi:10.1186/s12936-019-2859-y
CrossRef - NBS. National Sample Census of Agriculture 2007 / 08 Volume V : Regional Report : Morogoro Region. 2012;V.
- Arya R, Antonisamy B, Kumar S. Sample size estimation in prevalence studies. Indian J Pediatr. 2012;79(11):1482-1488. doi:10.1007/s12098-012-0763-3
CrossRef - Naing L, Nordin R Bin, Abdul Rahman H, Naing YT. Sample size calculation for prevalence studies using Scalex and ScalaR calculators. BMC Med Res Methodol. 2022;22(1):209. doi:10.1186/s12874-022-01694-7
CrossRef - Lwanga S, Lemeshow S. Sample size determination in health studies : a practical manual /. Published online 1991. https://iris.who.int/handle/10665/40062
- Kothari CR. Research methodology: Methods and techniques. New Age Int. 2004;6(1):51-66.
- Singh AS, Masuku MB. Fundamentals of applied research and sampling techniques. Int J Med Appl Sci. 2013;2(4):124-132. www.earthjournals.org
- Ogum Alangea D, Aryeetey RN, Gray HL, Laar AK, Adanu RMK. Dietary patterns and associated risk factors among school age children in urban Ghana. BMC Nutr. 2018;4(1):1-10. doi:10.1186/s40795-018-0230-2
CrossRef - Ambikapathi R, Irema I, Lyaatu I, et al. Development and Feasibility of Tablet-based 24-hour Recall for. Curr Dev Nutr. 2019;3:nzz034.P10-018-19. doi:10.1093/cdn/nzz034.P10-018-19
CrossRef - MoH and FAO. Tanzania Mainland Food-Based Dietary Guidelines for a Healthy Population: Technical Recommendations. (Brownlee R, ed.). Ministry of Health; 2023.
- Lukmanji Z, Hertzmark E, Mlingi N, Assey V. Tanzania Food Composition Tables. 2nd editio. MUHAS- TFNC, HSPH; 2008. http://www.hsph.harvard.edu/nutritionsource/files/tanzania-food-composition-tables.pdf
- Zack RM, Irema K, Kazonda P, et al. Validity of an FFQ to measure nutrient and food intakes in Tanzania. New Testam Stud. 2018;21(12):2211-2220. doi:10.1017/S1368980018000848
CrossRef - FAO. Dietary Assessment.; 2021. doi:10.1201/9781003210368-2
CrossRef - National Association of Testing Authorities (NATA). Guidelines for the validation and verification of quantitative and qualitative test methods. Natl Assoc Test Authorities, Aust. 2012;(June 2012).
- Sun Z, Lu P, Gail MH, et al. Increased risk of hepatocellular carcinoma in male hepatitis B surface antigen carriers with chronic hepatitis who have detectable urinary aflatoxin metabolite M1. Hepatology. 1999;30(2):379-383. doi:10.1002/hep.510300204
CrossRef - Miller BDD, Welch RM. Food system strategies for preventing micronutrient malnutrition. Food Policy. 2013;42:115-128. doi:10.1016/j.foodpol.2013.06.008
CrossRef - Robert F. Implementation of the school feeding and nutrition programmes in Uganda and the contribution of school meals to recommended dietary allowances (RDAs) of children: Challenges and opportunities. African J Food Sci. 2023;17(5):85-101. doi:10.5897/AJFS2022.2187
CrossRef - Wangari C, Mwema C, Siambi M, Silim S. Changing Perception through a Participatory Approach by Involving Adolescent School Children in Evaluating Smart Food Dishes in School Feeding Programs – Real-Time Experience from Central and Northern Tanzania. Published online 2020. doi:10.1080/03670244.2020.1745788
CrossRef - John M, Anthony A drokow. Assessment of Relevance and Challenges of the School Feeding Programme In Some Basic Schools In Mpohor-Wassa East District. Int J Sci Res Sci Technol IJSRST. 2018;4(8):539-548.
- Bymolt R, D’Anjou J. Lessons on Small and Medium-Scale Maize Flour Fortification in Tanzania Lessons Learned from the Millers Pride-Lishe Bora Project.; 2017.
- Msemwa B, Mabumbwiga JJ, Minja CA, et al. Unmasking aflatoxin hazards in maize for human consumption: investigating maize contamination in Mwanza Markets, Tanzania. Afr Health Sci. 2024;24(3):112-117. doi:10.4314/ahs.v24i3.15
CrossRef - Nicholaus C, Haikael MD, Athanasia MO, Neema K, Judith K. Does Pesticide exposure contribute to the growing burden of non – communicable diseases in Tanzania. Sci African. 2022;17:e01276. doi:10.1016/j.sciaf.2022.e01276
CrossRef - Abdu MM, Rashid S, Beatrice K. Assessment the Level of Awareness of Aflatoxin Contaminations in Maize-Based Meals Among Boarding School Personnel. Int J Microbiol Biotechnol. 2024;9(1):21-29. doi:https://doi.org/10.11648/j.ijmb.20240901.14
CrossRef - Nicholaus C, Martin HD, Kassim N, Matemu AO, Kimiywe J. Dietary Practices, Nutrient Adequacy, and Nutrition Status among Adolescents in Boarding High Schools in the Kilimanjaro Region, Tanzania. J Nutr Metab. 2020;2020. doi:10.1155/2020/3592813
CrossRef - Dieu HJ De, Theogene H, Emmanuel N, Abdou M, Emmanuel N, Ke Z. School feeding programme implementation and its challenges in basic education schools in Rwanda. African Educ Res J. 2023;11(3):338-350. doi:10.30918/AERJ.113.23.037
CrossRef - Okpebholo EG, Oludahunsi OF, Ijarotimi OS. Quality Dietary Intake in Adolescence : Assessment of Macronutrients , Minerals and Essential Amino Acids in School Meals Served in the FCT , North Central Nigeria . Int J Res Innov Appl Sci. 2024;IX(2454):1-14. doi:https://doi.org/10.51584/IJRIAS.2024.910001
CrossRef - Hatem NL, Hassab HMA, Al-Rahman EMA, El-Deeb SA, Ahmed RLES. Prevalence of Aflatoxins in Blood and Urine of Egyptian Infants with Protein–Energy Malnutrition. Food Nutr Bull. 2005;26(1):1-8. doi:https://doi.org/10.1177/156482650502600106
CrossRef - Jolly P, Jiang Y, Ellis W, et al. Determinants of aflatoxin levels in Ghanaians: Sociodemographic factors, knowledge of aflatoxin and food handling and consumption practices. Int J Hyg Environ Health. 2006;209(4):345-358. doi:https://doi.org/10.1016/ j.ijheh. 2006.02.002
CrossRef - Schifferli A, Moulis G, Godeau B, et al. Adolescents and young adults with newly diagnosed primary immune thrombocytopenia. Haematologica. 2023;108(10):2783-2793. doi:10.3324/haematol.2022.282524
CrossRef - Sulaiman SH, Jamaluddin R, Sabran MR. Association between urinary aflatoxin (AFM1) and dietary intake among adults in Hulu Langat District, Selangor, Malaysia. Nutrients. 2018;10(4):0-15. doi:10.3390/nu10040460
CrossRef - Siwela AH, Siwela M, Matindi G, Dube S, Nziramasanga N. Decontamination of aflatoxin-contaminated maize by dehulling. J Sci Food Agric. 2005;85(15):2535-2538. doi:10.1002/jsfa.2288
CrossRef - Tanaka K, Sago Y, Zheng Y, Nakagawa H, Kushiro M. Mycotoxins in rice. Int J Food Microbiol. 2007;119(1):59-66. doi:https://doi.org/10.1016/j.ijfoodmicro.2007.08.002
CrossRef - Hajimohammadi B, Ehrampoush MH, Dalvand A, Mohammadzadeh M, Soltani M, Eskandari S. Assessment of aflatoxin exposure using urine biomarker in pregnant and non-pregnant women in Yazd, Center of Iran. Environ Heal Eng Manag. 2021;8(4):277-286. doi:10.34172/EHEM.2021.31
CrossRef - Sabran MR, Rosita J, Mutalib A, Sokhini M, Rahman A, Aqilah N. Socio-demographic and socio-economic determinants of adults’ knowledge on fungal and aflatoxin contamination in the diets. Asian Pac J Trop Biomed. 2012;2(3 SUPPL.):S1835-S1841. doi:10.1016/S2221-1691(12)60504-8
CrossRef - Shirima CP, Kimanya ME, Routledge MN, Srey C, Kinabo JL. A Prospective Study of Growth and Biomarkers of Exposure to Aflatoxin and Early Childhood. Environ Health Perspect. 2015;123(2):173-178. doi:http://dx.doi.org/10.1289/ehp.1408097
CrossRef - Sabran MR, Jamaluddin R, Abdul Mutalib MS. Screening of aflatoxin M 1, a metabolite of aflatoxin B 1 in human urine samples in Malaysia: A preliminary study. Food Control. 2012;28(1):55-58. doi:10.1016/j.foodcont.2012.04.048
CrossRef - Mykkänen H, Zhu H, Salminen E, et al. Fecal and urinary excretion of aflatoxin B1 metabolites (AFQ1, AFM1 and AFB-N7-guanine) in young Chinese males. Int J Cancer. 2005;115(6):879-884. doi:10.1002/ijc.20951
CrossRef
Abbreviations
|
AF(s) |
Aflatoxin(s) |
|
AFB1 |
Aflatoxin B1 |
|
AFM1 |
Aflatoxin M1 |
|
ELISA |
Enzyme-linked Immunosorbent Assay |
|
FFQ |
Food Frequency Questionnaire |
| IARC |
International Agency for Research on Cancer |
|
KNCHREC |
Kibong’oto-Nelson Mandela-Cedha Health Research Ethical Committee |
|
LOD |
Limit of Detection |
| LOQ |
Limit of Quantification |
|
NATA |
National Association of Testing Authorities |
| NM-AIST |
The Nelson Mandela African Institution of Science and Technology |
|
NSFNS |
National Guideline on School Feeding and Nutritional Services for Basic Education Students |
| PO-RALG |
President’s Office, Regional Administration and Local Government |
|
SEQuIP |
Secondary Education Quality Improvement Project |
| SFP(s) |
School Feeding Program(s ) |
|
WRT |
Wilcoxon Rank-sum Test |
Accepted on: 15 Jul 2025
Second Review by: Imane El Houssni
Final Approval by: Dr Lee Lai Kuan


Web of Science Coverage
Emerging Sources Citation Index (ESCI)
2024 Journal Impact Factor: 1.1
Scopus Journal Metrics
CiteScore 2024: 1.9
CiteScore Details
Sustainable Nutrition: Food Systems, Nutrient Retention, and Public Health Impact
![]()
This journal is a member of, and subscribes to the principles of, the Committee on Publication Ethics (COPE)


