Prediction of Retinol in Fortified Maize Flour using Fourier Transform – Near Infrared Spectroscopy
Brenda Chepkoech*
, Daniel N. Sila and Irene N. Orina Department of Food Science and Technology, Jomo Kenyatta University of Agriculture and Technology, Nairobi, Kenya.
Corresponding Author E-mail: brendarutto7@gmail.com
DOI : http://dx.doi.org/10.12944/CRNFSJ.12.1.31
Download this article as:
![]()
Food fortification is one strategy for addressing micronutrient deficiencies among the population groups at risk. Non-compliance with fortification standards hinders the success of fortification programs. This is due to a lack of techniques to rapidly check the amounts of the added fortificants. Fourier transform - near-infrared (FT-NIR) spectroscopy is a fast and reliable technique that would be used to ensure adherence to requirements. This study aimed to investigate the potential of using FT-NIR spectroscopy to predict the amount of retinol in fortified maize flour. 150 fortified maize flour samples were used in this study. Partial least squares regression (PLS-R) was used to build calibration models based on the retinol reference values obtained by high-performance liquid chromatography (HPLC), and fortified maize flour NIR spectra acquired from the FT-NIR spectrophotometer. Two calibration models were developed to predict retinol above and below 1.0 mg/kg. The performance metrics of model one developed to predict retinol 1.0 mg/kg were: R2c = 0.81, RMSEE = 0.08, RPD = 2.29 and R2v = 0.82, RMSEP = 0.09, RPD = 2.07 for the calibration and validation, respectively. The second model developed to predict retinol ≥ 1.0 mg/kg had the following performance metrics: R2c = 0.93, RMSEE = 0.16, RPD = 3.58 and R2v = 0.81, RMSEP = 0.22, RPD = 2.43 for the calibration and validation, respectively. Overall, the findings demonstrated that FT-NIR spectroscopy can be utilised to reliably predict retinol levels in fortified maize flour samples. FT-NIR spectroscopy, by replacing time-consuming and laborious wet chemistry laboratory procedures, has the potential to be used for rapid regulatory monitoring of fortification compliance for a large number of samples.
KEYWORDS:Fortified Maize Flour; Fourier Transform- Near Infrared Spectroscopy; High-Performance Liquid Chromatography; Partial Least Squares Regression, Retinol
Introduction
Micronutrient deficiency is a major global health concern affecting more than two billion people across the world 1,2. People in developing countries frequently lack a variety of micronutrients 1. One of the major micronutrient deficiencies in Kenya is vitamin A deficiency (VAD) 3,4. Approximately 24% of Kenyans are vitamin A deficient, with preschoolers being the most affected (53%) 5.
A regular intake of essential micronutrients can prevent or eliminate micronutrient deficiencies 6. Increasing the availability of micronutrients in the diet through fortification is a cost-effective strategy to reduce the prevalence of micronutrient deficiencies 5,7. A suitable fortification vehicle should be extensively consumed and easily accessible to consumers 5,8. Maize (Zea mays L.) is widely considered a staple food to a large population in Kenya 9,10. Maize flour is used as a vehicle to deliver retinol, thiamin, riboflavin, niacin, pyridoxine, folic acid, iron, and zinc in the diet 11.
Vitamin A is an essential micronutrient that must be supplied in the diet. Retinol is one of the naturally occurring active forms of vitamin A 12. Adequate provision of vitamin A results in reduced risk of vitamin A deficiency (VAD) hence decreased susceptibility to infections and impaired immune responses. The set tolerable upper intake level of retinol is at 3000 mg/day for adults and lower for children 13. Vitamin A fortificant in the form of retinyl palmitate is usually added to flour after milling 14,15. According to East African Community 15, the minimum and maximum regulatory levels of retinol for maize flour fortification are 0.5 mg/kg and 1.4 mg/kg respectively.
Despite various interventions including fortification initiatives in many nations, vitamin A deficiency is still a common public health concern 5. The effectiveness of fortification as an intervention to curb micronutrient deficiencies is hindered by non-compliance with fortification standards, which is not easily determined due to a lack of techniques for quickly determining the quantity of fortificants added. Laboratory analysis is essential in monitoring successful fortification by checking compliance with fortification standards 16. High-Performance Liquid Chromatography (HPLC) is a traditional technique that is used to quantify retinol in fortified maize flour as a way of monitoring compliance with fortification standards. However, due to the lengthy extraction operations, HPLC as a monitoring approach is time-consuming and tedious especially when a large number of samples are involved 17. Additionally, the use of HPLC for quantification of retinol in samples is highly prone to oxidation and many interfering compounds which is a source of likely errors in the method 18. There is a need, therefore, to develop a non-destructive, more accurate, and rapid technique for vitamin A determination such as the Fourier Transform Near-Infrared (FT-NIR) spectroscopy.
FT-NIR spectroscopy is a rapid analytical tool which allows the development of calibration models that can be used to predict various parameters in various food matrices 19. Calibration models are based on the association between the NIR spectrum and the chemical constituents of the food product 20. Successful NIR spectroscopy models have been developed for predicting starch 21, moisture 22, protein, oil, carbohydrates 23 and biochemical components such as amylose, lysine, tryptophan, and phytic acid in maize/corn flour samples 24.
There are limited studies on the application of NIR spectroscopy to predict micronutrients such as vitamins. Most industries and research centres still rely on wet chemistry methods to obtain accurate estimates of vitamins since little research has been conducted on the application of NIR spectroscopy. This study therefore aimed to investigate the prospects of applying near-infrared spectroscopy to predict retinol amounts fortified maize flour.
Materials and Methods
Sample Collection and Preparation
This study included 150 samples of randomly selected packaged fortified maize flours. The samples were collected from retail outlets, wholesale shops and supermarkets in ten counties in Kenya. These counties included: Nairobi (n-21), Kiambu (n-18), Uasin Gishu (n-16), Nakuru (n-17), Elgeyo-Marakwet (n-12), Kwale (n-11), Kilifi (n-10), Kisumu (n-15), Busia (n-13) and Mombasa (n-17) (Table 2). This was done to adequately represent millers from the Central, Eastern, Western and Coastal regions of Kenya. To avoid duplication, fortified maize flours from the same region under the same commercial brand names with similar batch numbers (identification numbers assigned to products made in the same manufacturing run) were pooled together. Thus, the maize flours included in the study were those belonging to different commercial brand names and those with different batch numbers within a brand. This resulted in a total of 150 samples. The different samples were mixed thoroughly using a commercial blender (Omniblend 1-TM-767) to ensure homogeneity. The homogenized fortified maize flour samples were then put in airtight zip-lock bags and kept in carton boxes at room temperature until the day of analysis. Storing samples in airtight zip-lock bags and carton boxes was done to reduce the adverse effects of environmental factors such as oxygen and light respectively.
Retinol Quantification using HPLC
Extraction and quantification of retinol in the form of retinyl palmitate was carried out according to the method described by Chepkoech, Sila and Orina 25. Two grams of flour was weighed into a centrifuge tube. This was followed by adding 15 ml of ethanol containing 0.1% (wt/vol) ascorbic acid and then 2 ml of 50 % (wt/vol) potassium hydroxide. The centrifuge tubes were capped, shaken well, and put in a water bath (Memmert WNB AC 230 V-50/60 HZ, Germany) at 80 ºC for 20 minutes. The tubes were shaken intermittently throughout this period. Using running water, the tubes were cooled before 15 ml of hexane containing 0.01% butylated hydroxytoluene (BHT) (wt/vol) was added. The contents of the tubes were thoroughly mixed on a vortex mixer for one minute, and after standing for two minutes, the contents of the tubes were again mixed for another minute. Two ml of cold water (1ºC) was added to each centrifuge tube and then the tubes were inverted 10 times. The samples were centrifuged at 1000 rpm for 10 min. Afterwards, the upper-organic layer was pipetted into a round-bottomed flask and the solvent was evaporated under vacuum at 40 ºC using a rotary vacuum evaporator (Hahnshin HS-2005S, water bath HS-3001, Korea). The residue was dissolved in 1 ml of methanol, and put in vials, ready for HPLC analysis. Twenty (20) µl of the sample was injected into reverse-phase HPLC (Shimadzu RF-20A, Japan) fitted with column C-18 ODS size 250 mm × 4.6 mm × 0.5 µm. The mobile phase was methanol and water in a ratio of 98:2 and the flow rate was 0.8 ml/min. A UV-visible diode-array detector (SPD – M20A) was used for the identification of retinol at 324 nm. Concentrations of retinol were calculated using peak areas of the samples and the standard curves of the retinol standards.
NIR Spectral Data Acquisition
Acquisition of NIR spectral data was done following the procedure outlined by Wafula et.al 26. Samples were thoroughly mixed before each scan. Three (3) sub-samples were drawn from each sample then transferred to a plastic cup measuring 10 cm in diameter, and put to about 3 cm deep. The scan range for the sub-samples was 12000 cm-1 to 4000 cm-1, and this was doneusing Bruker MPA (Multi-Purpose Analyzer) FT-NIR spectrometer fitted with a semi-conductor lead sulphide detector (RT-PbS). The integrating sphere was used to scan in reflectance mode at 30 ℃ with a resolution of 16 cm-1. For each sample, three independent spectra (as determined during preliminary research) were recorded, similar to the collection of reference values using HPLC. The calibration models were then constructed using these data in triplicate. The average number of scans was 64 for each spectrum obtained. The wavelength range was narrowed to 9000 cm-1 to 4000 cm-1 by visual assessment of the spectra, in order to remove noisy regions.
NIR Spectral Pre-processing
Spectral pre-processing was done using OPUS software 7.8, according to the method adapted from Bag, Srivastav and Mishra 27. This was done to reduce the prediction errors associated with spectral noise and the influences of temperature changes, particle size differences, light diffusion and baseline shifts on the NIR spectra while increasing signal from chemical information 28,29. Before calibration, the raw spectra were treated with a combination of multiple pre-processing techniques, including first derivative, second derivative, and standard normal variate (SNV). First derivative pre-processing technique was done to correct spectral baseline shifts while second derivative was used to improve spectral resolution. Standard normal variate (SNV) pre-processing technique was also employed to correct scatter in the spectra caused by path length variation occurring during scanning due to particle size differences between the samples. The most optimal pre-processing technique combination was first derivative + SNV. Additionally, before calibration, all spectral data were mean-centred. Mean centering (MC) was the basic pre-treatment used that reduced bias noise from all NIR spectra.
Calibration and Validation Set Sample Selection
The most ideal outcome of this study would have been the successful development of a single model capable of predicting retinol levels in fortified maize flour samples over a wide range of concentrations. However, a single calibration model for predicting retinol in fortified maize flour had a poor predictive capability hence the decision to develop two separate models. The fortified maize samples were grouped into two, retinol < 1.0 mg/kg and retinol ≥ 1.0 mg/kg (retinol values from HPLC). This resulted in two data sets used in developing two (2) separate models. For the two groups of data, samples used for calibration and validation were selected. The calibration and validation data sets were selected randomly in a way that they covered the whole range of the reference data. Calibration for model I was developed using 63 samples in the range of concentrations of 0 to 0.62 mg/kg retinol, whereas calibration for model II was developed using 37 samples in the range of concentrations of 1.0 to 3.32 mg/kg retinol (Table 1). A validation set of 31 samples and 19 samples were used for external validation of calibration for model I and model II respectively (Table 1).
Table 1: Mean, range, and standard deviation of calibration and validation data sets.
|
|
Calibration set |
Validation set |
||||||
|
|
n |
Range |
Mean |
SD |
n |
Range |
Mean |
SD |
|
< 1.0 mg/kg |
63 |
0-0.62 |
0.34 |
0.18 |
31 |
0-0.6 |
0.28 |
0.18 |
|
≥ 1.0 mg/kg |
37 |
1.0-3.32 |
1.47 |
0.53 |
19 |
1.0-2.89 |
1.34 |
0.43 |
Model Development and Validation
Model development and model validation using was done according to the method adapted from Wafula et.al 26. , as shown in Figure 1. Calibration models I and II were generated using OPUS software 7.8. The calibrations were derived by performing partial least squares regression (PLS-R) which correlated retinol reference values (y) with the pre-processed NIR spectra (x), meaning that retinol (y) was predicted from NIR spectra (x) using PLS-R. The default optimisation command of the OPUS software program, which combined the number of PLS factors, wavenumber ranges, and pre-treatment techniques, was used to choose the optimal model. In this study, only 5% of outlier samples with high errors were excluded from the calibration set. External validation was also done using the OPUS software to test the reliability of the models. For model validation, the samples used were independent of the calibration set.
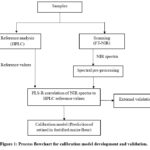 |
Figure 1: Process flowchart for calibration model development and validation. |
Statistical Evaluation
Microsoft Office Excel 2019 was used to calculate the means and standard deviations of the retinol values obtained from HPLC (reference values). The prediction potential of the developed FT-NIR calibration models was evaluated by statistical terms of coefficient of determination for calibration (R2c), and the root mean square error of estimation (RMSEE). The reliability of the generated models was assessed according to the coefficient of determination of validation (R2v), root mean square error of prediction (RMSEP), ratio of performance to deviation (RPD), and bias values.
Results and Discussion
Retinol Content of the Fortified Maize Flours
The retinol content of fortified maize flours measured using the HPLC method are shown in Table 2. The total retinol content ranged between 0 mg/kg ± 0.00 (not detectable) to 4.03 ± 0.82 mg/kg. Only 26.9 % of the analysed samples complied with the set standards for retinol (0.5-1.4 mg/kg), meaning that quite a number of samples did not meet the fortification requirements. This is somewhat comparable to the report of a study conducted by Khamila, Sila and Makokha 30 which showed that of the total samples evaluated, only 33.3% met the acceptable requirements for retinol, with levels in fortified maize flour samples ranging from below detectable levels to 1.2 mg/kg.
Samples with retinol concentrations lower than 0.499 mg/kg were considered under-fortified. Whereas samples with retinol levels above 1.4 mg/kg were termed over-fortified. Both of these sets of samples did not meet the regulatory requirements for compliance. Retinol is one of the micronutrients that is added to maize flour as a fortificant in the form of retinyl palmitate 14,15,31. Generally, the precision with which the chemical composition of the samples is determined using reliable and accepted reference procedures has a significant impact on the performance of the calibrations developed 32.
Table 2: HPLC retinol data used for FT-NIR spectroscopy modelling
|
County |
Sample size (n) |
Range (mg/kg) |
Mean (mg/kg) |
SD |
|
Nairobi |
21 |
0.00 – 4.03 |
0.96 |
0.94 |
|
Kiambu |
18 |
0.06 – 1.92 |
0.65 |
0.42 |
|
Uasin Gishu |
16 |
0.02 – 1.40 |
0.46 |
0.33 |
|
Nakuru |
17 |
0.00 – 1.67 |
0.45 |
0.53 |
|
Elgeyo-Marakwet |
12 |
0.00 – 0.75 |
0.19 |
0.25 |
|
Kwale |
11 |
0.00 – 0.76 |
0.27 |
0.28 |
|
Kilifi |
10 |
0.00 – 0.72 |
0.17 |
0.22 |
|
Kisumu |
15 |
0.01 – 0.64 |
0.23 |
0.22 |
|
Busia |
13 |
0.02 – 1.17 |
0.30 |
0.36 |
|
Mombasa |
17 |
0.00 – 0.72 |
0.30 |
0.24 |
NIR Spectra of Fortified Maize Flour
The characteristic raw/unprocessed spectra of the fortified maize flour samples are shown in Figure 2. From this visual representation it can be seen that although all spectra had very similar shapes, there was variation in absorbance. NIR spectroscopy studies on various parameters of maize flour samples reported by Plumier 21; Chen, Delaney and Johnson 22 and Egesel and Kahriman 23 generated spectral data with a comparable shape to this study’s samples. The fortified maize flour spectra generally resembled those of other agricultural products such as wheat 28 and common beans 26.
Absorption bands were linked to functional groups and compounds present in fortified maize flour samples. The dominant absorption bands included: 9000 cm-1 – 8000 cm-1 (second overtone C-H stretching), 6800 cm-1 – 6600 cm-1 (first overtone N-H stretching; first overtone O-H stretching), 5300 cm-1 – 5200 cm-1 (combination C-H stretching), 5000 cm-1 – 4700 cm-1 (combination N-H stretching; combination O-H stretching), and 4545 cm-1 – 4065 cm-1 (combination C-H stretching) 33. The peaks in the spectra before pre-processing could be explained by quite high amounts of carbohydrates, proteins, and an substantial levels of moisture and vitamins in maize flour 34,35. The absorption bands in 5000 cm-1 – 4700 cm-1 are associated with protein and moisture content in the samples while absorption at 5300 – 5200 cm-1 is associated with polysaccharides such as amylose and amylopectin. Retinol, a minor parameter, mainly consists of C-H-O molecular bonds 36. The absorption bands ranging from 4762 cm-1 – 4386 cm-1 are believed to be related to C-H-O structures such as retinol 37.
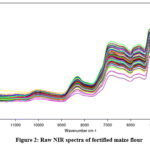 |
Figure 2: Raw NIR spectra of fortified maize flour |
PLS-R Models Predicting Retinol in Fortified Maize Flours
Successful building of a single model that has a capacity to predict retinol levels in fortified maize flour samples over a wide range of concentrations would have been the most ideal outcome of this study. However, as illustrated in Figure 3 a single calibration model to predict retinol in fortified maize flour had a poor predictive capability as demonstrated by low R2 (R2c = 0.20; R2v = 0.18), low RPD (1.11, 0.92) and high RMSE (RMSEE = 0.70; RMSEP = 0.81) values. An acceptable model should have a high R2, a low RMSE and an RPD higher than 2.5 38. There are several actual calibration scenarios where it is difficult to develop a single universal calibration equation for the full population of interest, resulting in a lack of a suitable model for all components 39. Various approaches to address non-linearity such as the use of new pre-treatment methods, the elimination of wavelengths, the addition of principal components/latent variables to the model or splitting the data into subsets or groups can be used 39. Based on this observation and knowledge, two separate models were developed to improve the model performance.
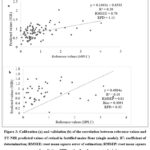 |
Figure 3: Calibration (a) and validation (b) of the correlation between reference values and FT-NIR predicted values of retinol in fortified maize flour (single model). |
It was observed that splitting the data into two groups, retinol < 1.0 mg/kg and retinol ≥ 1.0 mg/kg, resulted in models I and II, respectively that showed better prediction performance (Figures 3 and 4). The performance metrics for the single calibration model, models I and II are summarized in Table 3. This table shows that, in comparison to the single calibration model, the RMSEE and RMSEP values of models I and II were lower and the R2 values were higher.
Table 3: Calibration and external validation statistics for prediction of retinol in fortified maize flour according to the models developed
|
|
Single model |
Model I Retinol (< 1.0 mg/kg) |
Model II Retinol (≥ 1.0 mg/kg) |
|||
|
Statistics |
Calibration |
Validation |
Calibration |
Validation |
Calibration |
Validation |
|
R2 |
0.20 |
0.18 |
0.81 |
0.82 |
0.93 |
0.81 |
|
RMSEE |
0.70 |
– |
0.08 |
– |
0.16 |
– |
|
RMSEP |
– |
0.81 |
– |
0.09 |
– |
0.22 |
|
Bias |
– |
0.0091 |
– |
-0.0008 |
– |
-0.0046 |
|
RPD |
1.11 |
0.92 |
2.29 |
2.07 |
3.58 |
2.43 |
|
Rank |
8 |
8 |
7 |
7 |
8 |
8 |
R2: coefficient of determination; RMSEE: root mean square error of estimation; RMSEP: root mean square error of prediction; RPD: ratio of performance to deviation.
The R2c, RMSEE, and RPD before data splitting were 0.20, 0.70, and 1.11 respectively. Model I on the other hand achieved R2c, RMSEE, and RPD of 0.81, 0.08, and 2.29 respectively while model II showed equally good results with R2c, RMSEE, and RPD of 0.93, 0.16 and 3.58 respectively (Table 2 and Figures 4 & 5). When the models were applied to predict the retinol contents of the validation sets, the prediction results for model I were: R2v= 0.82, RMSEP= 0.09, bias = -0.00088, and RPD = 2.07 (Table 2 and Figure 4) while the prediction results for model II were: R2v= 0.81, RMSEP= 0.22, bias = -0.0046 and RPD = 2.43 (Table 2 and Figure 5). The reliability of the generated models was assessed according to R2v, RMSEP, RPD, and bias values. The models generally depicted high R2 values, low RMSEP values, and low bias values hence reliable for application 19,23.
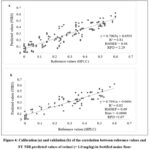 |
Figure 4: Calibration (a) and validation (b) of the correlation between reference values and FT-NIR predicted values of retinol (< 1.0 mg/kg) in fortified maize flour |
Comparing the two models, external validation indicated that the prediction errors (RMSEP) for model II were slightly higher (0.22) than those of model I (0.09). Model II had a fewer number of samples and this is probably why it had slightly higher errors for the RMSEP. Further, retinol estimates were negatively biased (bias = – 0.00088 and bias = -0.0046) for models I and II respectively (Figures 4 & 5). The bias value for an accurate calibration model should be close to 0 40. The average difference between the measured or reference values (x) and the NIRS estimate (y) is known as bias 41. A positive score indicates that the model is generally overestimating the composition by that amount, whereas a negative value indicates that the model is underestimating the composition 41,42. Although the models created would underestimate retinol amounts in fortified maize flour, the values were close to 0, indicating that the models developed were quite accurate and adequate, and hence can be adopted in food analysis.
Models I and II had R2v of above 0.8 which implies that these models were acceptable and usable for screening and some approximate calibrations according to de Girolamo, Cervellieri and Visconti 28. The RPD values, 2.07 (model I) and 2.43 (model II), according to Xia, Li, Zhao and Chang 43 indicate that model I had slightly lower robustness. When the prediction accuracy of calibration models is relatively insensitive to unknown changes in external factors, the model is said to be robust 44. Temperature fluctuations, shifts in wavelength, and changes in detector stability over time are some of the factors that could have impacted model performance. The RPD tests the robustness of a model by assessing how well the developed model predicts the retinol in the validation set, and the higher its value, the better the model’s prediction capacity 28,43,45. Regression models with RPD values ≥ 6.5 are excellent and suitable for process control or any application 43. Chang, Laird and Mausbach 46 however contrast by mentioning that calibration models with RPD > 2 are considered satisfactory.
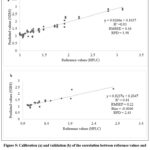 |
Figure 5: Calibration (a) and validation (b) of the correlation between reference values and FT-NIR predicted values of retinol (≥ 1.0 mg/kg) in fortified maize flour. |
Limited studies have been done on applying NIR spectroscopy to predict retinol in maize flour. For this reason, the discussion of this study’s findings was mostly limited to NIR studies on the prediction of retinol in various food matrices and the prediction of other parameters in maize flour. The work of Kahrıman, Onac, Oner and Egesel 47 obtained the following prediction performance of fat-soluble secondary metabolites in maize flour, carotenoids (R2v = 0.721; RMSECV = 3.069) and tocopherol (R2v = 0.515; RMSECV = 2.0943). The models presented in the current study showed higher R2v values and lower prediction errors than those of Kahrıman, Onac, Oner and Egesel 47 which applied NIR spectroscopy to predict carotenoids and tocopherol in maize flour. Furthermore, Soulat, Andueza, Graulet and Ferlay 48 reported a lower coefficient of determination (R2v = 0.34) for the prediction of retinol from cow’s milk. The prediction errors reported by Soulat, Andueza, Graulet and Ferlay 48 were slightly higher (RMSEP = 0.15) than those of model I (RMSEP = 0.09), and slightly lower than those of model II (RMSEP = 0.22). Altogether, the results of this study and those of the studies discussed here demonstrate that there is potential to successfully use NIR spectroscopy to rapidly assess retinol in different food matrices.
Conclusions
The range of retinol values used as reference values in this study (0 mg/kg ± 0.00 (not detectable) to 4.03 ± 0.82 mg/kg) comprised the retinol levels that may be routinely encountered in fortified maize flour in the market. Approximately 26.9% of the analysed samples met the retinol fortification standards (0.5-1.4 mg/kg), indicating that a significant proportion of samples did not meet the fortification requirements. Initially, a single calibration model showed poor predictive performance. The model predictive performance was improved by splitting the dataset, hence developing two separate models. The model developed for predicting retinol ≥ 1.0 mg/kg illustrated slightly better prediction performance than the model for predicting retinol < 1.0 mg/kg. The models developed in this study had high R2 values and low errors. FT-NIR spectroscopy can thus be utilised to adequately estimate retinol in fortified maize flour. NIRS, by replacing time-consuming and laborious wet chemistry laboratory procedures, has the potential to be used for rapid regulatory monitoring of fortification compliance for a large number of samples.
Recommendations
The robustness of the models can be improved in the future by the addition of more calibration data. Furthermore, linear discriminant analysis (LDA) studies should be done to generate an algorithm that will be used to differentiate the two prediction models developed (model I used to predict retinol < 1.0 mg/kg and model II used to predict retinol ≥ 1.0 mg/kg). This will help determine which of the two models is to be employed for predicting the amount of retinol in a specific unknown sample. FT-NIRS-based models for predicting B-vitamins in fortified maize flour should also be developed to allow quick analysis.
Acknowledgements
The authors thank the laboratory technicians, Charles Njogu, and John Muchuna of the Food Fortification Laboratory, JKUAT for their assistance.
Conflict of Interest
The authors declare no conflict of interest.
Funding Source
This study was funded by the European Union (EU) through Jomo Kenyatta University of Agriculture and Technology (JKUAT) (Grant number Food/2016/380-039).
References
- Bailey R. L., West K. P., Black R. E. The Epidemiology of Global Micronutrient Deficiencies. Ann Nutr Metab. 2015;66(suppl 2):22-33. doi:10.1159/000371618
CrossRef - Singh U., Praharaj C., Singh S., Singh N., eds. Biofortification of Food Crops.; 2016.
CrossRef - KNMS. The Kenya National Micronutrient Survey. Published online 2011:1-150. http://www.nutritionhealth.or.ke/wp-content/uploads/ Downloads/The Kenya National Micronutrient Survey 2011.pdf
- Harika R., Faber M., Samuel F., Mulugeta A., Kimiywe J., Eilander A. Are Low Intakes and Deficiencies in Iron, Vitamin A, Zinc, and Iodine of Public Health Concern in Ethiopian, Kenyan, Nigerian, and South African Children and Adolescents? Food Nutr Bull. 2017;38(3):405-427. doi:10.1177/0379572117715818
CrossRef - Ministry of Health. Kenya National Food Fortification Strategic Plan. Published online 2018:1-36.
- WHO. Preventing and Controlling Micronutrient Deficiencies in Populations Affected by an Emergency. 2007;1:5-6.
- Harrison G. G. Public Health Interrventions to Combat Micronutrient Deficiencies. Public Health Rev. 2010;32(1):256-266. https://publichealthreviews.biomedcentral.com/articles/10.1007/BF03391601
CrossRef - Dary O. Food Fortification Strategies. 2008;(Series 10):1-6.
- FAO. The Economic Lives of Smallholder Farmers. Food Agric Organ United Nations. Published online 2015:39. http://www.macrothink.org/ journal/index.php/rae/article/ View/6320%0Ahttp:// www.upov.int/ edocs/ mdocs/upov/en/upov_sym_ge_11/ upov_sym_ge_11_10.pdf %0Ahttp:// ajae.oxfordjournals.org/cgi/ doi/10.2307/1241587 %0Awww.iosrjournals.org%0Ahttp://link.springer.com/10.
- KALRO. Maize Extension Manual. 2021;(April).
- WHO. Recommendations on Wheat and Maize Flour Fortification. Meeting Report: Interim Consensus Statement. Published online 2009. http://www.who.int/nutrition/publications/micronutrients/wheat_maize_fort.pdf
- Carazo A., Macáková K., Matoušová K., Krčmová L. K., Protti M., Mladěnka P. Vitamin A Update: Forms, Sources, Kinetics, Detection, Function, Deficiency, Therapeutic Use and Toxicity. Nutrients. 2021;13(5). doi:10.3390/nu13051703
CrossRef - Fiedler J. L., Afidra R., Mugambi G., et al. Maize flour fortification in Africa: Markets, feasibility, coverage, and costs. Ann N Y Acad Sci. 2014;1312(1):26-39. doi:10.1111/nyas.12266
CrossRef - Allen L. B., Hurrell O.D. Global Progress – Food Fortification. UnscnOrg. Published online 2006:341. http://www.unscn.org/layout/ modules/ resources/files/fortification_eng.pdf
- East African Community. Draft East African Standard Fortified milled maize (corn) products – Specification. Published online 2011. http://www.eac-quality.net/fileadmin/eac_quality/user_documents/ 3_pdf/DEAS_768_2011_Fortified_milled_maize_products-_Specification
- GAIN. Fortifying Our Future.; 2015.
- Yang H., Irudayaraj J. Comparison of Near-infrared, Fourier Transform-infrared, and Fourier Transform-Raman methods for Determining Olive Pomace Oil Adulteration in Extra Virgin Olive Oil. JAOCS, J Am Oil Chem Soc. 2001;78(9):889-895. doi:10.1007/s11746-001-0360-6
CrossRef - Zhang Y., Zhou W. E., Yan J. Q., et al. A Review of the Extraction and Determination Methods of Thirteen Essential Vitamins to the Human Body: An Update from 2010. Molecules. 2018;23(6):1-25. doi:10.3390/molecules23061484
CrossRef - Reddy N. S., Yadav B. K. Non-Destructive Quality Assessment of Citrus Fruits Using FT-Near-Infrared Spectroscopy. Int J Scicence Environ Technol. 2016;5(4):1850-1860.
- Blanco M., Villarroya I. NIR Spectroscopy: A Rapid-Response Analytical Tool. TrAC – Trends Anal Chem. 2002;21(4):240-250. doi:10.1016/S0165-9936(02)00404-1
CrossRef - Plumier B.M. Modeling the Fourier Transform Near Infrared Spectra of Unreacted Starch in Corn. Published online 2013.
- Chen Y., Delaney L., Johnson S., Wendland P., Prata R. Using Near Infrared Spectroscopy to Determine Moisture And Starch Content Of Corn Processing Products. J Near Infrared Spectrosc. 2017;25(5):348-359. doi:10.1177/0967033517728146
CrossRef - Egesel C. Ö., Kahriman F. Determination of Quality Parameters in Maize Grain by NIR Reflectance Spectroscopy. Tarim Bilim Derg. 2012;18(1):31-42. doi:10.1501/tarimbil_0000001190
CrossRef - Kahrıman F., Onaç İ., Öner F., Mert F., Egesel C. Ö. Analysis of Secondary Biochemical Components in Maize Flour Samples by NIR (Near Infrared ) Spectroscopy. J Food Meas Charact. 2020;14(4):2320-2332. doi:10.1007/s11694-020-00479-0
CrossRef - Chepkoech B., Sila D. N., Orina I. N. Effect of Storage Condition on Retention of Vitamins in Selected Commercial Fortified Maize Flour in Kenya. Curr Res Nutr Food Sci. 2022;10(3):1140-1149. doi:10.12944/CRNFSJ.10.3.27
CrossRef - Wafula E. N., Wainaina I. N., Buvé C, et al. Application of Near-Infrared Spectroscopy to Predict the Cooking Times of Aged Common Beans (Phaseolus vulgaris L.). J Food Eng. 2020;284(November 2019). doi:10.1016/j.jfoodeng.2020.110056
CrossRef - Bag S. K., Srivastav P. P., Mishra H. N. FT-NIR Spectroscopy: A Rapid Method for Estimation of Moisture Content in Bael Pulp. Br Food J. 2011;113(4):494-504. doi:10.1108/00070701111123970
CrossRef - de Girolamo A., Pascale M. Rapid Analysis of Deoxynivalenol in Durum Wheat by FT-NIR Spectroscopy. Toxins (Basel). 2014;6(11):3129-3143. doi:10.3390/toxins6113129
CrossRef - Jiao Y., Li Z., Chen X., Fei S. Preprocessing Methods for Near-Infrared Spectrum Calibration. J Chemom. 2020;34(11):1-19. doi:10.1002/cem.3306
CrossRef - Khamila S., Sila D. N., Makokha A. Compliance Status and Stability of Vitamins and Minerals in Fortified Maize Flour in Kenya. Sci African. 2020;8. doi:10.1016/j.sciaf.2020.e00384
CrossRef - Grimm K. A., Sullivan K. M., Alasfoor D., et al. Iron-Fortified Wheat Flour and Iron Deficiency among Women. Food Nutr Bull. 2012;33(3):180-185. doi:10.1177/156482651203300302
CrossRef - Pasquini C. Near Infrared Spectroscopy: Fundamentals, Practical Aspects and Analytical Applications. J Braz Chem Soc. 2003;14(2):198-219. doi:10.1590/S0103-50532003000200006
CrossRef - Liu Y. Y., Tu Z. H., Chu Q. X. Differentially T-shape Slot Antenna with High Common-Mode Suppression for 2.4/5.2/5.8 GHz WLAN MIMO Systems. Asia-Pacific Microw Conf Proceedings, APMC. 2016;1. doi:10.1109/APMC.2015.7411767
CrossRef - Gwirtz J. A., Garcia-Casal M. N. Processing Maize Flour and Corn Meal Food Products. Ann N Y Acad Sci. 2014;1312(1):66-75. doi:10.1111/nyas.12299
CrossRef - Qamar S., Aslam M., Huyop F., Javed M. A. Comparative Study for the Determination of Nutritional Composition in Commercial and Noncommercial Maize Flours. Pakistan J Bot. 2017;49(2):519-523.
- Stefan M. A. Chiral Retinoid Derivatives : Synthesis and Structural Elucidation of a New Vitamin A Metabolite. Published online 2006. https://publikationsserver.tu-braunschweig.de/receive/dbbs_mods _00012504 %0A http://www.digibib.tu-bs.de/?docid=00012504
- Kusumiyati A., Munawar A. A., Suhandy D. Fast, Simultaneous and Contactless Assessment of Intact Mango Fruit by Means of Near Infrared Spectroscopy. AIMS Agric Food. 2021;6(1):172-184. doi:10.3934/AGRFOOD.2021011
CrossRef - Manley M. Near-Infrared Spectroscopy And Hyperspectral Imaging: Non-Destructive Analysis of Biological Materials. Chem Soc Rev. 2014;43(24):8200-8214. doi:10.1039/c4cs00062e
CrossRef - Agelet L. E., Hurburgh C. R. A Tutorial on Near Infrared Spectroscopy and its Calibration. Crit Rev Anal Chem. 2010;40(4):246-260. doi:10.1080/10408347.2010.515468
CrossRef - Elfadl E., Reinbrecht C., Claupein W. Development of Near Infrared Reflectance Spectroscopy (NIRS) Calibration Model for Estimation of Oil Content in a Worldwide Safflower Germplasm Collection. Int J Plant Prod. 2010;4(4):259-270. doi:10.22069/ijpp.2012.709
- Sajdak M., Kotyczka-Morańska M. Development and Validation of a Fast Method Based on Infrared Spectroscopy for Biochar Quality Assessment. Biomass and Bioenergy. 2018;112:99-109. doi:10.1016/j.biombioe.2018.02.019
CrossRef - Zhou Y., Vales M. I., Wang A., Zhang Z. Systematic Bias of Correlation Coefficient May Explain Negative Accuracy of Genomic Prediction. Brief Bioinform. 2017;18(5):744-753. doi:10.1093/bib/bbw064
CrossRef - Xia F., Li C., Zhao N., et al. Rapid Determination of Active Compounds and Antioxidant Activity of Okra Seeds using Fourier Transform Near Infrared (FT-NIR) Spectroscopy. Molecules. 2018;23(3). doi:10.3390/molecules23030550
CrossRef - Ketelaere B., Nieuwoudt H., Nicola B. M. Nondestructive Measurement of Fruit and Vegetable Quality by Means of NIR Spectroscopy : A Review. 2007;46:99-118. doi:10.1016/j.postharvbio.2007.06.024
CrossRef - Ribeiro J. P. O., Medeiros A. D., Caliari I. P., et al. FT-NIR and Linear Discriminant Analysis to Classify Chickpea Seeds Produced with Harvest Aid Chemicals. Food Chem. 2021;342:128324. doi:10.1016/j.foodchem.2020.128324
CrossRef - Chang C., Laird D., Mausbach M. J. Near-Infrared Reflectance Spectroscopy–Principal Components Regression Analyses of Soil Properties .Published online 2001. doi:10.2136/sssaj2001.652480x.
CrossRef - Kahrıman F., Onaç İ., Mert Türk F., Öner F., Egesel C. Ö. Determination of Carotenoid and Tocopherol Content in Maize Flour and Oil Samples using Near-Infrared Spectroscopy. Spectrosc Lett. 2019;52(8):473-481. doi:10.1080/00387010.2019.1671872
CrossRef - Soulat J., Andueza D., Graulet B., et al. Vitamin and Fatty Acid Contents in Cow Milk. Published online 2020.
Accepted on: 12 Oct 2023
Second Review by: Sunanda Biswas
Final Approval by: Dr. Jiwan S. Sidhu


Web of Science Coverage
Emerging Sources Citation Index (ESCI)
2024 Journal Impact Factor: 1.1
Scopus Journal Metrics
CiteScore 2025: 2.6
CiteScore Details
Sustainable Nutrition: Food Systems, Nutrient Retention, and Public Health Impact
![]()
This journal is a member of, and subscribes to the principles of, the Committee on Publication Ethics (COPE)


