Training of a Sensory Panel and its Correlation with Instrumental Methods: Texture of a Pseudo Plastic.
Julio Palmay-Paredes1
, Grace Medina-Galarza2*, Richer Guerra Vera1, Ana Campuzano Vera1, Cesar Hernandez1 1Agrarian University of Ecuador, Faculty of Agrarian Sciences “Dr. Jacobo Bucaram Ortiz”. Guayaquil/Guayas-Ecuador.
2Agrarian University of Ecuador, Research Institute “Ing. Jacobo Bucaram Ortiz, PhD.”, Guayaquil/Guayas-Ecuador.
3Technological University ECOTEC, Faculty of Health Sciences and Human Development. Guayaquil/Guayas-Ecuador.
Corresponding Author E-mail: grace.medina.galarza@uagraria.edu.ec
DOI : http://dx.doi.org/10.12944/CRNFSJ.11.3.36
Download this article as:
![]()
Sensory analysis is a scientific discipline with specific purposes, which measures and explores the stimuli perceived by the senses against different variants and whose results can be validated through instrumental methods. In the present study, the target was established utilizing convocation, selection, and training of a group of semi-trained judges to serve as a basis for the correlation of sensory analysis with instrumental analysis at the Agrarian University, Ecuador. The study was carried out in 2023 at the Agrarian University of Ecuador. A general call was made, where finalists were trained twice a week for one month as sensory judges in terms of hedonic scale and texture (adhesiveness, homogeneity, and viscosity) to determine different texture parameters, using as a preliminary test of capabilities, the evaluation of 3 different formulations of a dressing based on passion fruit juice and babaco. Once the treatment with the highest sensory acceptability was determined, an instrumental, microbiological, and physical-chemical analysis was conducted. The results were tabulated through an analysis of variance (ANOVA) using the Tukey 5% method with the RStudio statically data program. The research results from the call, 150 participants entered, of which 30 final panelists were determined who, through training, fulled the established requirements and, in turn, chose the second formulation of the dressing as the best treatment, which employs back extrusion test as an instrumental validation parameter, provided an overview of the relationship between sensory and instrumental analysis and its correlation. The correlation of the analyses to the texture profile evidenced the variability presented by the different treatments. Based on this, the present study emphasizes the importance of developing a comparison between sensory training with semi-trained judges and instrumental analyses, presenting a significant impact on the evaluation within the product development process. Assessing the strategic correlation of both approaches can provide a more comprehensive and balanced assessment of sensory quality, leveraging the strength of human subjectivity and the precision of instrumental measurements.
KEYWORDS:Hedonic Scale; Methods; Selection; Texture; Validation
Introduction
Sensory evaluation is a practice that has been used since ancient times whose purpose has been the acceptance or rejection of food products, it has allowed the development of knowledge of the perception of the sense organs and different sensory techniques.1 organs and different sensory techniques.1 Sensory analysis is a science used to evaluate, measure, analyze, and explain the response of food particularities that are observed and interpreted by the organoleptic stimuli of human sight, smell, taste, touch, and hearing.2, 3 Such a criterion is carried out through a trained and skilled sensory panel that allows them to establish a relevant judgment of the attributes of Interest in a portion of food.4 Sensory evaluations are essential in product development since they provide an assertive criterion on the organoleptic characteristics and acceptability of a product, where having specialized professionals, as well as the training of human resources, guarantees an accurate evaluation, determines consumer acceptance and reinforces this process in the food industry.5 Therefore, the relevance of sensory analysis lies in the acceptability information obtained from the behavior and organoleptic qualities that panelists perceive about a given product,6 where, thanks to the control of variables and the fact of having well defined methodologies, sensory evaluation yields objective and not subjective results, sensory evaluation yields objective and not subjective results that due to human nature can show significant variability in the data found due to cultural, educational, environmental aspects, habits, weaknesses, variability in sensory capabilities and predilection.7
Given that all methodologies, both quantitative and qualitative, present restrictions, it is necessary to use them jointly and in a complementary manner and, whenever feasible, to correlate them. By doing so, it is possible to obtain an integral vision, which leads to a complete understanding of sensory analysis and, consequently, will allow the design of products that satisfy consumer preferences.8
The quality and freshness of foods are mainly determined through the evaluation of their texture,9 since this encompasses the sensory and functional characteristics of foods.10 When a new product is developed, the first point of reference is usually the texturization system; in turn, consumers are accustomed to the characteristics of the products they have previously eaten, and this may have a predetermined expectation for the texture delivered in a new product.8 Based on this, instrumental analyses provide a broad picture of a food’s composition and textural characteristics.11
Several research projects have attempted to elucidate the effects and changes produced by components and ingredients within food systems directly related to the texture.12 Focused on this, the back extrusion test (reverse extrusion) provides different applications such as texturization malleability of samples for purposes determined in the textural properties of a viscoelastic fluid,13,14 being an empirical test that allows correlation with sensory analysis considering these test provide a repeatable, reproducible, and highly sensitive measurements of stickiness, toughness and hardness results.15 Based on the above, the comprehensive evaluation of food texture involves a multidisciplinary analysis where the combination, correlation of techniques, and statistical support represent the best alternatives as they provide convenient and valuable approaches.16
One of the main problems to control in terms of the texture of soups, sauces, and dressings is to develop the knowledge of how ingredients interact within particular systems and then have the ability to combine them by understanding what role they play in the development of a new product. To complete the cycle, an understanding of the different types of textures present in foods is necessary.8 Another relevant aspect of this product is that the mixture presents uniformity, and the distribution of the particles is homogeneous.
Therefore, products such as dressings and foods of variable texture and flavor result from the mixture of spices and other components such as salt, monosodium glutamate, and citric acid.17 Formulated with exotic fruits such as passion fruit (Passiflora edulis) enjoy a unique flavor given their excellent fruity aroma and sour taste.18 In contrast, dressings of fruits such as babaco (Carica pentagona) enjoy an umami flavor given their pineapple, papaya, and orange nuances.19 These organoleptic attributes are vital in products developed from the matrices mentioned above,20 making them suitable examples for sensory evaluations given their homogeneity.21
Based on the importance of sensory criteria as quality parameter measurers, the objective of this research was to convene, filter, train, and select a group of semi-trained judges to serve as a basis for the correlation of sensory analysis with instrumental analysis, an action required to determine the relationship index between both studies, where the instrumental analysis validates the results obtained from the semi-trained judges, for which a dressing was developed, the same that used passion fruit (Passiflora edulis) and babaco (Carica pentagona) as exotic fruits, also evaluating the physical-chemical requirements (pH and fat), microbiological (mesophilic aerobes, Staphylococcus aureus, total coliforms, molds, and yeasts), as a prevention protocol for the panelists, and instrumental (the Back extrusion test), as well as training a panel of tasters that will allow the development of new research in this field of study.
Materials and Methods
Strategy and design
In order to apply the correlation between sensory and instrumental analysis, several activities were designed and applied to a group of students from the Agrarian University of Ecuador from the Agroindustry career, with a previous concern to the participants, which consisted of recruitment, selection, training, and testing of skills related to sensory analysis specifically for the texture criterion, stages supported according to the methodology set out by ISO 8586-:2012,21 and ISO 6658:2012,22 and helpful previous researches.23,24 Upon completion of the process, a group of 30 panelists was selected and trained on different sensory stimuli topics referring to food texture. Once the panelists were trained, the texture prole was determined as a preliminary test with three samples of different formulations of passion fruit (Passiflora edulis) and babaco (Carica pentagona) dressing and a control product, the other hand; these samples were subjected to a compression-extrusion analysis with five repetitions in order to correlate the variables of the sensory analysis with the instrumental analysis and their relationship in the study to a passion fruit (Passiflora edulis) and babaco (Carica pentagona) dressing, in addition to mandatory specifications such as microbiological analysis according to the Colombian Technical Standard NTC 4305.25
The instrumental tests were statistically evaluated using a Completely Randomized Block Design model (RCBD) and an analysis of variance (ANOVA) with Tukey at 5% to demonstrate significant differences between the data collected, as well as Pearson’s, as well as Pearson’s correlation method, using the RStudio program in order to determine the relationship between the textural analyses.
Informed concern and ethical clearance of the test.
Sensory science, in addressing the human response to sensory stimuli, finds application in various areas, including the training of semi-trained judges. The selected judges were prepared with due diligence, involving specific instruction in the interpretation of sensory information to make informed and consistent decisions. Semi-trained judges received specialized training in the evaluation of evidence-based on sensory perceptions of texture. This training aimed to enhance the accuracy and impartiality in sensory evaluation decision-making by providing judges with the necessary tools and knowledge to comprehend and adequately assess the complexities of the presented samples.
The development of the sensory training program was supported by an ethical framework to ensure the integrity and well-being of the participants. Before commencing sensory training activities, we obtained ethical approval from an institutional review ethics committee comprised of experienced faculty members with expertise in sensory evaluation. This ethics review committee assessed the proposed sensory training protocol, ensuring its adherence to fundamental ethical principles, including the protection of participants’ privacy, transparency in provided information, and assurance that participation was voluntary and without coercion. Ethical authorization also addressed the proper handling of data collected during sensory training, confidentiality of participant information, and consideration of potential risks and benefits associated with participation. These considerations were crucial to ensuring the validity and integrity of the results obtained during the sensory evaluation process in food.
Sensorial panel design
Recruitment
The design applied for the development of a sensory screening; a call was made to university students between 18 and 23 years old with previous knowledge in sensory analysis, to whom a survey was made, previously validated by five professionals in sensory analysis and food engineering and oriented to know several parameters for the profile of sensory panelists to filter the suitable candidates for the pertinent purposes. Among the criteria consulted for selection were interest and motivation, attitude towards food, health, and determination in the non-consumption of alcohol, tobacco, or controlled substances (non-smokers, non-drinkers), absence to digestive or respiratory tract diseases, and oropharyngeal lesions. Once the call for applications was completed, the participation of individuals who did not meet the parameters of alcohol or controlled substances non-consumption and absences of diseases or injuries described above was discarded.
Selection
A form develops to select panelists considering sensory aptitude determinations and development of food thresholds tests, oriented previous methodologies.26The specific criteria were established according to ISO Standard 8586-1:2012, 21 focused on the parameters of recruitment and training of sensory panel leaders, and validated by five professionals with expertise in sensory analysis. 21
Once pre-selected, a second meeting was scheduled, where an introductory talk was given about sensory analysis and its importance in the food industry. In addition, a second pre-selection was carried out through different sensory tests in the mouth using techniques such as the flavor threshold using samples with different concentrations of cocoa. Chewiness was evaluated based on the number of chews on a fresh cheese sample. Finally, adhesiveness was determined based on the strength of food to adhere to the surface of the palate, represented by a descriptive scale of adhesiveness.
The data obtained from each evaluation were tabulated using a sensory analysis form with a maximum score of 10 and a minimum score of 7, according to the guidelines framed in the ISO 8586-1:2012,21 and ISO 6658:201222 regulations and general guidelines for sensory analysis, where the participants who met the minimum score were allowed access to the next phase of training.
Training
The participants who passed the selection process were trained for a month with an itinerary of twice a week in the horary to 15:00-17:00 pm in which they were trained in skills focused on aftertaste and sensory refinement through the tasting of different samples focused on texture parameters as general training according to the universal guidelines of ISO 8586-1:2012.21 The evaluation parameters in selecting the sensory panel focused on rheological attributes of texture, such as viscosity, homogeneity, and adhesiveness, with their respective weighting
Capacity check – official panel
From the first stages, the objective of achieving the necessary degree of sensitivity, precision, and accuracy of the judges, the final stage, or validation of capabilities, is aimed at controlling and maintaining the efficiency of the members of the official panel. These finalists acquired skills through training in evaluating the texture of various samples, as mentioned in previous sections. Additionally, as a preliminary texture test, three treatments of a dressing of passion fruit juice and babaco, with different concentrations of fruit, were formulated as a pseudo-plastic matrix, trials that were repeated three times for correct validation of the official panel.
Given the preliminary test, the dressing was formulated with variation in the percentage of babaco pulp and passion fruit juice corresponding to treatment 1 (T1) 30.12% of passion fruit juice and 60.18% of babaco pulp, Treatment 2 (T2) 60.18% of passion fruit juice and 30.12% of babaco pulp and Treatment 3 (T3) 45.15% of passion fruit juice and 45.15% of babaco pulp and Treatment 3 (T3) 45.15% of passion fruit juice and 45.15% of babaco pulp, In contrast, the control dressing was represented with the initial T0; in addition, a microbiological and physical-chemical analysis was carried out to analyze the microbiological and physical-chemical properties of the dressing. 15% passion fruit juice and 45.15% babaco pulp, while the control dressing will represent with the initial T0. In addition, a microbiological and physical-chemical analysis was carried out to ensure its safety and compliance with the quality specifications for the product developed and tested by the panelists.
Instrumental analysis
Instrumental tests were applied to the assigned treatments employing the Back extrusion test, which consists of exerting pressure on a sample by compression and extrusion of the same by the sides of the container, measuring viscosity, cohesiveness, and consistency,27 using the Texture Pro CT3 V 1.6 Build 26 equipment, where the results obtained were used in the correlation of the scope of the sensory analysis with the instrumental analysis through a statistical program.
Statistical analysis
The analysis of the data obtained was tabulated by analysis of variance (ANOVA) using the Tukey 5% method. For the correlation of the sensory and instrumental profile analysis in a team, the completely randomized block method (DBCA) was used through a statistical program called RStudio, which determines the Pearson correlation coefficient and presents the relationship between the instrumental and sensory tests through a Biplot graph.
The methods and techniques employed in this study, are describe in the table 1 and table 2, in function of the phase, methodology, target and materials used in each stage, were the stage 1 describes the recruitment and selection the candidates to conforming the sensorial panel.
Table 1: Design and methodology of sensory experimentation: Initial phase.
|
Phase |
Methodology |
Objective |
Materials |
|
Recruitment |
Research method through general guidelines for the selection, training, and follow-up of selected assessors and expert sensory evaluators (ISO 8586-1:2012). 21 |
Recruiting and selecting potential candidates through criteria and requirements. |
Development of a call through an access link with inclusion criteria for potential candidates with a survey format validated by five experts in sensory analysis belonging to the academic panel of the Agrarian University of Ecuador, focused on: Interest and motivation, non-consumption of alcohol, tobacco or controlled substances, absence to diseases of the digestive tract, respiratory tract or oropharyngeal lesions. |
|
Selection |
Research method through general guidelines for the selection, training and follow-up of selected assessors and expert sensory evaluators (ISO 8586-1:2012). 21 Use of a discriminative numerical scale from 1-7 (ISO 4121).28 Candidates that do not exceed 65% in texture discrimination will not be considered for the next phase (ISO 8586-1:2012)21 |
Communicate the purpose of the call
Evaluate the potential of candidates to describe and classify characteristics and attributes by sample type.
Selection of suitable staff
|
Application of an introductory talk about sensory analysis and its importance in the food industry.
Application of 3 discriminatory texture tests such as: Taste threshold: Tasting chocolate samples with different concentrations and ordering them from lowest to highest concentration. Adhesiveness: Following a scale from null to extremely high based on toffee candy samples. Chewiness: Establishing the number of chews required to disintegrate a 2 cm3 sample of fresh cheese.
Tasters that do not reach 70% in the evaluation do not pass to the next stage. |
Description of the activities applied in the development and sensory evaluation.
Table 2: Design and methodology of sensory experimentation: Final phase.
|
Phase |
Methodology |
Objective |
Materials |
|
Training |
Research method through general guidelines for the selection, training and follow-up of selected assessors and expert sensory evaluators (ISO 8586-1:2012).21 Attribute weighting and scales according to requirements ( ISO 4121).28 |
Familiarization with textural issues and determination of test rules and objectives.
Evaluate the potential of candidates to describe and describe and classify characteristics and attributes by sample type. |
A lecture was given on the textural attributes of foods and how they provide different characteristics to the mouth test.
A texture description test was applied using a minimum scale of 0 and a maximum scale of 4, the samples used were: Viscosity: (water, olive oil, honey and mustard). Adhesiveness: (pineapple jam, honey, mustard and mayonnaise). Homogeneity: (orange juice, peach nectar, tomato sauce, natural yogurt). |
|
Validation |
Establishing panelists aptitudes against a treatment with different concentrations using hedonic validation and discrimination scale (ISO 8586-1:2012)21 (NTP ISO 6658:2015)22 |
Communication of objectives and prioritization of skills validation.
Validation and constitution of the sensory panel |
A knowledge update focused on textural characteristics of dressings and sauces. Validation of the skills of the finalist panelists by tasting 3 different formulations of the same matrix (passion fruit and babaco juice dressing) with different concentrations. T1: 30.12% passion fruit juice and 60.18% babaco pulp. T2: 60.18% passion fruit juice and 30.12% babaco pulp. T3: 45.15% passion fruit juice and 45.15% babaco pulp. Weighting by hedonic scale and numerical discrimination method. |
Description of the final activities applied in the development and sensory evaluation.
Results and Discussion
Sensorial analysis
Recruitment and selection of panelist for sensory analysis
For the confirmation of the panelists, once the call was developed, 89 applicants were received, to whom a validated survey of skills and characteristics was applied, which filtered the applicants according to their alcohol and tobacco consumption habits (non-smoker, non-drinker), in addition to other criteria such as the use of oral health devices and other diseases that interfere with the sensitivity necessary for the organoleptic analysis, resulting in 72 pre-selected applicants who entered the selection phase established in the recruitment regarding aspects that interfere with the correct sensory analysis, such as age.7
Once the applicants were pre-selected, a sensory threshold test was applied concerning chewiness, sweetness intensity, and adhesiveness, to which 51 were submitted. The selection to be part of the group of sensory panels was based on the score obtained in the test, forming a final panel of 30 judges who met the requirements throughout the selection process.
Specific training was developed on food texture parameters based on texture tests such as hardness, stickiness, cohesiveness, elasticity, viscosity, chewiness, and friability in order to sharpen the perception of their sense organs with periodic training of 2 hours per day for a month with an itinerary of 2 times per week. During this training period, the panelists acquired a qualitative and quantitative frame of reference concerning the main textural attributes of foods and, specifically, dressings; the validation phase comprised six triangular tests with different dressing formulations and commercial treatments.
The final evaluation of the capabilities was based on texture tests, such as cohesiveness, elasticity, viscosity, and friability, applied to a dressing formulation that functions as a pseudo-plastic matrix. This analysis, strengthens the rheological characterization and understanding of the complex composition of food products, which play an essential role in market acceptability.29,30
The importance of training and the number of participants are fundamental aspects that can potentially affect sensory scores, leading to inaccurate interpretations,31,32 throughout the panel design, which followed the guidelines established according to various experimental research.
Sensory acceptability analysis
The design of a sensory panel with semi-trained judges is crucial for the development of new food formulations. The rheological attributes of a food must be validated through sensory analysis,33 which guarantees its acceptability in a specific market and also, complies with research and measurement activities validated by expert bodies.4
Table 3: Mean values and standard deviation of the global perception of color, flavor and odor attributes.
|
Treatments |
Flavor |
Color |
Odor |
|
T1 |
3.48 |
3.3b |
3.26 |
|
T2 |
3.48 |
3.91a |
3.57 |
|
T3 |
3.35 |
3.74ab |
3.48 |
|
E.E |
0.21 |
0.14 |
0.17 |
a>b Different letters between columns indicate significant statistical difference (p<0.05).
As shown in Table 2, a significant interaction observed in the results of sensory acceptability in terms of flavor, color, and odor, where treatment 2, consisting of 60.18% passion fruit juice and 30.12% babaco, received a favorable rating in the hedonic evaluations, which positions it as the option with the most appreciated aftertaste, a result related to the specific nature and composition of the dressing, which contributes to the textural and sensory properties changing during the testing process.34 Limits also within the range allowed by the Colombian Technical Standard NTC 4305:2008,25 which indicates that the formulation meets the criteria established as a product suitable for human consumption. In recent years, dressings have received increasing attention in the food industry due to greater consumer demand as a healthy food option.35
Sensorial analysis: texture
Table 3 shows the texture parameters analyzed, showing that the T2, T3 treatment presented greater homogeneity but low viscosity, regarding adhesiveness no significant differences were observed, while treatment 1 presented greater similarity to the control treatment in homogeneity and viscosity.35 Salad dressings have a characteristic flavor and viscosity.36 These properties are attributed to the presence of xanthan gum, which causes a molecule-to-molecule interaction, increasing the viscosity in compositions with fruits according to their concentration,37 such as the ones analyzed.
Table 4: Mean values and overall standard error of the sensory texture profile analysis evaluation.
|
Treatments |
Adhesivity |
Homogeneity |
Viscosity |
|
T0 |
0.13 |
-0.43b |
2.91a |
|
T1 |
0.87 |
1.17ab |
2.04ab |
|
T2 |
0.65 |
1.61a |
0.57b |
|
T3 |
0.96 |
2.09a |
0.43b |
|
E.E |
0.42 |
0.51 |
0.45 |
a>b Different letters between columns indicate significant statistical difference (p<0.05).
Regarding the texture sensory analysis indicated in Table 4, it is possible to indicate that the treatment similar to the control treatment was T1 in relation to the homogeneity parameter, indicating that both formulations showed uniformity and consistency in their structure and reasonable distribution of ingredients. This is because T1 includes the formulation with a higher content of babaco pulp, an ingredient with higher viscosity compared to passion fruit, giving a similar appearance to the dressing using it as a control.
Instrumental analysis: Back extrusion test
The back extrusion test allowed the characterization of the behavior of highly viscous materials used in the dressing preparation, which presents a good correlation with the conventional technique. The Back extrusion tests provide a valuable and straightforward technique to evaluate the yield strength of viscoelastic materials through equivalent flow and sliding on vessel walls.13
The evaluation of the rheological properties of cohesion, consistency, and viscosity of the three proposed treatments, as well as the reference sample that corresponds to the formulation of a commercial dressing, showed significant differences, as detailed in Table 5.
Table 5: Mean values and overall standard error of instrumental texture profile measurements.
|
Treatments |
Cohesivity |
Consistency |
Viscosity |
|
T0 |
332.47a |
543.78c |
213.68a |
|
T1 |
250.96b |
914.88a |
120.81c |
|
T2 |
161.74c |
592.13bc |
139.55bc |
|
T3 |
202.71bc |
659.91b |
160.92b |
|
E.E |
16.03 |
28.48 |
8.61 |
a>c Different letters between columns indicate significant statistical difference (p<0.05).
According to the results indicated in Table 5, Treatment 2 is the one that shows statistical similarity to the control treatment regarding the consistency criterion, relating this criterion to the resistance of both formulations to the mechanical force exerted during the analysis. A dressing with an appropriate consistency is less prone to phase separation or undesired changes in structure; this attribute can be related to critical aspects of the formulation, as in the case of T2, which includes a formulation with a higher proportion of passion fruit pulp, thereby increasing the product’s pH. An adequate level of acidity can help maintain a stable emulsion, prevent phase separation, and act as an agent contributing to a lighter and smoother consistency.38
The average results of the treatments indicate that the characteristics of the commercial products, represented by the control T0, present notable discrepancies for the formulations proposed. Likewise, statistically significant differences (p > 0.05) were observed between treatments, attributable to variations in the concentration of each formulation and the intra-molecular and electrostatic interaction between the polar molecules of the water and the polyelectrolyte of the juices.37
In general terms, the use of sensory and instrumental analysis is of great relevance, where the use of sensory analysis allows the determination of flavor variability, while improvements in rheological characteristics are adjusted to the texture parameters required according to the legislation in force in each territory.27
Correlation between instrumental and sensorial analysis.
Although sensory analysis and consumer research are essential tools for product development, innovative technologies and technological methodologies should continue to be explored and applied in food analysis,2 the correlation of the data obtained determined the positive and negative relationship between the variables, as determined in Table 6.
Table 6: Correlation index between sensory and instrumental attributes.
|
|
Sensorial |
Instrumental |
||||
|
|
Adhesivity |
Homogeneity |
Viscosity S |
Consistency |
Cohesivity |
Viscosity I |
|
Adhesivity |
1.00* |
1.00* |
0.20 |
0.46 |
0.53 |
|
|
Homogeneity |
1.00* |
1.00* |
0.20 |
0.46 |
0.53 |
|
|
Viscosity S |
1.00* |
1.00* |
0.20 |
0.46 |
0.53 |
|
|
Consistency |
0.20 |
0.20 |
0.20 |
0.96 |
-0.72 |
|
|
Cohesivity |
0.46 |
0.46 |
0.46 |
0.96 |
-0.51 |
|
|
Viscosity I |
0.53 |
0.53 |
0.53 |
-0.72 |
-0.51 |
|
Pearson’s correlation (*) attributes with the highest correlation between them.
As shown in Table 6, the relationship between sensory attributes given the hedonic scale determined a perfect correlation of the judges against Treatment 2; this is due to the rheological attributes measurable by a semi-trained panel on a universal scale, where, the presence of passion fruit as a component of the sample improves organoleptic characteristics and provides an excellent stability, which is consistent with the nature of the sample given that a dressing formulated with a higher content of passion fruit juice than babaco was tested.37
A relationship between instrumental and sensory textural attributes was determined, with three variables, the results show a positively high correlation of 0.96 between instrumental consistency and cohesiveness due to the nature of the dressing, given its texture and homogeneity. There is a low correlation between sensory and instrumental viscosity despite maintaining the same approach; this can where explained for the presence of saliva, this can influence the evaluation, causing discrepancies between attributes. Therefore, instrumental and sensory texture attributes were not determined to have a closely established relationship due to the variability of the results.39
The variability of results focuses on the importance of performing the analysis of both types of food texture tests; this reinforces the need for them and encourages the effectiveness and good use of resources,40 in turn, reveals the importance of the correct formulation and the need to implement instrumental techniques to characterize the texture in food.39 A sample of this data relation can be explained in the figure 1.
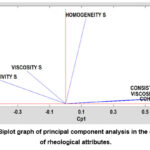 |
Figure 1: Biplot graph of principal component analysis in the correlation of rheological attributes. |
As shown in Figure 1, the component plot reflects the marked positive correlation between sensory attributes and the slope of instrumental characteristics, determined mainly by the evaluation scale used in the sensory analysis and the saliva interaction absent in the instrumental test. These findings reinforce the importance of choosing appropriate ingredients and concentrations that allow a correct analysis between both analyses.41
Conclusions
Since the objective of the production of food and beverages is the consumer, its final evaluation involves integrating the application of the senses; consequently, the adequate formation of judges in a sensory panel determines the reliability of the results based on the adequate classification of members and their training, as demonstrated in the classification of 150 applicants in 30 judges. The selection of treatment 2 with the highest acceptability complies with the safety measures in the tasting of samples established by the Colombian Technical Standard NTC 4305:2008,25 being considered innocuous for a possible consumer.
In the sensory texture analysis, the semi-trained judges determined that the treatment most similar to the control treatment was treatment 1, unlike the instrumental texture analysis, where differences were observed between all treatments due to their formulation.
The preliminary results obtained in this study indicate a high relationship between sensorial parameters. However, the result of the correlation shows us a difference in statistical analysis, showing us all the treatments are statistically different. Therefore, it is necessary to carry out more correlation tests between these parameters since the variability between the different treatments according to their texture behavior was evidenced, as well as the importance of both analyses in the sensory acceptance and stability of rheological attributes.
Acknowledgement
All the authors are highly thankful to the Research Institute “Dr. Jacobo Bucaram Ortiz”, and all who make this study possible.
Conflict of Interest
The authors declare that, they have no conflict of interest.
Funding Sources
This investigation received financial support from the Research Institute “Dr. Jacobo Bucaram Ortiz” with the project in course named sensorial analysis in a pseudo plastic and their correlation with the instrumental analysis.
References
- Stone, H.; Bleibaum, R.; Thomas, H. Sensory evaluation practices. Fifth edition. San Diego, Ca, United States: Academic Press, 2021.
- Ruiz, C.; Herrero, A.; Pintado, T.; Delgado, G. Sensory analysis and consumer research in new meat products development. Foods. 2021;10(2) 02-15.
CrossRef - Stone, H.; Sidel, J. Introduction to Sensory Evaluation. Sensory Evaluation Practices, 2004; 1-19.
CrossRef - Carduza, F.; Champredonde, M.; Casablanca. F. Sensory evaluation panels in the identification and characterization of typical foods. Lessons learned from the construction of the GI of Colonia Caroya Salami. Iberoamerican Journal of Viticulture, Agribusiness and Rurality. 2016;8(3):24-40.
- Dominicus, F.; Yohanne, J.; Witness. K. Implication of sensory evaluation and quality assessment in food product development: A review. Nutrition and food Science. 2020;8(30):690-702.
CrossRef - Mukhopadhyay, S.; Majumdar, T.; Goswami, K. Fuzzy logic approach (similarity analysis) for sensory evaluation of chhana podo. LWT – Food Science and Technology. 2013;53(1):204-210
CrossRef - Saveriano, P. What is sensory evaluation and how is it used? Inter Disciplina. 2019;7(19):47-68.
- Sheldrake, P. Controlling textures in soups, sauces and dressings. In Texture in food, The Netherlands: AVEBE, 2003; 389-421
CrossRef - Villa, V. Determination of shelf life by accelerated shelf life testing (ASLT) of an extruded product enriched with squid (Dosidicus gigas) protein concentrate. Lima-Peru: National Agrarian University La Molina. 2019.
- Day, L.; Golding, M. Food structure, rheology, and texture. Module in Food Science, 2016; 9125-129.
CrossRef - Zumbado, H. Introduction to Instrumental Food Analysis. Applications of instrumental methods in scientific research. EdUnin University Publishing. La Habana. 2021; 496-497
- Fischer, P.; Windhab. E. Rheology of food materials. Current Opinion in Colloid & Interface Science. 2011. 16(1);36-40.
CrossRef - Perrot, A.; Melinge, Y.; Estelle, P.; Rangeard, D.; Lanos, C. The Back extrusion test as a technique for determining the rheological and tri biological behavior of yield stress fluids at low shear rates. Applied Rheology. 2011. 21;53642. doi: 10.3933/ApplRheol-21-53642
- Kilcast, D.; Fillion. L. Understanding consumer requirements for fruit and vegetable texture. Nutrition & Food Science. 2001;31(5):221-225. doi: 10.1108/00346650110396574
CrossRef - Kaewsorn K, Maichoon P, Pornchaloempong P, Krusong W, Sirisomboon P, Tanaka M, Kojima T. Evaluation of precision and sensitivity of back extrusion test for measuring textural qualities of cooked germinated brown rice in production process. Foods. 2023; 12(16):3090.
CrossRef - Li, P.; Wu, G.; Yang, D.; Zhang, H.; Qi, X.; Jin, Q.; Wang, X. Applying sensory and instrumental techniques to evaluate the texture of French fries from fast food restaurant. Journal of texture studies. 2020; 51: 521–531.
CrossRef - Smiechowska, M.; Newerli, J.; Skotnicka, M. Spices and Seasoning Mixes in European Union. Innovation and Ensuring Safety foods. 2021;10(2289): 3-20.
CrossRef - Marín, B.; Hincapié, G.; Barajas, J. Identification of post-harvest technologies and their effect on shelf life in passifloraceous fruits. A literature review. Sena Journal. 2022; 26-45.
- Robles, A.; Herrera, L.; Torres. R. Babaco (Vasconcellea heilbornii var. pentagona Badillo). Main phytopathogenic agents and control strategies. Agriola Center. 2016;43(2): 26-58.
- Morondino, M.; Ferratto, J. Sensory analysis, a tool for quality evaluation from the consumer’s point of view. Agro messages. 2006;18: 23-45.
- ISO 8686-1. Sensory analysis ISO 8586:2012. General guide for the selection, training and control of judges. Part 1: Tasters. International Organization for Standardization. 2012.
- ISO 6658. Sensory analysis: Methodology and general guidelines. International Organization for Standardization, 2012.
- Flores, N. Training of a sensory evaluation panel for the nutrition department of the medical school of the university of Chile. Graduate thesis. Santiago – Chile: Faculty of Chemical and Pharmaceutical Sciences, 2015.
- Puma, G.; Núñez, C. Determination of the sensory texture profile of two experimental samples of chicken (Gallus gallus) hot-dog obtained by Kansei Type II Engineering. Scientific Annals. 2018; 79(1): 210-217. https://dialnet.unirioja.es/servlet/articulo?codigo=6490050
CrossRef - NTC 4305. Colombian Technical Standard 4305: 2008 food industries. Sauce or salad dressing. Colombian Institute of Technical Standards and Certification ICONTEC. 2008.
- Sipos, L.; Nyitrai, A.; Hitka, G.; Friedrich, L.; Kókai, Z. Sensory Panel Performance Evaluation-Comprehensive. Review of Practical Approaches. Applied sciences MDPI. 2021;11: 56-80. https://www.mdpi.com/2076-3417/11/24/1197
CrossRef - Millán, L.; Cardona, B.; Herrera, J.; Arbeláez, D.; Gutiérrez, D. Sensory and instrumental analysis (texture) of a sweet and sour borojo sauce. Lasallian Research Journal. 2010;36(41): 36-41. https://www.redalyc.org/pdf/695/69514965005.pdf
- ISO 4121. Sensory analysis: Guidelines for the use of quantitative response scales. International Organization for Standardization. 2003.
- Carregari, T.; Villalba, S.; Peixoto, L.; Ribeiro, E.; Saraiva, R.; Correa, R. Physical properties and molecular interactions applied to food: Processing and formulation. Processes, 2023: 2-26.
- Swiader, K.; Marczewska, M. Trends of using sensory evaluation in new product development in the food industry in countries that belong to the EIT regional innovation scheme. Foods. 2021; 10(446): 2-18.
CrossRef - Fiorentini, M.; Kinchlay, J.; Nolden, Y. Role of sensory evaluation in consumer acceptance of plant-based meat analogs and meat extenders: A scoping review. Foods. 2020;9(9): 2-15.
CrossRef - Gutiérrez, N.; Barrera, O. Selection and training of a panel in sensory analysis of Coffea arabica L. coffee. Journal of Agricultural Sciences. 2015;32(2): 77-87.
CrossRef - Aktar, T.; Upadhyay, R.; Chen, J. Sensory and oral processing of semisolid. Rheology of semisolid foods, de H Joyner. 2019; 231-412. Springer Nature Switzerland. doi: https://doi.org/10.1007/978-3-030-27134-3
CrossRef - Gomes, J.; Gomes, E.; Minim, V.; Andrade, N. Protein-based fat substitute. Ceres Journal. 2008;55(6): 543-550.
- Whaley, J.; Templeton, C.; Anvari, M. Rheological testing for semisolid foods: Traditional rheometry. In Rheology of semisolid foods, de H Joyner. 2019; 72-412. Springer Nature Switzerland.
CrossRef - Ramírez, M.; Baigts, D.Effect of heat treatment on the rheological behavior of habanero Chile (capsicum chinense) sauces with guar and xanthan gum additives. Agro science. 2016; 55(7): 837-847.
- Salehi, F. Quality, physicochemical, and textural properties of dairy products containing fruits and vegetables: A review. Food Science and Nutrition. 2021;9: 4666–4686.
CrossRef - Guzey, D.; McClements, D. J. Formation, stability and properties of multilayer emulsions for application in the food industry. Advances in colloid and interface science, 2006;128: 227-248.
CrossRef - Mirazimi, F.; Saldo, J.; Sepulcre, F.; Pujola, M. Study the correlation between the instrumental and sensory evaluation of 3D‑printed protein‑fortified potato puree. European Food Research and Technology. 2023; 249: 1669–1675.
CrossRef - Bejaei, M.; Stanich, K.; Cliff, M. Modelling and classification of apple textural attributes using sensory, instrumental and compositional analyses. Foods. 2021;10(2): 384-396. doi: https://doi.org/10.3390/foods10020384
CrossRef - Peh, J.; Lim, W.; Tha Goh, K.; Dharmawan., J. Correlation between instrumental and sensory properties of texture-modified carrot pure. Journal of Texture Studies. 2021; 553(1): 72-80.
CrossRef
Scopus Citation(s): 5
Accepted on: 20 Dec 2023
Second Review by: Wahyudi David
Final Approval by: Dr. Angelo Maria


Web of Science Coverage
Emerging Sources Citation Index (ESCI)
2024 Journal Impact Factor: 1.1
Scopus Journal Metrics
CiteScore 2025: 2.6
CiteScore Details
Sustainable Nutrition: Food Systems, Nutrient Retention, and Public Health Impact
![]()
This journal is a member of, and subscribes to the principles of, the Committee on Publication Ethics (COPE)


