Dietary Patterns and Common Diseases in Chinese Elderly: Exploring Associations and Providing Guidance for Personalized Interventions
 , HE Jingchun2,LI Yimiao1,ZHANG Zhijun3,ZHANG Nan1,WANG Lan1*
 1School of Nursing, Tianjin Medical University, Tianjin, China
2Department of Respiratory and Critical Care Medicine, Tianjin Fourth Central Hospital, Tianjin, China
3Department of Urology, Peking Union Medical College Hospital, Chinese Academy of Medical Sciences and Peking Union Medical College, Beijing, China.
Corresponding Author E-mail: wangl0423@tmu.edu.cn
DOI : http://dx.doi.org/10.12944/CRNFSJ.11.3.29
Download this article as:
![]()
The current state of geriatric disease prevention and treatment in China has not yet been able to meet the urgent needs brought about by an aging population, and specific dietary patterns can significantly improve or exacerbate the risk of certain diseases. However, the relationship between geriatric diseases and the dietary patterns of the Chinese elderly population has not been fully explored. CLHLS 2018 were analyzed in the present study. Principal component analysis was employed to identify the main dietary patterns of the Chinese elderly, and binary logistic regression models were used to analyze the associations between these dietary patterns and the 16 common diseases. Four main dietary patterns were identified in the Chinese elderly population: Egg-Milk Pattern, Salt-preserved vegetable-Nut Pattern, Vegetable-Fruit Pattern, and Fish-Meat Pattern. Higher scores for the Egg-Milk Pattern were associated with a greater risk of heart disease, stroke or cardiovascular disease, respiratory disease, glaucoma, prostate tumor, and Parkinson's disease in older adults (p<0.05). Higher scores for Salt-preserved vegetable-Nut Pattern correlated with a greater risk of hypertension, heart disease, and uterine tumors and a lower risk of rheumatism or rheumatoid disease in older adults (P<0.05). The higher scores of the Vegetable-Fruit Pattern were associated with a lower risk of heart disease in older adults (p<0.05). Finally, higher scores of the Fish-Meat Pattern correlated with a lower risk of heart disease, stroke, and cardiovascular disease and a greater risk of rheumatic or rheumatoid disease in older adults (p<0.05). The same dietary pattern may have contrasting effects on different diseases. The correlations between dietary patterns and diseases derived from this study may provide a basis for the prevention and individualized management of diseases in the elderly.
KEYWORDS:China; Common Diseases; Dietary Pattern; The Elderly
Introduction
According to World Population Prospects, the global aging rate will reach nearly 16% in 2050.1. Current evidence suggests that the Chinese population aged 60 and above has reached 260 million, accounting for 18.7% of the total population 2. It is expected that by 2050, the elderly population in China will account for 26.9% of the total population 3. Age-related health problems reportedly pose a significant challenge in China’s aging population, as the physiological and immune functions of the elderly gradually deteriorate, opening the door to common geriatric diseases, which have emerged as a substantial but often overlooked threat to the well-being and longevity of the elderly 4. However, the current state of geriatric disease prevention and treatment in China falls short of addressing the pressing needs imposed by the aging population 5.
It is important to prolong or reverse the onset of age-related diseases through health behavioural interventions. Diet is an important factor influencing disease trajectory 6, and it is primarily used to prevent disease by altering gut microbiota patterns to enable the body to build immune tolerance and influence disease development through antioxidant and anti-inflammatory components of food 7. The study of a single food or nutrient is not a robust indicator of the effect of the overall food combination. In contrast, dietary patterns can reflect the overall dietary intake of an individual and assess the complex combination of food components and nutrients. Importantly, the interaction and cumulative effect of dietary factors in the development of the disease can be comprehensively assessed through the study of dietary patterns 8. Some studies have shown that specific dietary patterns significantly ameliorate or worsen the risk of certain diseases. A study revealed that a flour- or meat-based dietary pattern significantly increased the risk of non-alcoholic fatty liver disease in the Korean adult population 9. Besides, in a Spanish population of children aged 6-7 years, a dietary pattern of fat and sugar significantly reduced the risk of asthma 10. Last but not least, it has been reported that a Western dietary pattern significantly increased the risk of pre-diabetes, and a mainland dietary pattern reduced the risk of pre-diabetes in the Taiwanese population 11. However, most existing studies have been limited to one disease 9-11, and the relationship between multiple geriatric diseases and dietary patterns remains unclear. The dietary patterns in the current literature may not apply to the Chinese elderly population, given the wide variation in dietary habits among people born in different countries.
The Chinese Longitudinal Healthy Longevity Survey (CLHLS) is the largest study on older people in China and the world regarding healthy longevity 12. The database records the intake status of 13 common types of food and the prevalence of 16 common diseases using the simple food chart method. In recent years, scholars have used this data as a basis to analyze the association between dietary diversity and physical function in Chinese older adults 13, the association between anti-inflammatory dietary diversity and depressive symptoms 14, and the association between chronic disease co-morbidity and cognitive function, physical function, and mortality 14. The data are considered a good representation of dietary intake and prevalence in Chinese older adults. Based on the CLHLS 2018 cross-sectional data, our study aims to establish the link between dietary patterns and a range of geriatric diseases among older adults in China, with the objective of formulating tailored dietary guidance protocols for older patients with diverse diseases.
Construction and content
Data Source and Subjects
CLHLS, initiated in 1998, was a prospective study conducted among Chinese older adults15. CLHLS involved 16 common geriatric diseases in Chinese older adults, involving hypertension, diabetes, heart disease, stroke or cardiovascular disease, respiratory disease (bronchitis, emphysema, pneumonia, asthma), glaucoma, prostate tumor, gastric or duodenal ulcer, Parkinson’s disease, arthritis, epilepsy, cholecystitis or cholelithiasis, rheumatic or rheumatoid disease, chronic nephritis, uterine tumor, and hepatitis.
Information on all patients was extracted from the CLHLS database in 2018. All participants in the CLHLS 2018 database were included in the present study. Participants aged less than 60 years, those with insufficient diet-related information, and those with missing disease-related data were excluded.To ensure a large sample size, this study screened the elderly population for different diseases on a case-by-case basis. Figure 1 shows a detailed flowchart depicting the participant screening process.
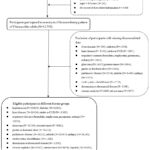 |
Figure 1: Participant selection process. |
Assessment of Dietary Pattern
In this study, the 13 food types surveyed in the CLHLS database using the simple food frequency table method were used to analyze the main dietary patterns of older Chinese people. These food types included fresh fruits, fresh vegetables, meat, fish, eggs, soybean products, salted vegetables, sugar, garlic, dairy products, nut products, mushrooms or algae, and tea. The food intake was recorded according to the original questionnaire, and the frequency of each food was redefined in this study based on the study by Aihemaitijiang S 12. In this study, “high frequency intake” was represented by the code “1” and included categories such as “Every day/almost every day,” “Often,” “Almost every day,” and “At least once a week.” Conversely, “low frequency intake” was represented by the code “0” and encompassed categories like “Sometimes,” “Rarely or never,” “At least once a month,” and “Occasionally.” In this study, principal component analysis in exploratory factor analysis was used to extract the major dietary patterns of the Chinese elderly population. The number of major dietary patterns retained was determined according to Kaiser’s criteria[13]. In this study, a score of 1 was assigned to “high-frequency intake” diets, while a score of 0 was assigned to “low-frequency intake” diets. The scores were summed according to the food composition of each dietary pattern to calculate the final score for each pattern.
Assessment of Covariates
In this study, gender, residence, age, education, occupation, marital status, BMI, self-rated quality of life, type of water drunk, source of water drunk, alcohol consumption, smoking status, exercise status, physical work, social activity, energy, and taste were used as covariates in the data analysis.
Statistical Analysis
In this study, each disease population was analyzed descriptively and basic characteristics of patients in different disease populations were presented. Since none of the measurement data followed a normal distribution, the median (quartiles) was employed to represent the measurement information. Count data were expressed using frequency (composition ratio). Principal component analysis in exploratory factor analysis was used to extract the main dietary patterns of the Chinese elderly population. Binary logistic regression analyses were conducted with the prevalence of 16 common geriatric diseases as the dependent variable and the four dietary pattern scores as the independent variables, and three regression models were developed to eliminate the effects of covariates on the odds ratios (ORs). The logistic regression results showed the odds ratios (OR) for each disease when the dietary pattern scores increased. Data processing, analysis, and the generation of fragmentation graphs were conducted using SPSS 26.0 software, while the forest plot was created using R 4.2.1 software. All tests were two-sided, and a P-value<0.05 was statistically significant.
Results
In this study, principal component analysis with exploratory factor analysis was used to extract the main dietary patterns of the Chinese elderly population. The applicability test of EFA yielded a Kaiser-Meyer-Olkin (KMO) value of 0.738, indicating that the selected food items or food groups were suitable for PCA. Bartlett’s sphericity test yielded significant results (χ2 = 12587.3 and p < 0.001), indicating a high correlation among the food groups and justifying the application of factor analysis. The gravel diagram of the exploratory factor analysis is shown in Figure 2, with four components with initial eigenvalues > 1. According to Kaiser’s criteria, this study retained four factors with a cumulative contribution of 45.38%. These factors were interpreted as the major dietary patterns observed among the Chinese elderly population, and their specific compositions are provided in Table 1.
Table 1: Dietary pattern factor load
|
Egg–Milk Pattern |
Salt-preserved vegetable–Nut Pattern |
Vegetable–Fruit Pattern |
Fish–Meat Pattern |
||||
|
food category |
Factor load |
food category |
Factor load |
food category |
Factor load |
food category |
Factor load |
|
eggs |
0.71 |
salt-preserved vegetables |
0.61 |
fresh vegetable |
0.78 |
fish |
0.73 |
|
milk products |
0.69 |
nut |
0.55 |
fresh fruit |
0.73 |
meat |
0.71 |
|
bean products |
0.47 |
garlic |
0.53 |
||||
|
sugar |
0.45 |
mushroom or algae |
0.53 |
|
|
|
|
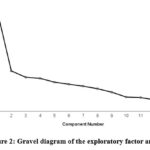 |
Figure 2: Gravel diagram of the exploratory factor analysis |
To maximize the sample size, separate calculations of the four dietary pattern scores were conducted for each specific disease population in this study, followed by descriptive analyses for each disease population. Table 2 provides a detailed overview of the basic characteristics of patients in the different disease populations. Our study included patients with hypertension (n=5529), diabetes (n=1241), heart disease (n=2154), stroke or cardiovascular disease (n=1392), respiratory diseases (n=1247), glaucoma (n=225), gastric or duodenal ulcers (n=574), prostate tumors (n=574), Parkinson’s disease (n=105), arthritis (n=1337), epilepsy (n=35), cholecystitis or cholelithiasis (n=506), rheumatic or rheumatoid diseases (n=636), chronic nephritis (n=125), uterine tumors (n=56), and hepatitis (n=54)
Table 2: Basic characteristics of patients with different disease populations
|
Variable |
hypertension(n=11827) |
diabete(n=11363) |
heart disease (n=11425) |
stroke or cvd (n=11360) |
|
|
Number of patients |
5229(44.21%) |
1241(10.92%) |
2154(18.85%) |
1392(12.25%) |
|
|
age, years |
85.00 |
85.00 |
85.00 |
85.00 |
|
|
BMI, kg/m2 |
23.51 |
23.47 |
23.47 |
23.47 |
|
|
sex, % |
male |
5097(43.09%) |
4914(43.25%) |
4926(43.12%) |
4920 |
|
female |
6730(56.90%) |
6449(56.75%) |
6499(56.88%) |
6440 |
|
|
residenc, % |
city |
2968(25.09%) |
2807(24.70%) |
2841(24.87%) |
2804 |
|
town |
3931(33.24%) |
3803(33.47%) |
3802(33.28%) |
3788 |
|
|
rural |
4928(41.67%) |
4753(41.83%) |
4782(41.86%) |
4768 |
|
|
marital status, % |
married and living with spouse |
4712(39.84%) |
4513(39.72%) |
4519(39.55%) |
4513 |
|
separated |
179(1.51%) |
170(1.49%) |
173(1.51%) |
174 |
|
|
divorced |
35(0.29%) |
32(0.28%) |
33(0.29%) |
31(0.27%) |
|
|
widowed |
6809(57.57%) |
6561(57.74%) |
6615(57.89%) |
6555 |
|
|
never married |
92(0.78%) |
87(0.77%) |
85(0.74%) |
87(0.77%) |
|
|
quality of life, % |
very good |
2596(21.95%) |
2486(21.88%) |
2499(21.87%) |
2487 |
|
good |
6008(50.79%) |
5773(50.81%) |
5821(50.95%) |
5774 |
|
|
so so |
2875(24.31%) |
2771(24.39%) |
2773(24.27%) |
2762 |
|
|
bad |
305(2.58%) |
293(2.58%) |
293(2.57%) |
296 |
|
|
very bad |
43(0.36%) |
40(0.35%) |
39(0.34%) |
41(0.36%) |
|
|
type of drinking water, % |
boiled water |
11593(98.02%) |
11139(98.03%) |
11196(97.99%) |
11131 |
|
un-boiled water |
234(1.98%) |
224(1.97%) |
229(2.00%) |
229(2.02%) |
|
|
source of drinking water, % |
from a well |
2064(17.45%) |
1979(17.42%) |
1992(17.44%) |
1977(17.40%) |
|
from a river or lake |
105(0.89%) |
101(0.89%) |
102(0.89%) |
104(0.92%) |
|
|
from a spring |
247(2.09%) |
240(2.11%) |
237(2.07%) |
237(2.09%) |
|
|
from a pond or pool |
10(0.09%) |
10(0.09%) |
10(0.09%) |
10(0.09%) |
|
|
tap water |
9401(79.49%) |
9033(79.49%) |
9084(79.51%) |
9032 |
|
|
smoke , % |
yes |
1675(14.16%) |
1619(14.25%) |
1620(14.18%) |
1616 |
|
no |
10152(85.84%) |
9744(85.75%) |
9805(85.82%) |
9744 |
|
|
drink , % |
yes |
1634(13.82%) |
1592(14.01%) |
1595(13.96%) |
1590 |
|
no |
10193(86.18%) |
9771(85.99%) |
9830(86.04%) |
9770 |
|
|
exercise, % |
yes |
3637(30.75%) |
3480(30.63%) |
3501(30.64%) |
3475 |
|
no |
8190(69.25%) |
7883(69.37%) |
7924(69.36%) |
7885(69.41%) |
|
|
done physical labor regularly, % |
yes |
8902(75.27%) |
8561(75.34%) |
8616(75.41%) |
8568 |
|
no |
2925(24.73%) |
2802(24.66%) |
2809(24.56%) |
2792 |
|
|
feel energetic |
always |
1509(12.76%) |
1470(12.94%) |
1475(12.91%) |
1472 |
|
often |
4937(41.74%) |
4745(41.76%) |
4770(41.75%) |
4755 |
|
|
sometimes |
3294(27.85%) |
3147(27.70%) |
3157(27.63%) |
3121 |
|
|
seldom |
1883(15.92%) |
1797(15.81%) |
1819(15.92%) |
1807 |
|
|
never |
204(1.72%) |
204(1.80%) |
204(1.79%) |
205(1.80%) |
|
|
main flavor you have, % |
insipidity |
566(4.79%) |
541(4.76%) |
555(4.86%) |
552(4.86%) |
|
salty |
1499(12.67%) |
1438(12.66%) |
1446(12.66%) |
1433 |
|
|
sweet |
4843(40.95%) |
4656(40.98%) |
4694(41.09%) |
4658 |
|
|
hot |
2920(24.69%) |
2793(24.58%) |
2790(24.42%) |
2785 |
|
|
crude |
1999(16.90%) |
1935(17.03%) |
1940(16.98%) |
1932 |
|
|
Egg–Milk-Bean-Sugar Pattern score,points |
1.00(0.00,2.00) |
1.00(0.00,2.00) |
1.00(0.00,2.00) |
1.00 |
|
|
Salt-preserved vegetable–Nut-Mushroom or Algae-Garlic Pattern score,points |
0.00(0.00,1.00) |
0.00(0.00,1.00) |
0.00(0.00,1.00) |
0.00 |
|
|
Vegetable–Fruit Pattern score,points |
1.00(0.00,1.00) |
1.00(0.00,1.00) |
1.00(0.00,1.00) |
1.00 |
|
|
Fish–Meat Pattern score,points |
0.00(0.00,1.00) |
0.00(0.00,1.00) |
0.00(0.00,1.00) |
0.00 |
Table 2: Continued table 1
|
Variable |
respiratory diseases (n=11152) |
glaucoma (n=11140) |
gastric or duodenal ulcer(n=11214) |
proatate tumor |
|
|
Number of patients |
1247(11.18%) |
225(2.02%) |
574(5.12%) |
574(6.10%) |
|
|
age, years |
85.00 |
85.00 |
85.00 |
85.00 |
|
|
BMI, kg/m2 |
22.87 |
23.47 |
23.47 |
23.47 |
|
|
sex, % |
male |
4832(43.33%) |
4816(43.23%) |
4866(43.39%) |
4812 |
|
female |
6320(56.67%) |
6324(56.77%) |
6348(56.61%) |
4596 |
|
|
residenc, % |
city |
2761(24.76%) |
2735(24.55%) |
2746(24.49%) |
2434(25.87%) |
|
town |
3706(33.23%) |
3742(33.59%) |
3757(33.50%) |
3167(33.66%) |
|
|
rural |
4685(42.01%) |
4663(41.86%) |
4711(42.01%) |
3807(40.47%) |
|
|
marital status, % |
married and living with spouse |
4420(39.63%) |
4431(39.78%) |
4463(39.79%) |
3945(41.93%) |
|
separated |
166(1.49%) |
165(1.48%) |
164(1.46%) |
154(1.64%) |
|
|
divorced |
32(0.29%) |
31(0.28%) |
32(0.29%) |
30(0.32%) |
|
|
widowed |
6447(57.81%) |
6428(57.70%) |
6470(57.69%) |
5201(55.28%) |
|
|
never married |
87(0.78%) |
85(0.76%) |
85(0.76%) |
78(0.829%) |
|
|
quality of life, % |
very good |
2423(21.73%) |
2435(21.86%) |
2450(21.85%) |
2107(22.39%) |
|
good |
5674(50.88%) |
5680(50.99%) |
5718(50.99%) |
4745(50.44%) |
|
|
so so |
2727(24.45%) |
2697(24.21%) |
2721(24.26%) |
2294(24.38%) |
|
|
bad |
287(2.57%) |
289(2.59%) |
286(2.55%) |
231(2.46%) |
|
|
very bad |
41(0.37%) |
39(0.35%) |
39(0.35%) |
31(0.33%) |
|
|
type of drinking water, % |
boiled water |
10927(97.98%) |
10913(97.96%) |
10986(97.97%) |
9214(97.94%) |
|
un-boiled water |
225(2.02%) |
227(2.04%) |
228(2.03%) |
194(2.06%) |
|
|
source of drinking water, % |
from a well |
1956(17.54%) |
1954(17.54%) |
1961(17.49%) |
1681(17.87%) |
|
from a river or lake |
99(0.89%) |
99(0.89%) |
101(0.90%) |
87(0.93%) |
|
|
from a spring |
238(2.13%) |
235(2.11%) |
234(2.09%) |
209(2.22%) |
|
|
from a pond or pool |
10(0.09%) |
10(0.09%) |
10(0.09%) |
5(0.05%) |
|
|
tap water |
8849(79.35%) |
8842(79.37%) |
8908(79.44%) |
7426(78.93%) |
|
|
smoke , % |
yes |
1584(14.20%) |
1600(14.36%) |
1612(14.38%) |
1544(16.41%) |
|
no |
9568(85.79%) |
9540(85.64%) |
9602(85.63%) |
7864(83.59%) |
|
|
drink , % |
yes |
1559(13.98%) |
1575(14.14%) |
1582(14.18%) |
1476(15.69%) |
|
no |
9593(86.02%) |
9565(85.86%) |
9632(85.89%) |
7932(84.31%) |
|
|
exercise, % |
yes |
3411(30.59%) |
3419(30.69%) |
3435(30.63%) |
3049(32.41%) |
|
no |
7741(69.41%) |
7721(69.31%) |
7779(69.37%) |
6359(67.59%) |
|
|
done physical labor regularly, % |
yes |
8421(75.51%) |
8401(75.41%) |
8464(75.48%) |
7033(74.76%) |
|
no |
2731(24.49%) |
2739(24.59%) |
2750(24.52%) |
2375(25.24%) |
|
|
feel energetic |
always |
1437(12.89%) |
1453(13.04%) |
1459(13.01%) |
1249(13.28%) |
|
often |
4668(41.86%) |
4659(41.82%) |
4678(41.72%) |
3887(41.32%) |
|
|
|
sometimes |
3078(27.60%) |
3075(27.60%) |
3094(27.59%) |
2636(28.02%) |
|
seldom |
1767(15.84%) |
1755(15.75%) |
1782(15.89%) |
1480(15.73%) |
|
|
never |
202(1.81%) |
198(1.78%) |
201(1.79%) |
156(1.66%) |
|
|
main flavor you have, % |
insipidity |
540(4.84%) |
539(4.84%) |
549(4.89%) |
472(5.02%) |
|
salty |
1416(12.69%) |
1393(12.50%) |
1413(12.60%) |
1159(12.32%) |
|
|
sweet |
4576(41.03%) |
4551(40.85%) |
4578(40.82%) |
3782(40.20%) |
|
|
hot |
2724(24.43%) |
2746(24.65%) |
2753(24.55%) |
2389(25.39%) |
|
|
crude |
1896(17.00%) |
1911(17.15%) |
1921(17.13%) |
1606(17.07%) |
|
|
Egg–Milk-Bean-Sugar Pattern score,points |
1.00(0.00,2.00) |
1.00(0.00,2.00) |
1.00(0.00,2.00) |
1.00(0.00,2.00) |
|
|
Salt-preserved vegetable–Nut-Mushroom orAlgae-Garlic Pattern score,points |
0.00(0.00,1.00) |
0.00(0.00,1.00) |
0.00(0.00,1.00) |
0.00(0.00,1.00) |
|
|
Vegetable–Fruit Pattern score,points |
1.00(0.00,1.00) |
1.00(0.00,1.00) |
1.00(0.00,1.00) |
1.00(0.00,1.00) |
|
|
Fish–Meat Pattern score,points |
0.00(0.00,1.00) |
0.00(0.00,1.00) |
0.00(0.00,1.00) |
0.00(0.00,1.00) |
Table 2: Continued table 2
|
Variable |
parkinson’s disease |
arthritis |
epilepsia |
cholecystitis |
|
|
Number of patients |
105(0.93%) |
1337(11.82%) |
35(0.31%) |
506(4.52%) |
|
|
age, years |
85.00 |
85.00 |
85.00 |
85.00 |
|
|
BMI, kg/m2 |
23.469 |
23.47 |
23.47 |
23.47 |
|
|
sex, % |
male |
4862(43.28%) |
4896(43.29%) |
4858(43.21%) |
4848(43.27%) |
|
female |
6371(56.72%) |
6412(56.70%) |
6386(56.79%) |
6356(56.73%) |
|
|
residenc, % |
city |
2748(24.46%) |
2761(24.42%) |
2745(24.41%) |
2747(24.52%) |
|
town |
3760(33.47%) |
3788(33.49%) |
3765(33.49%) |
3763(33.59%) |
|
|
rural |
4725(42.06%) |
4759(42.09%) |
4734(42.10%) |
4694(41.89%) |
|
|
marital status, % |
married and living with spouse |
4456(39.67%) |
4499(39.79%) |
4456(39.63%) |
4445(39.67%) |
|
separated |
167(1.49%) |
169(1.49%) |
169(1.50%) |
168(1.49%) |
|
|
divorced |
32(0.29%) |
32(0.28%) |
32(0.29%) |
32(0.29%) |
|
|
widowed |
6490(57.78%) |
6519(57.65%) |
6498(57.79%) |
6471(57.76%) |
|
|
never married |
88(0.78%) |
89(0.79%) |
89(0.79%) |
88(0.79%) |
|
|
quality of life, % |
very good |
2453(21.84%) |
2468(21.83%) |
2450(21.79%) |
2450(21.87%) |
|
good |
5720(50.92%) |
5764(50.98%) |
5737(51.02%) |
5698(50.86%) |
|
|
so so |
2731(24.31%) |
2743(24.26%) |
2729(24.27%) |
2727(24.34%) |
|
|
bad |
290(2.58%) |
292(2.58%) |
289(2.57%) |
290(2.59%) |
|
|
very bad |
39(0.35%) |
41(0.36%) |
39(0.35%) |
39(0.35%) |
|
|
type of drinking water, % |
boiled water |
11003(97.95%) |
11081(97.99%) |
11014(97.95%) |
10977(97.97%) |
|
un-boiled water |
230(2.05%) |
227(2.01%) |
230(2.05%) |
227(2.03%) |
|
|
source of drinking water, % |
from a well |
1961(17.46%) |
1974(17.46%) |
1959(17.42%) |
1961(17.50%) |
|
from a river or lake |
100(0.89%) |
103(0.91%) |
101(0.89%) |
102(0.91%) |
|
|
from a spring |
240(2.14%) |
241(2.13%) |
241(2.14%) |
239(2.13%) |
|
|
from a pond or pool |
10(0.09%) |
10(0.09%) |
10(0.09%) |
10(0.09%) |
|
|
tap water |
8922(79.43%) |
8980(79.41%) |
8933(79.45%) |
8892(79.37%) |
|
|
smoke , % |
yes |
1603(14.27%) |
1613(14.26%) |
1606(14.28%) |
1611(14.38%) |
|
no |
9630(85.73%) |
9695(85.74%) |
9638(85.72%) |
9593(85.62%) |
|
|
drink , % |
yes |
1580(14.07%) |
1591(14.07%) |
1582(14.07%) |
1581(14.11%) |
|
no |
9653(85.93%) |
9717(85.93%) |
9662(85.93%) |
9623(85.89%) |
|
|
exercise, % |
yes |
3443(30.65%) |
3466(30.65%) |
3449(30.67%) |
3437(30.68%) |
|
no |
7790(69.35%) |
7842(69.35%) |
7795(69.33%) |
7767(69.32%) |
|
|
done physical labor regularly, % |
yes |
8479(75.48%) |
8547(75.58%) |
8491(75.52%) |
8451(75.43%) |
|
no |
2754(24.52%) |
2761(24.42%) |
2753(24.48%) |
2753(24.57%) |
|
|
feel energetic |
always |
1461(13.01%) |
1458(12.89%) |
1460(12.98%) |
1453(12.97%) |
|
often |
4700(41.84%) |
4725(41.78%) |
4711(41.90%) |
4689(41.85%) |
|
|
sometimes |
3087(27.48%) |
3122(27.61%) |
3091(27.49%) |
3088(27.56%) |
|
|
seldom |
1783(15.87%) |
1800(15.92%) |
1780(15.83%) |
1773(15.82%) |
|
|
never |
202(1.80%) |
203(1.80%) |
202(1.80%) |
201(1.79%) |
|
|
main flavor you have, % |
insipidity |
549(4.89%) |
557(4.93%) |
549(4.88%) |
546(4.87%) |
|
salty |
1420(12.64%) |
1432(12.66%) |
1417(12.60%) |
1412(12.60%) |
|
|
sweet |
4593(40.89%) |
4616(40.82%) |
4595(40.87%) |
4583(40.91%) |
|
|
hot |
2753(24.51%) |
2778(24.57%) |
2765(24.59%) |
2748(24.53%) |
|
|
crude |
1918(17.08%) |
1925(17.02%) |
1918(17.06%) |
1915(17.09%) |
|
|
Egg–Milk-Bean-Sugar Pattern score,points |
1.00(0.00,2.00) |
1.00(0.00,2.00) |
1.00(0.00,2.00) |
1.00(0.00,2.00) |
|
|
Salt-preserved vegetable–Nut-Mushroom or Algae-Garlic Pattern score,points |
0.00(0.00,1.00) |
0.00(0.00,1.00) |
0.00(0.00,1.00) |
0.00(0.00,1.00) |
|
|
Vegetable–Fruit Pattern score,points |
1.00(0.00,1.00) |
1.00(0.00,1.00) |
1.00(0.00,1.00) |
1.00(0.00,1.00) |
|
|
Fish–Meat Pattern score,points |
0.00(0.00,1.00) |
0.00(0.00,1.00) |
0.00(0.00,1.00) |
0.00(0.00,1.00) |
Table 2: Continued table 3
|
Variable |
rheumatism or rheumatoid disease |
chronic nephritis |
uterine tumor |
hepatitis |
|
|
Number of patients |
636(5.67%) |
125(1.12%) |
56(0.58%) |
54(0.48%) |
|
|
age, years |
85.00 |
85.00 |
86.00 |
85.00 |
|
|
BMI, kg/m2 |
23.47 |
23.47 |
22.85 (20.20,24.17) |
23.47 |
|
|
sex, % |
male |
4851(43.28%) |
4824(43.27%) |
3403(35.16%) |
4843(43.38%) |
|
|
female |
6358(56.72%) |
6324(56.73%) |
6277(64.85%) |
6321(56.62%) |
|
residenc, % |
city |
2752(24.55%) |
2740(24.58%) |
2450(25.31%) |
2739(24.53%) |
|
town |
3752(33.47%) |
3733(33.49%) |
3243(33.50%) |
3730(33.41%) |
|
|
rural |
4705(41.98%) |
4675(41.94%) |
3987(41.19%) |
4695(42.06%) |
|
|
marital status, % |
married and living with spouse |
4451(39.71%) |
4426(39.70%) |
3588(37.07%) |
4437(39.74%) |
|
separated |
169(1.51%) |
167(1.49%) |
148(1.53%) |
168(1.56%) |
|
|
divorced |
32(0.29%) |
32(0.29%) |
30(0.31%) |
31(0.27%) |
|
|
widowed |
6466(57.69%) |
6435(57.72%) |
5843(60.36%) |
6439(57.68%) |
|
|
never married |
91(0.81%) |
88(0.79%) |
71(0.73%) |
89(0.79%) |
|
|
quality of life, % |
very good |
2448(21.84%) |
2440(21.89%) |
2169(22.41%) |
2439(21.85%) |
|
good |
5712(50.96%) |
5675(50.91%) |
4933(50.96%) |
5693(50.99%) |
|
|
so so |
2719(24.26%) |
2707(24.28%) |
2285(23.61%) |
2706(24.24%) |
|
|
bad |
290(2.59%) |
288(2.58%) |
257(2.66%) |
287(2.57%) |
|
|
very bad |
40(0.35%) |
38(0.34%) |
36(0.37%) |
39(0.35%) |
|
|
type of drinking water, % |
boiled water |
10984(97.99%) |
10921(97.96%) |
9482(97.96%) |
10937(97.97%) |
|
un-boiled water |
225(2.01%) |
227(2.04%) |
198(2.05%) |
227(2.03%) |
|
|
source of drinking water, % |
from a well |
1961(17.49%) |
1951(17.50%) |
1714(17.71%) |
1944(17.41%) |
|
from a river or lake |
100(0.89%) |
100(0.89%) |
92(0.95%) |
101(0.91%) |
|
|
from a spring |
243(2.17%) |
235(2.11%) |
216(2.23%) |
235(2.11%) |
|
|
from a pond or pool |
10(0.089%) |
10(0.09%) |
9(0.09%) |
10(0.09%) |
|
|
tap water |
8895(79.356%) |
8852(79.40%) |
7649(79.02%) |
8874(79.49%) |
|
|
smoke , % |
yes |
1609(14.355%) |
1596(14.32%) |
1173(12.12%) |
1595(14.29%) |
|
no |
9600(85.645%) |
9552(85.68%) |
8507(87.88%) |
9569(85.71%) |
|
|
drink , % |
yes |
1582(14.114%) |
1572(14.10%) |
1180(12.19%) |
1574(14.09%) |
|
no |
9627(85.886%) |
9576(85.89%) |
8500(87.81%) |
9590(85.90%) |
|
|
exercise, % |
yes |
3447(30.752%) |
3419(30.67%) |
2975(30.73%) |
3417(30.61%) |
|
no |
7762(69.248%) |
7729(69.33%) |
6705(69.27%) |
7747(69.39%) |
|
|
done physical labor regularly, % |
yes |
8459(75.466%) |
8403(75.38%) |
7243(74.82%) |
8419(75.41%) |
|
no |
2750(24.534%) |
2745(24.62%) |
2437(25.18%) |
2745(24.59%) |
|
|
feel energetic |
always |
1453(12.96%) |
1452(13.02%) |
1267(13.09%) |
1450(12.99%) |
|
often |
4685(41.80%) |
4665(41.85%) |
4049(41.83%) |
4670(41.83%) |
|
|
sometimes |
3092(27.58%) |
3070(27.54%) |
2673(27.61%) |
3071(27.51%) |
|
|
seldom |
1777(15.85%) |
1762(15.81%) |
1531(15.82%) |
1772(15.87%) |
|
|
never |
202(1.80%) |
199(1.79%) |
160(1.65%) |
201(1.80%) |
|
|
main flavor you have, % |
insipidity |
550(4.907%) |
541(4.85%) |
475(4.91%) |
547(4.90%) |
|
salty |
1410(12.58%) |
1406(12.61%) |
1237(12.78%) |
1405(12.59%) |
|
|
sweet |
4576(40.82%) |
4550(40.81%) |
4018(41.51%) |
4561(40.86%) |
|
|
hot |
2757(24.59%) |
2742(24.59%) |
2379(24.58%) |
2742(24.56%) |
|
|
crude |
1916(17.09%) |
1909(17.12%) |
1571(16.23%) |
1909(17.10%) |
|
|
Egg–Milk-Bean-Sugar Pattern score,points |
1.00(0.00,2.00) |
1.00(0.00,2.00) |
1.00(0.00,2.00) |
1.00(0.00,2.00) |
|
|
Salt-preserved vegetable–Nut-Mushroom or Algae-Garlic Pattern score,points |
0.00(0.00,1.00) |
0.00(0.00,1.00) |
0.00(0.00,1.00) |
0.00(0.00,1.00) |
|
|
Vegetable–Fruit Pattern score,points |
1.00(0.00,1.00) |
1.00(0.00,1.00) |
1.00(0.00,1.00) |
1.00(0.00,1.00) |
|
|
Fish–Meat Pattern score,points |
0.00(0.00,1.00) |
0.00(0.00,1.00) |
0.00(0.00,1.00) |
0.00(0.00,1.00) |
In this study, three model regression models were developed to eliminate the effect of covariates on prevalence as much as possible, and a binary logistic regression analysis was performed with the prevalence of 16 diseases as the dependent variable and each of the four dietary pattern scores as the independent variable.
After adjusting for three models, the logistic regression results showed that as the Egg-Milk Pattern score increased, the risk of cardiovascular disease (OR=1.112), stroke or cardiovascular disease (OR=1.115), respiratory system disease (OR=1.103), glaucoma (OR=1.267), prostate tumor (OR=1.155), and Parkinson’s disease (OR=1.275) increased in elderly people. Moreover, as the Salt-preserved vegetable-Nut Pattern score increased, the risk of hypertension (OR=1.063), heart disease (OR=1.024), and uterine tumors (OR=1.426) increased, while the risk of rheumatoid arthritis or rheumatic diseases decreased (OR=0.861). As the Vegetable-Fruit Pattern score increased, the risk of heart disease (OR=0.984) decreased in elderly people. Finally, as the Fish-Meat Pattern score increased, the risk of heart disease (OR=0.878) and stroke or cardiovascular disease (OR=0.865) decreased, while the risk of rheumatoid arthritis or rheumatic diseases increased (OR=1.246). The specific OR values are detailed in Table 3. To better illustrate the relationship between dietary pattern scores and disease risk, we presented the OR values of model 3 in the form of a forest plot, as shown in Figure 3.
Table 3: Logistic regression analysis of dietary patterns and geriatric diseases
|
Dietary pattern |
Model |
hypertension |
diabetes |
heart disease |
stroke or cvd |
||||
|
OR(95%CI) |
p |
OR(95%CI) |
p |
OR(95%CI) |
p |
OR(95%CI) |
p |
||
|
Egg–Milk Pattern |
|||||||||
|
1 |
1.051 |
0.006 |
1.187 (1.124,1.253) |
<0.001 |
1.249 |
<0.001 |
1.191 |
<0.001 |
|
|
2 |
0.994 |
0.762 |
1.026 |
0.415 |
1.094 |
<0.001 |
1.071 |
0.019 |
|
|
3 |
0.990 |
0.625 |
1.035 |
0.287 |
1.112 |
<0.001 |
1.115 |
<0.001 |
|
|
Salt-preserved vegetable–Nut Pattern |
|||||||||
|
1 |
1.150 |
<0.001 |
1.276 |
<0.001 |
1.189 |
<0.001 |
1.078 |
0.068 |
|
|
2 |
1.045 |
0.109 |
1.052 |
0.227 |
1.053 |
0.141 |
0.970 |
0.474 |
|
|
3 |
1.063 |
0.030 |
1.083 |
0.064 |
1.024 |
0.021 |
1.027 |
0.534 |
|
|
Vegetable–Fruit Pattern |
|||||||||
|
1 |
1.148 |
<0.001 |
1.262 |
<0.001 |
1.250 |
<0.001 |
1.035 |
0.373 |
|
|
2 |
1.008 |
0.764 |
0.956 |
0.189 |
1.039 |
0.263 |
0.890 |
0.004 |
|
|
3 |
1.015 |
0.576 |
0.999 |
0.989 |
0.984 |
0.021 |
0.962 |
0.346 |
|
|
Fish–Meat Pattern |
|||||||||
|
1 |
1.055 |
0.068 |
1.242 |
<0.001 |
0.993 |
0.845 |
0.942 |
0.199 |
|
|
2 |
0.984 |
0.598 |
1.058 |
0.248 |
0.865 |
<0.001 |
0.836 |
<0.001 |
|
|
3 |
0.994 |
0.839 |
1.077 |
0.132 |
0.878 |
0.001 |
0.865 |
0.003 |
Model 1: no covariates were included; Model 2: adjusted for gender, residence, age, education, occupation, marital status, and BMI; Model 3: adjusted for Model 2 + self-rated quality of life, type of water drunk, source of water drunk, alcohol consumption, smoking status, exercise status, physical effort, social activity, energy, and taste.
Table 3: Continued table 1
|
Dietary pattern |
Model |
respiratory diseases |
glaucoma |
prostate tumor |
gastric or duodenal ulcer |
||||
|
OR(95%CI) |
p |
OR(95%CI) |
p |
OR(95%CI) |
p |
OR(95%CI) |
p |
||
|
Egg–Milk Pattern |
|||||||||
|
1 |
1.120 |
<0.001 |
1.407 |
<0.001 |
1.381 |
<0.001 |
1.042 |
0.317 |
|
|
2 |
1.060 |
0.055 |
1.262 |
<0.001 |
1.145 |
0.002 |
1.002 |
0.963 |
|
|
3 |
1.103 |
0.002 |
1.267 |
<0.001 |
1.155 |
0.002 |
1.038 (0.950,1.136) |
0.409 |
|
|
Salt-preserved vegetable–Nut Pattern |
|||||||||
|
1 |
0.974 |
0.563 |
1.225 |
0.014 |
1.110 |
0.083 |
1.069 |
0.276 |
|
|
2 |
0.949 |
0.265 |
1.104 |
0.238 |
0.967 |
0.602 |
1.007 |
0.912 |
|
|
3 |
0.997 |
0.949 |
1.106 |
0.238 |
0.987 |
0.847 |
1.057 |
0.383 |
|
|
Vegetable–Fruit Pattern |
|||||||||
|
1 |
0.995 |
0.901 |
1.177 |
0.057 |
1.298 |
<0.001 |
0.968 |
0.583 |
|
|
2 |
0.963 |
0.367 |
1.009 |
0.918 |
1.083 |
0.195 |
0.882 |
0.036 |
|
|
3 |
1.033(0.949,1.124) |
0.457 |
1.013 |
0.886 |
1.098 |
0.142 |
0.943 |
0.342 |
|
|
Fish–Meat Pattern |
|||||||||
|
1 |
0.992 |
0.868 |
1.115 |
0.266 |
1.216 |
0.003 |
1.000 |
0.996 |
|
|
2 |
0.936 |
0.180 |
1.010 |
0.923 |
0.973 |
0.702 |
0.956 |
0.514 |
|
|
3 |
0.966 |
0.483 |
1.011 |
0.910 |
0.983 |
0.807 |
0.978 |
0.752 |
Model 1: no covariates were included; Model 2: adjusted for gender, residence, age, education, occupation, marital status, and BMI; Model 3: adjusted for Model 2 + self-rated quality of life, type of water drunk, source of water drunk, alcohol consumption, smoking status, exercise status, physical effort, social activity, energy, and taste.
Table 3: Continued table 2
|
Dietary pattern |
Model |
parkinson’s disease |
arthritis |
epilepsy |
cholecystitis, cholelith disease |
||||
|
OR(95%CI) |
p |
OR(95%CI) |
p |
OR(95%CI) |
p |
OR(95%CI) |
p |
||
|
Egg–Milk Pattern |
|||||||||
|
1 |
1.253 |
0.010 |
1.036 |
0.212 |
1.347 |
0.044 |
1.120 |
0.008 |
|
|
2 |
1.200 |
0.053 |
0.966 |
0.263 |
1.274 |
0.127 |
1.012 |
0.792 |
|
|
3 |
1.275 |
0.011 |
1.004 |
0.898 |
1.309 |
0.097 |
1.011 |
0.816 |
|
|
Salt-preserved vegetable–Nut Pattern |
|||||||||
|
1 |
0.987 |
0.929 |
1.042 |
0.340 |
1.439 |
0.062 |
1.168 |
0.012 |
|
|
2 |
0.973 |
0.856 |
0.958 |
0.321 |
1.373 |
0.110 |
1.044 |
0.489 |
|
|
3 |
1.046 |
0.770 |
1.004 |
0.922 |
1.415 |
0.086 |
1.046 |
0.476 |
|
|
Vegetable–Fruit Pattern |
|||||||||
|
1 |
0.958 |
0.748 |
1.043 |
0.288 |
1.011 |
0.963 |
1.211 |
0.002 |
|
|
2 |
0.938 |
0.639 |
0.923 |
0.050 |
0.930 |
0.757 |
1.031 |
0.631 |
|
|
3 |
1.040 |
0.777 |
0.994 |
0.879 |
0.959 |
0.861 |
1.049 |
0.455 |
|
|
Fish–Meat Pattern |
|||||||||
|
1 |
1.150 |
0.354 |
1.045 |
0.337 |
0.976 |
0.927 |
1.064 |
0.384 |
|
|
2 |
1.105 |
0.518 |
0.987 |
0.781 |
0.920 |
0.763 |
0.968 |
0.653 |
|
|
3 |
1.152 |
0.361 |
1.009 |
0.858 |
0.939 |
0.822 |
0.970 |
0.676 |
Model 1: no covariates were included; Model 2: adjusted for gender, residence, age, education, occupation, marital status, and BMI; Model 3: adjusted for Model 2 + self-rated quality of life, type of water drunk, source of water drunk, alcohol consumption, smoking status, exercise status, physical effort, social activity, energy, and taste.
Table 3: Continued table 3
|
Dietary pattern |
Model |
rheumatism or rheumatoid disease |
chronic nephritis |
uterine tumor |
hepatitis |
||||
|
OR(95%CI) |
p |
OR(95%CI) |
p |
OR(95%CI) |
p |
OR(95%CI) |
p |
||
|
Egg–Milk Pattern |
|||||||||
|
1 |
0.878 |
0.002 |
1.129 |
0.145 |
1.355 |
0.009 |
1.215 |
0.113 |
|
|
2 |
0.885 |
0.006 |
0.948 |
0.567 |
1.100 |
0.459 |
1.209 |
0.156 |
|
|
3 |
0.921 |
0.072 |
0.996 |
0.964 |
1.104 |
0.401 |
1.240 |
0.114 |
|
|
Salt-preserved vegetable–Nut Pattern |
|||||||||
|
1 |
0.841 |
0.012 |
1.1099 |
0.407 |
1.786 |
<0.001 |
1.404 |
0.034 |
|
|
2 |
0.825 |
0.006 |
0.941 |
0.635 |
1.388 |
0.016 |
1.261 |
0.164 |
|
|
3 |
0.861 |
0.033 |
1.094 |
0.515 |
1.426 |
0.012 |
1.327 |
0.097 |
|
|
Vegetable–Fruit Pattern |
|||||||||
|
1 |
0.971 |
0.598 |
1.399 |
0.006 |
1.486 |
0.029 |
1.047 |
0.803 |
|
|
2 |
0.942 |
0.297 |
1.108 |
0.407 |
1.031 |
0.865 |
0.883 |
0.518 |
|
|
3 |
1.002 |
0.974 |
1.002 |
0.985 |
1.044 |
0.819 |
0.931 |
0.716 |
|
|
Fish–Meat Pattern |
|||||||||
|
1 |
1.186 |
0.006 |
1.279 |
0.067 |
1.631 |
0.010 |
1.154 |
0.493 |
|
|
2 |
1.212 |
0.002 |
1.094 |
0.515 |
1.330 |
0.144 |
1.059 |
0.788 |
|
|
3 |
1.246 |
0.001 |
1.233 |
0.102 |
1.325 (0.903,1.943) |
0.15 |
1.072 |
0.746 |
Model 1: no covariates were included; Model 2: adjusted for gender, residence, age, education, occupation, marital status, and BMI; Model 3: adjusted for Model 2 + self-rated quality of life, type of water drunk, source of water drunk, alcohol consumption, smoking status, exercise status, physical effort, social activity, energy, and taste.
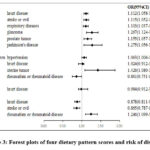 |
Figure 3: Forest plots of four dietary pattern scores and risk of disease |
Discussion
This study found four main dietary patterns in the Chinese elderly population: Egg-Milk Pattern, Salt-preserved vegetable-Nut Pattern, Vegetable-Fruit Pattern, and Fish-Meat Pattern, consistent with the study by Yuan 16. Although previous studies have investigated the main dietary patterns of Chinese older adults based on a 24-hour dietary review over 3 consecutive days17, the effects of diet on health are cumulative over time, and short-term dietary surveys may not reflect long-term food intake levels. In the present study, the simple food frequency scale method was used to investigate the long-term average food intake levels of individuals in the population, which is more suitable for studying the association between diet and disease risk18. It is well-established that the dietary habits of Chinese elderly people are influenced by various aspects such as culture, region, farming, and nutritional needs, and their dietary patterns differ significantly from elderly people in other countries19. Therefore, conducting a dedicated study and survey can enhance our comprehension of the dietary patterns among the elderly population in China, enabling the development of tailored nutritional healthcare strategies for their specific needs.
In this study, elevated Egg-Milk Pattern scores were associated with an increased risk of heart disease, stroke or cardiovascular disease, respiratory disease, glaucoma, prostate tumors, and Parkinson’s disease in the elderly. It is well-established that eggs contain high amounts of cholesterol20, and dietary cholesterol intake is associated with the incidence of cardiovascular disease21 and prostate tumors22. LDL cholesterol in eggs has a key role in cardiovascular events in atherosclerotic plaque formation23. In contrast, the high cholesterol content of eggs may lead to abnormalities in the function of lipid rafts in prostate cancer cell membranes, thus allowing abnormal signaling of cell proliferation and apoptosis and promoting the growth of tumor cells24. Although no studies have investigated the association between egg intake and glaucoma risk, total blood cholesterol levels have been significantly associated with increased intraocular pressure25, which can increase the risk of primary open-angle glaucoma26. In addition, eggs represent a common atopic food, and their intake may cause an IgG-mediated immune response that triggers asthma27.
In Egg-Milk Pattern, the uric acid-lowering effect of milk and pesticide contamination in milk make it an important risk factor for Parkinson’s disease 28. Additionally, the sugars found in the Egg-Milk Pattern may contribute to the accelerated formation of advanced glycation end products, potentially impairing the function of the retinal pigment epithelium and increasing the susceptibility to glaucoma among the elderly 29. In addition, milk and eggs are commonly known as atopic foods, potentially heightening the risk of asthma in older adults 30. Notably, although Omega-3 in milk and eggs and estrogen in beans in the Egg-Milk Pattern are protective against prostate cancer 31-32, this dietary pattern increases the risk of prostate tumors in the presence of cholesterol in eggs. Therefore, clinical trials are warranted to comprehensively investigate the combined mechanisms of action underlying the Egg-Milk Pattern.
With an increased Salt-preserved vegetable-Nut Pattern score, older adults have an increased risk of hypertension, heart disease, uterine tumors, and a decreased risk of rheumatic or rheumatoid disease. It has been shown that a high-salt diet is an important factor in causing hypertension and cardiovascular injury33 and that a high-salt diet decreases levels of Bifidobacterium fragilis and arachidonic acid in the gut, increases gut-derived corticosterone production and corticosterone levels, and promotes elevated blood pressure34. Besides, the intake of pickled vegetables has been shown to increase the risk of hypertension and coronary heart disease in the Chinese elderly population35. Although no studies have hitherto investigated the correlation between pickled vegetable intake and uterine tumors, a high-salt diet has been shown to promote tumor progression by triggering an immune response36-37.
Moreover, some species of mushrooms reportedly exhibit immunomodulatory activity, making them a promising candidate for drug replacement therapy for rheumatic diseases38, and garlic is a potential adjunctive treatment for rheumatic diseases39-40. Thus, according to the Salt-preserved vegetable-Nut Pattern, mushrooms and garlic may jointly play a protective role against rheumatic diseases. Interestingly, although nuts, mushrooms, seaweed, and garlic have been documented to be effective for blood pressure control41 and yield many health benefits42-45, the Salt-preserved vegetable-Nut Pattern was found to increase the risk of hypertension in Chinese older adults in the presence of a high-salt diet of salty vegetables. This finding suggests that salt intake exerts the most significant influence on blood pressure and that its effect significantly outweighs the effect of other foods in regulating blood pressure.
The present study found that higher scores in the Vegetable-Fruit Pattern were associated with a decreased risk of heart disease among older adults. Consistent with the literature 46, increased fruit and vegetable intake was associated with a reduced risk of cardiovascular disease. It is widely acknowledged that dietary fiber in fruit and vegetable intake may reduce cholesterol levels, blood pressure, inflammation, and platelet aggregation and improve vascular and immune function47.
In addition, this study found that as Fish-Meat Pattern scores increased, the risk of heart disease, stroke, or cardiovascular disease decreased, and the risk of rheumatic or rheumatoid disease increased in older adults. In this respect, studies have shown that red meat intake increases the risk of rheumatic disease48, while fish intake reduces the risk of cardiovascular disease49. Although meat intake is generally considered to increase the risk of cardiovascular disease, specific types of meat, such as lean and unprocessed red meat, do not increase the risk of cardiovascular disease50.
This study has several limitations that should be acknowledged. Firstly, the database questionnaire provided information on the frequency of food intake but did not include specific details regarding the categories and quantities of each food consumed. Secondly, given the cross-sectional observational nature of our study, it is susceptible to reverse causality and potential confounding factors, despite attempts to adjust for multiple confounders. Lastly, the reliance on self-reported questionnaire data introduces the possibility of bias in our findings, emphasizing the need for more research.
Conclusions
This study substantiated that there are four major dietary patterns in the Chinese elderly population, namely Egg-Milk Pattern, Salt-preserved vegetable-Nut Pattern, Vegetable-Fruit Pattern, and Fish-Meat Pattern. The recommended dietary patterns for common diseases in elderly patients vary greatly. Salt-preserved vegetable-nut pattern is recommended for rheumatic diseases, while vegetable-fruit and fish-meat patterns are recommended for heart disease. Patients with stroke or cardiovascular disease are recommended to adopt the fish-meat pattern. However, the same dietary pattern may have opposing effects on different diseases. Accordingly, personalized dietary guidance should be implemented for elderly individuals based on their health conditions. The correlations between dietary patterns and diseases derived from this study may provide a basis for the prevention and individualized management of diseases in the elderly. However, the mechanisms underlying the interactions between nutrients in each dietary pattern remain unclear, emphasizing the need for future studies.
Acknowledgements
We would like to sincerely thank the participants of the study.
Conflict of Interest
The authors declares no conflict of interest.
Funding Sources
This study was sponsored by the Tianjin Health Research Project (Grant No. TJWJ2021MS024) and the National Natural Science Foundation of China (71804125).
References
- United Nations. World population prospects 2019: highlights. https://population.un.org/wpp/Publications/Files/WPP2019_10KeyFinclings. Accessed December 18, 2023.
- National Bureau of Statistics Bulletin Ofthe Seventh National Census (No. 5)—Population Age Composition. China Inf. Dly. 2021, 10–11, doi:10.38309/n.cnki.nzgxx.2021.000487.
- Fang, E.F.; Scheibye-Knudsen, M.; Jahn, H.J.; Li, J.; Ling, L.; Guo, H.; Zhu, X.; Preedy, V.; Lu, H.; Bohr, V.A.; et al. A Research Agenda for Aging in China in the 21st Century. Ageing Res. Rev. 2015, 24, 197–205, doi:10.1016/j.arr.2015.08.003
- Jiang, C.; Zhu, F.; Qin, T. Relationships between Chronic Diseases and Depression among Middle-Aged and Elderly People in China: A Prospective Study from CHARLS. Curr. Med. Sci. 2020, 40, 858–870, doi:10.1007/s11596-020-2270-5.
- Wang W. Further Play Role of Integrated Chinese and Western Medicine in Prevention and Treatment of Geriatric Diseases. Chin. J. Integr. Tradit. West. Med. 2019, 39, 906.
- Black, M.; Bowman, M. Nutrition and Healthy Aging. Clin. Geriatr. Med. 2020, 36, 655–669, doi:10.1016/j.cger.2020.06.008.
- Leigh, S.-J.; Morris, M.J. Diet, Inflammation and the Gut Microbiome: Mechanisms for Obesity-Associated Cognitive Impairment. Biochim. Biophys. Acta BBA – Mol. Basis Dis. 2020, 1866, 165767, doi:10.1016/j.bbadis.2020.165767.
- Bie, L.Z.; Lou, P.N. ; Research progress on relationship between diet and depression and anxiety in patients with diabetes mellitus. Chinese Journal of School Doctor. 2022, 36, 791–794
- Fu, J.; Shin, S. Dietary Patterns and Risk of Non-Alcoholic Fatty Liver Disease in Korean Adults: A Prospective Cohort Study. BMJ Open 2023, 13, e065198, doi:10.1136/bmjopen-2022-065198.
- Domínguez, M.; Vega-Hernández, M.C.; Cabrera, T.D. la C.; Arriba-Méndez, S.; Pellegrini-Belinchón, F.J. Mediterranean Diet in the Castilian Plains: Dietary Patterns and Childhood Asthma in 6-7-Year-Old Children from the Province of Salamanca. Allergol. Immunopathol. (Madr.) 2022, 50, 91–99, doi:10.15586/aei.v50i5.544.
- Hou, Y.-C.; Feng, H.-C.; Tzeng, I.-S.; Kuo, C.-Y.; Cheng, C.-F.; Wu, J.H.; Yang, S.-H. Dietary Patterns and the Risk of Prediabetes in Taiwan: A Cross-Sectional Study. Nutrients 2020, 12, 3322, doi:10.3390/nu12113322.
- Koenig, R. An Island of “Genetic Parks.” Science 2001, 291, 2075–2075, doi:10.1126/science.291.5511.2075.
- Aihemaitijiang, S.; Zhang, L.; Ye, C.; Halimulati, M.; Huang, X.; Wang, R.; Zhang, Z. Long-Term High Dietary Diversity Maintains Good Physical Function in Chinese Elderly: A Cohort Study Based on CLHLS from 2011 to 2018. Nutrients 2022, 14, 1730, doi:10.3390/nu14091730.
- Lv, X.; Sun, S.; Wang, J.; Chen, H.; Li, S.; Hu, Y.; Yu, M.; Zeng, Y.; Gao, X.; Xu, Y.; et al. Anti-Inflammatory Dietary Diversity and Depressive Symptoms among Older Adults: A Nationwide Cross-Sectional Analysis. Nutrients 2022, 14, 5062, doi:10.3390/nu14235062.
- Cheng, Y.Y. Analysis of the association between chronic disease co-morbidity and cognitive function, physical function and mortality and prevention and control strategies in the elderly in China. Master’s thesis, Tianjin Medical University: Tianjin, 2020.
- Yuan, X.Y.; Xiao, M.; Chen, L.L.; Ding, X.B.; Tang, X.J.; Qiu, J.F. Correlation between dietary patterns and impaired fasting glucose in adults aged 30-79 years in Chongqing city. Chinese Journal of Public Health.38, 52–56.
- Mao, D.H. The relationship between dietary patterns and serum uric acid in the Chinese elderly. Chinese Journal of Prevention and Control of Chronic Diseases.2022, 30, 712–716, doi:10.16386/j.cjpccd.issn.1004-6194.2022.09.016.
- Cao, X.; Zhou, S.Y.; Yang, B.F.; Zhou, J.S.. The relationship between dietary patterns and sleep disorders in selected health screening populations in Changsha. Journal of Central South University(Medical Science).2020, 45, 1204–1214.
- Hosking, D.; Danthiir, V. Retrospective Lifetime Dietary Patterns Are Associated with Demographic and Cardiovascular Health Variables in an Older Community-Dwelling Australian Population. Br. J. Nutr. 2013, 110, 2069–2083, doi:10.1017/S000711451300144X.
- Wang, X.; Peng, S.-M.; Liu, Y.; Liao, S.; Zhao, H.-H.; Duan, G.-Y.; Wu, Y.-M.; Liu, C.-J.; Wang, Y.-Z.; Liu, T.-M.; et al. Effect of Ramie on the Production Performance of Laying Hens, and the Quality, Nutrient Composition, Antioxidation of the Eggs. Front. Physiol. 2022, 13, 854760, doi:10.3389/fphys.2022.854760.
- Carson, J.A.S.; Lichtenstein, A.H.; Anderson, C.A.M.; Appel, L.J.; Kris-Etherton, P.M.; Meyer, K.A.; Petersen, K.; Polonsky, T.; Van Horn, L.; On behalf of the American Heart Association Nutrition Committee of the Council on Lifestyle and Cardiometabolic Health; Council on Arteriosclerosis, Thrombosis and Vascular Biology; Council on Cardiovascular and Stroke Nursing; Council on Clinical Cardiology; Council on Peripheral Vascular Disease; and Stroke Council Dietary Cholesterol and Cardiovascular Risk: A Science Advisory From the American Heart Association. Circulation 2020, 141, doi:10.1161/CIR.0000000000000743.
- Kang, J.H.; Pasquale, L.R.; Willett, W.C.; Rosner, B.A.; Egan, K.M.; Faberowski, N.; Hankinson, S.E. Dietary Fat Consumption and Primary Open-Angle Glaucoma. Am. J. Clin. Nutr. 2004, 79, 755–764, doi:10.1093/ajcn/79.5.755.
- Zhong, V.W.; Van Horn, L.; Cornelis, M.C.; Wilkins, J.T.; Ning, H.; Carnethon, M.R.; Greenland, P.; Mentz, R.J.; Tucker, K.L.; Zhao, L.; et al. Associations of Dietary Cholesterol or Egg Consumption With Incident Cardiovascular Disease and Mortality. JAMA 2019, 321, 1081, doi:10.1001/jama.2019.1572.
- Freeman, M.R.; Solomon, K.R. Cholesterol and Prostate Cancer. J. Cell. Biochem. 2004, 91, 54–69, doi:10.1002/jcb.10724.
- Qian, Z.X. Study of peripheral blood metabolic markers associated with glaucoma. D. Thesis, Kunming Medical University: Yunnan Province, 2022.
- Kass, M.A.; Heuer, D.K.; Higginbotham, E.J.; Johnson, C.A.; Keltner, J.L.; Miller, J.P.; Parrish, R.K.; Wilson, M.R.; Gordon, M.O. The Ocular Hypertension Treatment Study: A Randomized Trial Determines That Topical Ocular Hypotensive Medication Delays or Prevents the Onset of Primary Open-Angle Glaucoma. Arch. Ophthalmol. Chic. Ill 1960 2002, 120, 701–713; discussion 829-830, doi:10.1001/archopht.120.6.701.
- Tedner, S.G.; Asarnoj, A.; Thulin, H.; Westman, M.; Konradsen, J.R.; Nilsson, C. Food Allergy and Hypersensitivity Reactions in Children and Adults—A Review. J. Intern. Med. 2022, 291, 283–302, doi:10.1111/joim.13422.
- Boulos, C.; Yaghi, N.; El Hayeck, R.; Heraoui, G.N.; Fakhoury-Sayegh, N. Nutritional Risk Factors, Microbiota and Parkinson’s Disease: What Is the Current Evidence? Nutrients 2019, 11, 1896, doi:10.3390/nu11081896.
- Chiu, C.-J.; Taylor, A. Dietary Hyperglycemia, Glycemic Index and Metabolic Retinal Diseases. Prog. Retin. Eye Res. 2011, 30, 18–53, doi:10.1016/j.preteyeres.2010.09.001.
- Zepeda-Ortega, B.; Goh, A.; Xepapadaki, P.; Sprikkelman, A.; Nicolaou, N.; Hernandez, R.E.H.; Latiff, A.H.A.; Yat, M.T.; Diab, M.; Hussaini, B.A.; et al. Strategies and Future Opportunities for the Prevention, Diagnosis, and Management of Cow Milk Allergy. Front. Immunol. 2021, 12, 608372, doi:10.3389/fimmu.2021.608372.
- Gevariya, N.; Lachance, G.; Robitaille, K.; Joly Beauparlant, C.; Beaudoin, L.; Fournier, É.; Fradet, Y.; Droit, A.; Julien, P.; Marette, A.; et al. Omega-3 Eicosapentaenoic Acid Reduces Prostate Tumor Vascularity. Mol. Cancer Res. 2021, 19, 516–527, doi:10.1158/1541-7786.MCR-20-0316.
- Ahlin, R.; Nybacka, S.; Josefsson, A.; Stranne, J.; Steineck, G.; Hedelin, M. The Effect of a Phytoestrogen Intervention and Impact of Genetic Factors on Tumor Proliferation Markers among Swedish Patients with Prostate Cancer: Study Protocol for the Randomized Controlled PRODICA Trial. Trials 2022, 23, 1041, doi:10.1186/s13063-022-06995-2.
- Diet, Nutrition and the Prevention of Chronic Diseases. World Health Organ. Tech. Rep. Ser. 2003, 916, i–viii, 1–149, backcover.
- Yan, X.; Jin, J.; Su, X.; Yin, X.; Gao, J.; Wang, X.; Zhang, S.; Bu, P.; Wang, M.; Zhang, Y.; et al. Intestinal Flora Modulates Blood Pressure by Regulating the Synthesis of Intestinal-Derived Corticosterone in High Salt-Induced Hypertension. Circ. Res. 2020, 126, 839–853, doi:10.1161/CIRCRESAHA.119.316394.
- Wang, H.; Qu, M.; Yang, P.; Yang, B.; Deng, F. Dietary Patterns and Cardio-Cerebrovascular Disease in a Chinese Population. Nutr. Res. Pract. 2015, 9, 313, doi:10.4162/nrp.2015.9.3.313.
- Chen, J.; Liu, X.; Huang, H.; Zhang, F.; Lu, Y.; Hu, H. High Salt Diet May Promote Progression of Breast Tumor through Eliciting Immune Response. Int. Immunopharmacol. 2020, 87, 106816, doi:10.1016/j.intimp.2020.106816.
- Wang, X.; Liu, X.; Jia, Z.; Zhang, Y.; Wang, S.; Zhang, H. Evaluation of the Effects of Different Dietary Patterns on Breast Cancer: Monitoring Circulating Tumor Cells. Foods 2021, 10, 2223, doi:10.3390/foods10092223.
- Dong, W.; Wang, Z.; Feng, X.; Zhang, R.; Shen, D.; Du, S.; Gao, J.; Qi, J. Chromosome-Level Genome Sequences, Comparative Genomic Analyses, and Secondary-Metabolite Biosynthesis Evaluation of the Medicinal Edible Mushroom Laetiporus Sulphureus. Microbiol. Spectr. 2022, 10, e02439-22, doi:10.1128/spectrum.02439-22.
- Moosavian, S.P.; Paknahad, Z.; Habibagahi, Z.; Maracy, M. The Effects of Garlic ( Allium Sativum ) Supplementation on Inflammatory Biomarkers, Fatigue, and Clinical Symptoms in Patients with Active Rheumatoid Arthritis: A Randomized, Double‐blind, Placebo‐controlled Trial. Phytother. Res. 2020, 34, 2953–2962, doi:10.1002/ptr.6723.
- Letarouilly, J.-G.; Sanchez, P.; Nguyen, Y.; Sigaux, J.; Czernichow, S.; Flipo, R.-M.; Sellam, J.; Daïen, C. Efficacy of Spice Supplementation in Rheumatoid Arthritis: A Systematic Literature Review. Nutrients 2020, 12, 3800, doi:10.3390/nu12123800.
- Zou, P. Traditional Chinese Medicine, Food Therapy, and Hypertension Control: A Narrative Review of Chinese Literature. Am. J. Chin. Med. 2016, 44, 1579–1594, doi:10.1142/S0192415X16500889.
- Motta, F.; Gershwin, M.E.; Selmi, C. Mushrooms and Immunity. J. Autoimmun. 2021, 117, 102576, doi:10.1016/j.jaut.2020.102576.
- Ros, E. Health Benefits of Nut Consumption. Nutrients 2010, 2, 652–682, doi:10.3390/nu2070652.
- De Greef, D.; Barton, E.M.; Sandberg, E.N.; Croley, C.R.; Pumarol, J.; Wong, T.L.; Das, N.; Bishayee, A. Anticancer Potential of Garlic and Its Bioactive Constituents: A Systematic and Comprehensive Review. Semin. Cancer Biol. 2021, 73, 219–264, doi:10.1016/j.semcancer.2020.11.020.
- Rahnasto-Rilla, M.; McLoughlin, P.; Kulikowicz, T.; Doyle, M.; Bohr, V.; Lahtela-Kakkonen, M.; Ferrucci, L.; Hayes, M.; Moaddel, R. The Identification of a SIRT6 Activator from Brown Algae Fucus Distichus. Mar. Drugs 2017, 15, 190, doi:10.3390/md15060190.
- Aune, D.; Giovannucci, E.; Boffetta, P.; Fadnes, L.T.; Keum, N.; Norat, T.; Greenwood, D.C.; Riboli, E.; Vatten, L.J.; Tonstad, S. Fruit and Vegetable Intake and the Risk of Cardiovascular Disease, Total Cancer and All-Cause Mortality—a Systematic Review and Dose-Response Meta-Analysis of Prospective Studies. Int. J. Epidemiol. 2017, 46, 1029–1056, doi:10.1093/ije/dyw319.
- Macready, A.L.; George, T.W.; Chong, M.F.; Alimbetov, D.S.; Jin, Y.; Vidal, A.; Spencer, J.P.; Kennedy, O.B.; Tuohy, K.M.; Minihane, A.-M.; et al. Flavonoid-Rich Fruit and Vegetables Improve Microvascular Reactivity and Inflammatory Status in Men at Risk of Cardiovascular Disease—FLAVURS: A Randomized Controlled Trial,,,,. Am. J. Clin. Nutr. 2014, 99, 479–489, doi:10.3945/ajcn.113.074237.
- Kutlu, A.; Öztürk, S.; Taşkapan, O.; Önem, Y.; Kiralp, M.Z.; Özçakar, L. Meat-Induced Joint Attacks, or Meat Attacks the Joint: Rheumatism Versus Allergy. Nutr. Clin. Pract. 2010, 25, 90–91, doi:10.1177/0884533609357564.
- Tong, T.Y.N.; Appleby, P.N.; Bradbury, K.E.; Perez-Cornago, A.; Travis, R.C.; Clarke, R.; Key, T.J. Risks of Ischaemic Heart Disease and Stroke in Meat Eaters, Fish Eaters, and Vegetarians over 18 Years of Follow-up: Results from the Prospective EPIC-Oxford Study. BMJ 2019, l4897, doi:10.1136/bmj.l4897.
- Maki, K.C.; Wilcox, M.L.; Dicklin, M.R.; Buggia, M.; Palacios, O.M.; Maki, C.E.; Kramer, M. Substituting Lean Beef for Carbohydrate in a Healthy Dietary Pattern Does Not Adversely Affect the Cardiometabolic Risk Factor Profile in Men and Women at Risk for Type 2 Diabetes. J. Nutr. 2020, 150, 1824–1833, doi:10.1093/jn/nxaa116.
Accepted on: 25 Dec 2023
Second Review by: Renu Thakur
Final Approval by: Dr. Shih-Min Hsia


Web of Science Coverage
Emerging Sources Citation Index (ESCI)
2024 Journal Impact Factor: 1.1
Scopus Journal Metrics
CiteScore 2025: 2.6
CiteScore Details
Sustainable Nutrition: Food Systems, Nutrient Retention, and Public Health Impact
![]()
This journal is a member of, and subscribes to the principles of, the Committee on Publication Ethics (COPE)


