Health Concern of Phenomenally Premium Boba Milk Tea and Pearls Beverages in Kuala Lumpur: Sugary Content and Physico-chemical Profiles Analysis
Saiful Irwan Zubairi1*
, Muhammad Harith Afifi Muhamad Zahiri1 and Nur Huda-Faujan2 Department of Food Sciences, Faculty of Science and Technology, Universiti Kebangsaan Malaysia, UKM Bangi, Selangor, Malaysia.
Food Biotechnology Programme, Faculty of Science and Technology, Universiti Sains Islam Malaysia, Nilai, Negeri Sembilan.
Corresponding Author E-mail: saiful-z@ukm.edu.my
DOI : http://dx.doi.org/10.12944/CRNFSJ.11.2.20
Download this article as:
![]()
The sugary drink boba milk tea has seen its popularity surge in recent years. However, the overwhelmingly trending boba milk tea is categorised as a sugar-sweetened beverage due to its high sugar content. Therefore, the objective of this study was to determine the sugar content of four brands of boba milk tea drinks (brand A, B, C, and D) available around Setapak, Kuala Lumpur, Malaysia. The physico-chemical characteristics of each brand were evaluated comprising the pH level, Total Dissolved Solids (TDS), conductivity value, and liquid density. In addition, the glucose content in the liquid milk and boba pearls were determined using the glucometer and gravimetric analysis, which were then used to estimate the total glucose content in the boba milk tea samples. Based on the results, there were significant differences between the pH value and glucose content (p < 0.05). The pH of brand A recorded the highest value of 8.23 ± 0.03 (slightly alkaline) compared to other brands. The liquid milk of Brand A also exhibited the highest glucose content value and the highest density value (p < 0.05) with a value of 23.4 ± 0.5 mmol/L and 1030 g/L, respectively. However, brand D possessed the highest TDS content and conductivity with values of 1912 ± 36 ppm and 3825 ± 71 µS, respectively. Meanwhile, the highest glucose content in the liquid milk and boba pearls were 23.4 ± 0.5 mmol/L (brand A) and 18.1 ± 0.4 (brand B), respectively. Overall, the study estimated that brand B has the highest total glucose content (38.6 ± 0.1 mmol/L) due to the significant glucose content from the boba pearls. Surprisingly, the overall glucose content in boba milk tea (milk tea solution and boba pearl) was approximately from 2- to 5-fold more than the recommended daily sugar (glucose) intake of 8.33 mmol/L (equivalent to 50 g/day) by the Ministry of Health (MOH), Malaysia. The lack of preventive measures to curb the overconsumption of boba milk tea would cause a long-term adverse health effect on individuals and increase the rate of patients suffering from diabetic-related diseases and other non-communicable diseases (NCD). An intervention is required instantaneously from a public health perspective to regulate the consumption of sweetened and flavored beverages that is limitless added to sugar-sweetened beverages (SSB) without strict regulations.
KEYWORDS:Boba milk tea; Boba pearl; Diabetes; Physico-chemical; Sugar content
Introduction
Boba milk tea is a popular East Asian tea drink made from cassava seeds and mixed with sweeteners and seasonings, shaken until foamy, and usually served cold in a large plastic cup. Boba milk tea was invented in Tainan and Taichung in the 1980s as a Taiwanese tea-based beverage, which earned its name ‘boba’ from the Taiwanese word for chewy cassava balls.1, 2 Generally, the main ingredient in this kind of beverage is “boba” or “pearl” balls. These boba balls are made of tapioca, which are boiled to produce a small rounded chewy ball that is then added to hot and cold beverages such as tea, coffee, smoothies, slushies, and blended beverages.3 Moreover, the chewy balls, or boba pearls, are mostly made of processed tapioca flour and some of cassava flour, which is found from a type of root, known as gluten-free cassava root. Cassava is abundant and commonly found in South Africa. Cassava root consists of carbohydrates and sugar, which provides a great source of energy. However, the toxicity of cassava root, which contains high levels of cyanide, is not inhibited when eaten without treatment. Hence, it should be detoxified before eating to avoid nausea, vomiting, and paralysis. These boba pearls are soaked and boiled in water before being stored in brown sugar syrup for several hours to maintain the chewy texture and sweet taste. The appearance of boba pearls can also change from its natural white colour to brown after being boiled in brown sugar or added with caramel dye. Rarely, eucalyptus balls are used, which are made from cassava essence, caramel, and chamomile root, and have different flavours.1 More commonly used, eucalyptus pearls, and are made from cassava essence, caramel, and chamomile root and have different flavours1, 2
Over the years, the original boba milk tea has evolved into many variations. Internet blogs describe boba as more than just a tea drink; some have suggested it as a dessert tea.2 Boba milk tea is available across Malaysia in many shopping malls, designer shops, and even in fancy restaurants, and has become one of the favourite drinks and places to hang out among the youth. As of 2020, there are 102 boba milk tea brands in Malaysia compared to only 49 in 2019, indicating the booming boba milk tea industry.4 Among the famous boba milk tea retailers and their variance are Gongcha, Tealive, Xin Fu Tang, Black Whale, Tiger Sugar, and Chizu. An example of the thriving boba milk tea phenomenon can be seen in SS15 Subang Jaya, Selangor, Malaysia, where the boba milk tea chain store has grown from a single unit to eight units in a just few months.5 With a price range from RM 6.50 to RM 15.00 per cup, boba milk tea is considered an affordable and daily drink for some consumers.6 This drink is also becoming popular that individuals would make their versions of boba milk tea using the basic ingredients that are easily available in supermarkets nationwide.
Despite its popularity, nutritionists and researchers have warned the public of the potential health risk of this drink, which could contribute to many negative side effects due to its extremely high amount of sugar content. To further complicate matters, a nutrition label is not provided in any boba milk tea products that specifically state the content of the drink. Therefore, boba milk tea should be consumed with caution as it is not the healthiest available drink. In fact, there is a growing concern over the significant increase of overall energy level in the body when an individual consumes sugary products, especially in the form of sugary drinks, which also reduces the intake of foods that contain more nutritious calories. According to the World Health Organisation (WHO) (2015),7 the recommended sugar intake is approximately 10% of the daily energy intake of around 50 g. In contrast, past research revealed that a special cup of boba milk tea contains 38 g of sugar more than the recommended amount.8 In addition, the high amount of fructose found in sugar-sweetened beverages (SSB) increases the feeling of hunger to a much higher level than glucose (monosaccharides are more commonly found in carbohydrates). Thus, the excessive intake of fructose could trigger the resistance against leptin, which is a major and important hormone that directs the body to stop eating. As a result, SSB with high sugar content would affect the health of individuals if consumed on a regular basis.
Furthermore, the potential increase in SSB intake around the world in the coming years corresponds with the rising rate of obesity. While SSB has been identified to contribute to the increase in obesity rates, recent study has also found that the risk of weight gain, type 2 diabetes mellitus (T2DM), and cardiovascular disease has a strong link with long-term sugary drink consumption.9 SSB contributes to weight gain due to the high sugar content and low satiety resulting in high energy intake.10 Additionally, diabetes mellitus is a group of diseases characterised by a state of hyperglycemia caused by defects in the secretion of insulin by the body. Chronic hyperglycemia is associated with long-term damage, lameness, and organ failures, especially the liver, eyes, nerves, blood vessels, and heart. Most cases of diabetes are divided into two categories. The first category is type 1 diabetes, where patients lack insulin secretion to control their blood glucose levels. Individuals at risk of type 1 diabetes can be identified by serological results of the autological processes of the immune system that occur in the pancreas via DNA sequencing. The second category is T2DM, which is a combination of resistance to insulin and the inability of the body to continue secreting enough insulin.11
Since SSB contains high quantities of easily absorbed sugars, such as High-Fructose Corn Syrup (HFCS), SSB can increase the risk of T2DM and cardiovascular disease as it contributes to a High Glycemic (GL) diet, which causes inflammation, insulin resistance, and affecting the B-cells functions.12 Furthermore, HFCS content is also able to increase blood pressure and promote the accumulation of visceral endurance, dyslipidemia, and ectopic fat deposition due to the increased Hepatic de Novo Lipogenesis (HNL).13 Moreover, the soaking and boiling of cassava balls in brown sugar ingredients further increases the sugar content in the drink and stimulate high blood sugar levels in the body. The boba pearls could also cause painful stomach problems in elderly people as they are difficult to chew and may cause digestive disorders due to their declining metabolic rate with age. Therefore, this study aimed to investigate the sugar content and physico-chemical profiles of premium boba milk tea and boba pearls of sugar-sweetened beverages (SSB) in Setapak, Kuala Lumpur, Malaysia.
Materials and Methods
Materials
Beverage Preparation
Three replicas of boba milk tea were bought from four branded stores, namely brand A, brand B, brand C, and brand D (n = 12) located in Setapak, Kuala Lumpur. Each cup was ordered with the same condition/cocktail, which was milk tea with boba pearls without regular-sized ice with the price ranging from MYR9.00 to MYR15.00. All beverages were using a specialised water filter unit (e.g., COWAY and CUCKOO brand) that filter tap water prior to product preparation. All beverages were purchased on the same day and were left at room temperature for one hour after they were purchased. Then, the beverage volumetric values (100 mL) in each cup were measured excluding the weight of boba pearls prior to the physico-chemical analysis.
Physico-chemical and Glucose Content Determination of Boba Milk Tea Drink
In this study, the content of the boba milk tea was analysed, which include the liquid milk and the boba pearls. The analyses were performed for all four boba milk tea samples (brand A, B, C and D). Three replications were conducted for each brand of boba milk tea drink (n = 3).
Physico-chemical Analysis
The pH value, Total Dissolved Solids (TDS), and electrical conductivity of the boba milk tea were measured using a HI 991300 single probe water tester (HANNA Instruments, Washington, USA).14 The device was calibrated in triplicate (n = 3) by washing and soaking the probe in distilled water (free from solid, mineral and trace mineral residuals) prior to the sample analysis. The device was then soaked in the boba milk tea sample for a while to determine the desired parameters. The result was recorded once the reading was stable.
Glucometer
The Accu-ChekTM Softclix glucometer was used along with the Accu-Chek Guide test strip to calculate the glucose content of the boba milk tea. Approximately 1.0 mL of boba milk tea with a ten-time (10x) dilution process using distilled water was used as the sample since the device was unable to measure the high glucose content from the original drink. The results of the analysis were recorded in mmol/L units.
Gravimetric Analysis
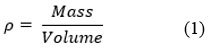
Approximately 50 mL of boba milk tea was transferred into 100 mL beaker and weighed using analytical balance. Then, the density of the sample was calculated using the density formula (Equation 1)15:
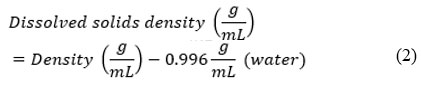
Then, using the water density data (which was approximately 0.996 g/mL), the density of the dissolved solid mass was obtained based on the following formula (Equation 2):
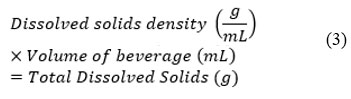
Using the obtained dissolved solid density, the mass of the dissolved solid was calculated, as follows (Equation 3):
The density verification test was carried out by adding glucose (Sigma-AldrichTM; 99% in purity) to distilled water (50 mL) at room temperature based on the glucose content obtained from the density method and repeating the calculation to obtain the density of the solution using Equation 1-3. The paired T-test analysis was employed to compare the obtained density values and the verified density values to determine the accuracy of the verification test.
Glucose Content in Boba Pearls
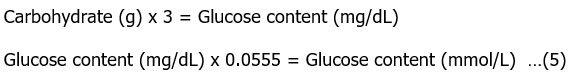
Boba pearl samples were removed from the drink and dried under the sun for 24 hours to obtain dried boba pearls before their weight was measured. The recalculation of the carbohydrate content (Equation 4) was then carried out with reference to the boba nutrition information by the United States Department of Agriculture (USDA) (2019).15

The glucose content was determined by performing a theoretical calculation based on the assumption that 1 g of carbohydrate is equivalent to 3 mg/dL glucose level (Equation 5).16 The results were recorded in mmol/L units. The total glucose content in the boba milk tea drink was determined by adding the calculated glucose content of the liquid milk and the glucose content of the boba pearls.
Statistical Analysis
The results of all analysis were recorded in the form of mean ± standard deviation. The difference between the mean of each sample was analysed based on the Analysis of Variance (ANOVA) procedure, followed by the Tukey test using a Minitab software version 18.0.17 The difference between the mean was considered significant if p < 0.05.
Results and Discussion
pH Profiles
The results in Figure 1 show that brand A exhibit the highest average pH value of 8.23 ± 0.03, followed by brand D, brand B, and brand C with 7.98 ± 0.06, 7.82 ± 0.01, and 7.55 ± 0.04, respectively. The statistical analysis indicated significant differences between all brands (p < 0.05). Overall, the pH level of the boba milk tea drink was in the range of 7.55 to 8.23, which was between neutral and slightly alkaline. The usage of two different kind of water filter machines (e.g., COWAY and CUCKOO of unknown specifications (reversed osmosis or filtration unit)), types of tea used, brewing method and variation of undisclosed formulations (NDA: non-disclosure agreement issue to the workers), might have contributed to the large differences between all products (p < 0.05). In comparison, the pH value of black tea (control) is between 4.99 and 5.55.18 Hence, the pH value of tea drinks depends heavily on the ingredients used in the manufacture of these types of teas as the brewing method plays the essential roles in extracting the specialised phytochemicals that will eventually give the distinctive aroma, taste and bitterness.
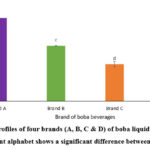 |
Figure 1: The pH profiles of four brands (A, B, C & D) of boba liquid milk tea (n = 12). |
Total Dissolved Solids (TDS)
As shown in Figure 2, brand D measured the highest TDS value of 1912 ± 36 ppm, followed by TDS of brand A, brand C, and brand B with 1552 ± 47 ppm, 1476 ± 17 ppm, and 1369 ± 11 ppm, respectively. Only brand A and brand C showed an insignificant difference. Referring to the findings, brand D has a higher TDS value than other brands due to the possibly higher content of inorganic salts or organic matter in the drink. Previously, Thirumalini & Joseph (2009)19 stated that the amount of soluble solids in a material corresponds to its conductivity level. Likewise, all brands showed a clear correlation between the TDS and electrical conductivity (Figure 3) via linear regression with R2 of 0.9999. Hence, it was assumed that the high TDS value of brand D was contributed by the presence of a high amount of inorganic salts, which correlated with the high conductivity value. Among the possible inorganic salts presented are calcium, magnesium, sodium, and potassium and the concentration of total soluble substances in water from natural sources (domestic supplies) ranges from 30 mg/L to 6000 mg/L depending on its locality of natural sources. 20,21 In fact, high concentrations of soluble solids usually do not have a detrimental health effect but lower concentrations in beverages are known to give an unpleasant flavour or tasteless.22
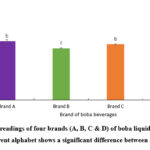 |
Figure 2: The TDS readings of four brands (A, B, C & D) of boba liquid milk tea (n = 12). |
Electrical Conductivity
The highest electrical conductivity value was measured in brand D, which was 3825 ± 71 µS, followed brand A, brand C, and brand B with 3100 ± 94 µS, 2953 ± 36 µS, and 2738 ± 23 µS, respectively (Figure 3). However, there was an insignificant difference (p > 0.05) between brand A and brand C. Generally, electrical conductivity measures the ability of a liquid to conduct an electric current and this ability depends on the concentration of dissolved ions, the temperature at which the measurement is made, and the strength of the ionic contact.23,24 Given that the TDS corresponds with the conductivity25, brand D has a higher conductivity due to the greater amount of soluble solids that increases the ability to conduct electricity. Based on the results of the TDS, the obtained conductivity results showed a similar trend for all brand samples, which showed that the amount of soluble solids affected the electrical conductivity.26
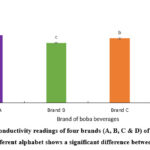 |
Figure 3: The electrical conductivity readings of four brands (A, B, C & D) of boba liquid milk tea (n = 12). |
Density
According to Figure 4, brand A recorded the highest density value of 1030 g/L, followed by brand C, brand B, and brand D with 1007 ± 6 g/L, 1003 ± 6 g/L, and 977 ± 2 g/L, respectively. The insignificant difference was detected between brands B and C. While brand A showed the highest density value, the results of this analysis were not in line with the report by the United States Environmental Protection Agency (EPA) (2014),27 which states that the density of water is directly proportional to the number of solids dissolved in water. Brand D, which was supposed to record a greater density value based on its higher TDS value, showed a density lower than the water density, which is 1.0 g/mL. In fact, the brand D TDS values (Figure 2) was higher than the other brand (p < 0.05) which indicate possibly higher content of inorganic salts or organic matter in the drink. Thus, the reading was lower than the water density due to the additional of ions to the water solution (solvent) which could change the packing density of the water as well as the average hydrogen bond length.28
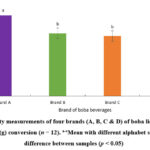 |
Figure 4: The density measurements of four brands (A, B, C & D) of boba liquid milk tea prior to glucose content (g) conversion (n = 12). |
Glucose Content in Boba Milk Tea
Analysis of Glucose Content based on the Glucometer and Gravimetric Methods
The glucometer analysis showed that brand A had the highest glucose content of 23.4 ± 0.5 mmol/L, followed by brand B, brand D, brand C with 20.4 ± 0.4 mmoL/L, 15.5 ± 0.6 mmoL/L, and 12.7 ± 0.3 mmol/L, respectively (Figure 5). The insignificant differences (p > 0.05) were detected between brands A and B as well as brands C and D, respectively.
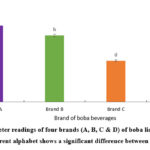 |
Figure 5: The glucometer readings of four brands (A, B, C & D) of boba liquid milk tea (n = 12). |
Meanwhile, Table 1 shows the data obtained using the gravimetric method, which indicates the highest soluble organic matter content in brand A with a value of 14.57 ± 0.43 g, followed by brand C, brand B, and brand D with a value of 4.86 ± 2.6 g, 3.38 ± 2.91 g, and -7.43 ± 0.87 g, respectively. An insignificant difference (p > 0.05) was shown between brand B and brand C. When the glucose content results between glucometer and gravimetric methods were compared, it was found that the glucometer measurement provided a more accurate dataset compared to that of the gravimetric approach. This is because the gravimetric method used the density data, which considers the weight of water and any additional of ions (e.g., iodised sodium chloride) to the water solution (solvent) could change the packing density and eventually giving inaccurate density reading.28 Therefore, the gravimetric result does not represent the weight of soluble solids alone in the beverage. In addition, the density of the milk tea drink does not show a linear relationship with the value of soluble solid content because it has reached the maximum level and cannot be correlated with one content only. Therefore, additional parameters are required to calculate all the contents of the milk tea accurately.
Table 1: Glucose content in boba liquid milk tea analyzed via glucometer and gravimetric methods
|
Brand |
Density (g/mL) |
Glucose content (g) |
|
|
Gravimetric |
Glucometer |
||
|
A |
1.03 ± 0.005 |
14.57 ± 0.43a |
17.8 ± 0.3a |
|
B |
1.00 ± 0.006 |
3.38 ± 2.91b |
17.7 ± 0.7a |
|
C |
1.01 ± 0.006 |
4.86 ± 2.6c |
10.9 ± 0.6ab |
|
D |
9.77 ± 0.002 |
-7.43 ± 0.87* |
10.5 ± 0.2ac |
a-cMean with a different alphabet indicates a significant difference between samples (p < 0.05). *N/A: Not applicable
Furthermore, the accuracy of measurement using the gravimetric method depends on the accuracy of the density-measuring equipment, the calculation of variation, and the reference data used.29 A previous study by Tso (2019)30 reported the high sugar content in boba drinks ranging from 37.5 g to 90 g. These values exclude the sugar content of additives in the milk tea, such as boba pearls, biscuit powder, and nata de coco. Therefore, the gravimetric method was less accurate to measure the value of soluble substances in boba milk tea drinks. Additionally, Table 2 shows the glucose content comparison between the obtained density values and the verified density values to determine the accuracy of the verification test. It was found that there was no significant difference (p > 0.05) between the original density and verified density, indicating that the density verification test was accurate.
Table 2: Density verification test (sensitivity test) using the paired T-test of gravimetric method
|
Brand |
Boba milk tea density (g/L) |
Verified density of analytical glucose solution (g/L) |
Comparison analysis (p-value) |
|
A |
1030 ± 5a |
1017 ± 6a |
0.057 |
|
B |
1003 ± 6a |
1007 ± 6a |
0.646 |
|
C |
1007 ± 6a |
1017 ± 12a |
0.225 |
|
D |
977 ± 2a |
988 ± 10a |
0.210 |
aMean with a different alphabet indicates a significant difference between samples (p < 0.05).
Glucose Content in Boba Pearls
According to Table 3, Brand B has the highest glucose content with an average value of 18.1 ± 0.4 mmol/L per cup, followed by brand A, brand C, and brand D with an average value of 8.5 ± 1.4 mmol/L per cup, 6.5 ± 1.0 mmol/L per cup, and 5.6 ± 0.6 mmol/L per cup, respectively. Based on the findings, brand B demonstrated the highest glucose content since the quantity of boba pearls placed in one cup was significantly higher compared to that of other brands, as indicated by the weight of dried boba pearls (122.78 ± 2.48 g). In fact, the carbohydrate content in dried boba pearls was more than 80% (w/w) of the total weight of the fresh boba pearls (20% (w/w): water content).3 Therefore, the weight of boba pearls is directly proportional to the total carbohydrate content in boba pearls.
Table 3: Glucose content in dried boba pearls
|
Brand |
Weight of dried boba pearls (g) |
Carbohydrate content of boba pearls (g) |
Glucose content of boba pearls (mmol/L) |
|
A |
57.48 ± 7.80 |
50.98 ± 9.6 |
8.5 ± 1.4b |
|
B |
122.78 ± 2.48 |
108.89 ± 3.1 |
18.1 ± 0.4a |
|
C |
43.71 ± 5.79 |
38.77 ± 6.8 |
6.5 ± 1.0bc |
|
D |
39.00 ± 3.44 |
34.59 ± 4.2 |
5.8 ± 0.6c |
a-cMean with a different alphabet indicates a significant difference between samples (p < 0.05)
Estimation of Overall Glucose Content in Boba Milk Tea
As shown in Table 4, brand B contains the highest total glucose amount with an average value of 38.6 ± 0.1 mmol/L, followed by brand A, brand D, and brand C with an average value of 31.4 ± 1.3 mmol/L, 21.3 ± 1.0 mmol/L, and 19 ± 0.8 mmol/L, respectively. Despite the difference, the glucose content obtained in all boba milk tea brands in this study was exceedingly higher than that recommended by the Malaysian Diet Guide (2010)31 and WHO (2015)7, which limits the glucose content in beverages to only 8.33 mmol/L or 50 g/day (direct conversion from Equation 4 and 5). Furthermore, the glucose content in boba milk tea exceeds the normal glucose level in the blood under fasting conditions, which is in the range between 4.0 and 5.6 mmol/L12,32 and the blood glucose level in diabetic patients, which is 7.0 mmol/L.31
Table 4: Estimation of total glucose content for the four brands of boba milk tea
|
Brand |
Glucose content (mmol/L) |
Total glucose content (mmol/L) |
|
|
Liquid milk tea |
Dried boba pearls |
||
|
A |
23.4 ± 0.5a |
8.5 ± 1.4b |
31.4 ± 1.3b |
|
B |
20.4 ± 0.4b |
18.1 ± 0.4a |
38.6 ± 0.1a |
|
C |
12.7 ± 0.3d |
6.5 ± 1.0bc |
19.2 ± 0.8c |
|
D |
15.5 ± 0.6c |
5.6 ± 0.6c |
21.3 ± 1.0c |
a-dMean with different alphabet shows a significant difference between samples (p < 0.05).
Recently, Teshima et al. (2015)33 reported that 20 out of 93 subjects were diagnosed with diabetes mellitus after consuming sugar-sweetened beverages (SSB) regularly for seven years. In addition, diabetic subjects showed significant changes in glucose levels after taking 75 g of glucose from an initial of 6.2 ± 0.2 mmol/L under fasting conditions to 10.8 ± 0.4 mmol/L after 30 minutes of digestion and continued to increase to 12.4 ± 0.3 mmol/L after 120 minutes of digestion. This shows that blood glucose levels rapidly increase by 4.7 mmol/L after drinking a beverage containing 75 g of sugar content. According to Imamura et al. (2015)34, the increased intake of sugary drinks over one serving per day has been associated with an increase of 18% of type 2 diabetes mellitus (T2DM) cases. Thus, it was demonstrated that the glucose content in boba milk tea exceeds 56.4 ± 1.9% to 78.4 ± 0.1% (2- to 5-fold increase) of the daily sugar intake quantity recommended by the Ministry of Health (MOH), Malaysia. Failure to take precautionary measures to prevent overconsumption of boba milk tea beverages would inevitably have a long-term adverse impact on the health of individuals as well as lead to an alarming rate of diabetic-related diseases in the country.
Conclusion
In conclusion, all brands of boba milk tea drinks analyzed in this study contain an extremely high sugar content that exceeds the recommended intake quantity by health bodies for all ages and genders. The glucose content of boba milk tea determined using the glucometer method provided greater accuracy and consistent results compared to the gravimetric method (two out of three brand, excluding brand D). Overall, the glucose content in the liquid milk for four different brands ranged between 12.7 ± 0.3 mmol/L (brand C) and 23.4 ± 0.5 mmol/L (brand A), while the glucose content in boba pearls ranged from 5.6 ± 0.6 mmol/L (brand D) to 18.1 ± 0.4 mmol/L (brand B). It was clearly shown that the glucose content in boba pearls caused an increase in the total glucose content of boba milk tea with the highest estimated total glucose content in brand B of 38.6 ± 0.1 mmol/L, which was substantially beyond the recommended 8.33 mmol/L (equivalent to 50 g/day) daily sugar intake by MOH. A steep increase of theoretical glucose content ranging from 2- to 5-fold in all four commercially available SSB in Malaysia were considered alarming and worrisome. Given this important knowledge about the caloric value and sugar source of boba milk tea drinks, nutrition education targeting at the early age of Malaysian populations should give a special attention on this type of SSB that could potentially developed non-communicable related diseases (NCD). Given that this popular beverage will only become more popular, recommendations from public health practitioners should suggest moderate consumption of boba drinks, choosing options for less sugar, and not adding other ingredients such as pudding or jelly. Moreover, experimental limitation was still considered a big issue during the whole study was conducted. The usage of two different kind of water filter machines (e.g., reversed osmosis or filtration unit of unknown specifications, types of tea used, brewing method and variation of undisclosed formulations (NDA: non-disclosure agreement issue to the workers) are the main uncontrol limitation that need to be verified and overcome for future systemic studies.
Acknowledgement
We are grateful to Universiti Kebangsaan Malaysia for the financial support and the Department of Food Sciences, Faculty of Science and Technology, Universiti Kebangsaan Malaysia Bangi for allowing this study to be carried out at the functional food and nutritional laboratory.
Funding Source
Universiti Kebangsaan Malaysia for the financial support (GUP-2018-057; GUP-2018-080; GP-2023-K015328; DPB-2023-038).
References
- Weil, A. Is boba tea bad?. http://www.drweil.com/drw/u/QAA401193/Is-Boba-Tea-Bad.html. 2012. [Accessed on 23rd November 2020].
- http://www.teamuse.com/article_021001.html. 2015 [Accessed in 23rd November 2020].
- Bubble Tea Malaysia Team. 100+ Bubble Tea Malaysia Brands Updated 2020. https://www.bubbleteamalaysia.com/. 2020 [Assessed on 7th December 2020].
CrossRef - Michael, K. Article: Chaotic situation at Subang Jaya business hub https://www.thestar.com.my/metro/metronews/2019/05/13/chaoticsituation-atsubang-jayabusiness-hub/. 2019 [Accessed on 7th December 2020].
- Pang, V. The #10YearChallenge: 7 Ways Bubble Tea Has Evolved in Malaysia. https://vulcanpost.com/656608/grab-bubble-teadelivery-boba/. 2019 [Accessed on 7th Disember 2020].
- WHO. WHO calls on countries to reduce sugar intake among adults and children. 2015, Geneva. World Health Organization.
- Min J. E., Green D. B., Kim L. Calories and sugars in boba milk tea: implications for obesity risk in Asian Pacific Islanders. Food Sci Nutr. 2016; 5(1): 38-45.
- Malik V. S., Popkin B. M., Bray G. A., Després J. P., Hu, F. B. Sugar-sweetened beverages, obesity, type 2 Diabetes mellitus, and cardiovascular disease risk. Circ. 2010; 121(11):1356-1364.
CrossRef - DiMeglio D. P., Mattes R. D. Liquid versus solid carbohydrate: effects on food intake and body weight. Int. J Obes (Lond). 2000; 24(6):794-800.
CrossRef - ADA. American Diabetes Association (ADA) – The Bog Picture: Checking your blood glucose. https://www.diabetes.org/healthy-living/medication-treatments/blood-glucose-testing-and-control/checking-your-blood-glucose. 2015 [Accessed on 21st January 2021].
CrossRef - Schulze M. B., Manson J. E., Ludwig D. S., Colditz G. A., Stampfer M. J., Willett W. C., Hu F. B. Sugar-sweetened beverages, weight gain, and incidence of type 2 diabetes in young and middle-aged women. JAMA. 2004; 292(8):927-934.
- Stanhope K. L., Schwarz J. M. Keim N. L. Griffen S. C., Bremer A. A., Graham J. L., Hatcher B., Cox C. L., Dyachenko A., Zhang W., McGahan, J. P. Consuming fructose-sweetened, not glucose-sweetened, beverages increases visceral adiposity and lipids and decreases insulin sensitivity in overweight/obese humans. J Clin Investig. 2009; 119(5):1322-1334.
CrossRef - Zubairi S. I., Ishak N., Sani N. A., Kassim Z. M., Nurzahim Z. Yogurt Drink Spoilage Profiles: Characterization of Physico-Chemical Properties and Coliform Potability Analysis. Arab J Chem. 2021; 14(9), 103340.
CrossRef - USDA. Food data central: Tapioca, pearl, dry. 2019. United States Department of Agriculture. https://fdc.nal.usda.gov/fdc-app.html#/food-details/169717/nutrients [Accessed on 15th February 2021].
CrossRef - UWHealth. Carbohydrate (Carb) Gram Counting at the Hospital. Department of Nursing University of Wisconsin Hospitals and Clinics Authority. 2019.
- Jurid L. S., Zubairi S. I., Kasim Z. M., Ab Kadir I. A. The Effect of Repetitive Frying on Physicochemical Properties of Refined, Bleached and Deodorized Malaysian Tenera Palm Olein During Deep-Fat Frying. Arab J Chem. 2020; 13(7), p6149-6160.
- Reddy A., Norris D. F., Momeni S. S., Waldo B., Ruby J. D. The pH of beverages in the United States. J Am Dent Assoc. 2016; 147(4):255-263.
CrossRef - Thirumalini S., Joseph K. Correlation between electrical conductivity and total dissolved solids in natural waters. Malaysian J Sci.2009; 28(1):55-61.
CrossRef - Sulaiman N., Zubairi S. I., Sani N. A., Kasim Z. M. The Efficacy of Treated Water from Water Filtration Machines for Safe Drinking Water Supply in Bandar Baru Bangi and Kajang, Selangor. J Food Qual. 2020; 3536420, Article ID 3536420, 9 Pages.
CrossRef - WHO. Total dissolved solids in Drinking-water. WHO Guidelines for Drinking-water Quality. Geneva. 2003. World Health Organization.
CrossRef - Jahagirdar S., Patki V. K., Thavare M., Patil M. S., Rangre S. Comparative study of water quality parameters of different brands of soft drinks. IOSR Journal of Mechanical and Civil Engineering. (IOSRJMCE). 2015; 142-149.
- Logeshkumaran A., Magesh N. S., Godson P. S., Chandrasekar N. Hydro-geochemistry and application of water quality index (WQI) for groundwater quality assessment, Anna Nagar, part of Chennai City, Tamil Nadu, India. Appl Water Sci. 2015; 5(4):335-343.
- Marandi A., Polikarpus M., Jõeleht A. A new approach for describing the relationship between electrical conductivity and major anion concentration in natural waters. J Appl Geochem. 2013; 38:103-109.
CrossRef - Thirumalini S., Joseph K. Correlation between electrical conductivity and total dissolved solids in natural waters. Malaysian J Sci.2009; 28(1):55-61.
CrossRef - Zubairi S. I., Ab Kadir I. A., Nurzahim Z. Long Term Repetitive Frying Effect on Physicochemical Properties of Refined, Bleached and Deodorized Malaysian Tenera Palm Olein During Deep-Fat Frying. Arab J Chem. 2022; 15(4), 103726.
CrossRef - EPA. Sediments. In Water: Pollution Prevention & Control. http://water.epa.gov/polwaste/sediments/. 2014 [Accessed on 5th January 2021].
CrossRef - Dougherty, R. C. Density of Salt Solutions: Effect of Ions on the Apparent Density of Water.
- J Phys Chem B. 2001; 105, 19, 4514–4519.
- Green D. W., Southard M. Z. Perry’s chemical engineers’ handbook. McGraw-Hill Education. 2019; 6:1-19.
CrossRef - Tso R. What’s In My Bubble Tea? http://singtel.network/stage-mtalvernia/education/whats-in-my-bubble-tea/. 2019 [Accessed on 24th January 2021].
- Malaysia Diet Guide [Panduan Diet Malaysia]. Kumpulan Kerja Teknikal Panduan Diet Malaysia. 2010. Ministry of Health Malaysia [Kementerian Kesihatan Malaysia].
- NIH. Your guide to diabetes: Type 1 and type 2. National diabetes information clearinghouse: A service of the national institute of diabetes and digestive and kidney diseases. National Institutes of Health (NIH). https://www.niddk.nih.gov/-/media/Files/Diabetes/ YourGuide2Diabetes_508.pdf. 2006 [Accessed on 22nd January 2021].
- Teshima N., Shimo M., Miyazawa K., Konegawa S., Matsumoto A., Onishi Y., Sasaki R., Suzuki T., Yano Y., Matsumoto K., Yamada, T. Effects of sugar-sweetened beverage intake on the development of type 2 diabetes mellitus in subjects with impaired glucose tolerance: the Mihama diabetes prevention study. J Nutr Sci Vitaminol. 2015; 61(1):14-19.
CrossRef - Imamura F., O’Connor L., Ye Z., Mursu J., Hayashino Y., Bhupathiraju S. N., Forouhi N. G. Consumption of sugar sweetened beverages, artificially sweetened beverages, and fruit juice and incidence of type 2 diabetes: systematic review, meta-analysis, and estimation of population attributable fraction. Br Med J. (BMJ). 2015; 351.
CrossRef
Accepted on: 26 Jun 2023
Second Review by: Md. Ashraf Hussain
Final Approval by: Dr. Norazmir Nor


Web of Science Coverage
Emerging Sources Citation Index (ESCI)
2024 Journal Impact Factor: 1.1
Scopus Journal Metrics
CiteScore 2025: 2.6
CiteScore Details
Sustainable Nutrition: Food Systems, Nutrient Retention, and Public Health Impact
![]()
This journal is a member of, and subscribes to the principles of, the Committee on Publication Ethics (COPE)


