Study of Selected Beverages with β-Glucan from Oats and Barley on Physical Properties, Sensory Perception, Glycemic Index and Satiety
Zalifah Mohd Kasim*
and Saiful Irwan Zubairi Department of Food Sciences, Faculty of Science and Technology, Universiti Kebangsaan Malaysia, UKM Bangi, Selangor, Malaysia
Corresponding Author E-mail: zalifah.kasim@ukm.edu.my
DOI : http://dx.doi.org/10.12944/CRNFSJ.10.3.11
Download this article as:
![]()
Over recent years, more and more products with β-glucan have appeared in the market. This study was conducted to determine the physical, sensory evaluation and glycemic index (GI) of selected popular beverages with β-glucan in the Malaysian market, which were Biogrow Oat BG22 (from oats) and Biolife Barley BG25 (from barley). The physical parameters measured were colour, viscosity, and total suspended solid. Sensory analysis was conducted on 30 subjects using the 7-point hedonic scale. Attributes assessed were colour, aroma, viscosity, sweetness and overall acceptance. A total of 10 subjects were involved in the determination of GI value of these beverages. A total of 25 g glucose was used as the reference. Test meals also contained 25 g available carbohydrate and all beverages were mixed with 250 mL water. Blood samples (finger prick) were taken every 15 minutes (first hour) and 30 minutes (second hour) for the duration of 120 minutes after the food sample consumption. Test protocol was based on ISO26642:2010. Blood glucose values were determined using glucometer. A total of 30 subjects were chosen for the determination of satiety scores. Labelled magnitude satiety scale was used to measure satiety scores before and after test beverage consumption. Subjects were required to assess their perception of fullness or hunger by marking on the labelled magnitude satiety scale every 15 minutes for the first hour and 30 minutes for subsequent 2 hour for a total of 180 minutes. The colour analysis showed that BG25 and BG22 were slightly yellow due to positive b* value. The BG22 was more viscous and do not contain any sugar compared to BG25. Blood glucose level after glucose intake reached optimum level (9.9 mmol/L) at 30 minutes while BG25 and BG22 reached optimum level at 45 minutes with the value 7.9 mmol/L and 6.4 mmol/L respectively. Significant difference was found for attributes aroma, viscosity and overall acceptance of the two products. Our study found, BG22 from oats were has better physical attributes and is better accepted by the panelists. However, it is suggested that both products be taken together with milk or soy to improve the taste. The GI for BG25 was 79 (high GI) while BG22 was 32 (low GI). The BG22 with lower GI is significantly more satiating than BG25 and perhaps can be a choice of beverage for people who are managing diabetes and obesity.
KEYWORDS:β-glucan; barley; Glycemic Index; Oat; Physical Properties; Sensory Evaluation; Satiety
Introduction
In this modern era, processing and manufacturing of food have increased tremendously. However, food processing could lead to the reduction of nutritious values of food products and the hectic lifestyle of the society has caused most of the people do not have extra time to prepare nutritious and healthy meal. To compensate the lack of balance diet, supplement or functional food has increased in popularity among the society nowadays.
Functional food is food or part of nutrient which could give benefits to the consumers’ health through basic nutrition1. The word functional in the term functional food was interpreted as food which has significant value and beneficial to health, which include reducing the risk of the consumers from getting sick2. Some examples of functional ingredients in functional food are lycopene, β-glucan, sterol, anthocyanin, omega-3 fatty acid and etc3.
One of the food products which have gain popularity recently in the market is beverages with β-glucan. There are many products with β-glucan has been produced these products are normally derived from different sources and each has different amount of β-glucan. According to Department of Statistics Malaysia, ischemia heart disease is the number one killer disease in Malaysia, with 18,515 (17%) death cases due to medical reasons in 20204. Based on the same report source above, one out of every five adults in Malaysia have type II diabetes. This is most probably reason of these products has been welcomed by consumers today.
β-glucan, the soluble fiber, was proven by many studies that it plays a significant role in human health. β-glucan could promote healthy heart, safe blood glucose level, maintain normal body weight and boost the immune system. Moreover, there are heath claims which were certified by the Health Ministry of Malaysia, that by taking 3 g of β-glucan each day, could reduce the cholesterol level and at the same time maintain normal blood glucose level of consumers. Manufacturers could increase the β-glucan content in their products with barley powder or oat bran5.
Diet with added β-glucan is good for health; these are because the soluble fiber which was ingested will form a viscous gel around the intestine wall. These could reduce the absorb rate of cholesterol and fat into the blood system6. Besides, lowered glycemic index (GI) and reduced appetite after β-glucan consumption could help control diabetes and obesity among the consumers7. Therefore, more and more products containing β-glucan are produced each day. This study looks into the preferred physical and sensory properties as well as the GI of two selected commercial beverage products with β-glucan. What this research intends to do is to investigate if the claimed health β-glucan beverage with no added sugar truly give lower GI value and is satiating enough to delay the onset of next meal.
Materials and Methods
Materials
In this study, two commercial β-glucan beverages and one control glucose beverage were used as study materials. The first product is Biogrow Oat BG22 (BG22). This product has 20% β-glucan from oat bran powder imported from Sweden and sold in pharmacy. The second product is Bio-Life BG Barley 25 (BG25). Based on label claim, it has 20% β-glucan, but it was derived from barley powder. This product is marketed locally by Bio-Life Pte Ltd and was bought from a local pharmacy. The third product was orange flavoured GlucolinTM glucose manufactured by Reckitt Benckiser (Malaysia) Pte Ltd. which was used as reference sample for GI determination. Glucose drink was normally used as reference sample because of its standardized carbohydrate content and it has its GI value as 100. All the samples served to the subjects contained 25 g available carbohydrate7, each sample was dissolved in 250 mL warm water (40oC). Nutrient information obtained from the product label is shown in Table 1.
Table 1: Macronutrients content and weight of sample used.
| Samples | Energy(kcal) | Available Carbohydrate (g) | Fat(g) | Protein (g) | Total Fiber (g) |
| BG22 | 248.4 | 25 | 2.6 | 15.2 | 33.4 |
| BG25GlucolinTM | 252.0102.1 | 2525 | 1.80.0 | 9.60.0 | 24.60.0 |
Note: Data shown is calculated from the Nutrition Information Panel (NIP) on the product’s packaging.
Physical Analysis
Colour analysis of the samples were carried out using Minolta Chromameter (Model CR 300, United States of America), based on Comission Internationale de l’Eclairage (CIE) colour system with L*, a* and b* parameters. All the colours of the samples were measured at room temperature (28oC). The results were taken three times and the mean was obtained. Viscosity of each sample were taken using rotational rheometer (Model Anton Paar Physica MRC301, Austria) at room temperature (28oC). The probe used was of parallel-plate. The viscosity was measured in Pa.s (pascal-second) unit. The results were taken three times and the mean was obtained. Graph of shear force versus shear rate were plotted using the mean values. Measurements of total soluble solid of the samples were measured using hand refractometer (Model N-50E, Atago, Japan). The total soluble solid were measured in °brix unit. The results were taken three times and the mean values was obtained.
Sensory Evaluation
This study has been approved by Universiti Kebangsaan Malaysia Ethics Committee (Ethics Approval Number: UKM PPI/111/8/JEP-2019-761). Sensory tests of the beverage were carried out using 7 points hedonic scale. We did not use the conventional 9 points scale as the scale and form was prepared in Malay language and it is not possible to translate all the 9 English descriptors to Malay. A total of 30 subjects from the Faculty of Science and Technology, Universiti Kebangsaan Malaysia were included in this test. Only the two selected commercial products with β-glucan were used in sensory testing as they are popularly consumed by customers in Malaysia. The sensory evaluation was carried out at room temperature. The attributes tested are colour, aroma, viscosity, sweetness and overall acceptance. All the samples were coded with 3-digit random numbers and were arranged randomly. Plain water was used as mouth rinsing agent.
Glycemic Index
A total of 30 subjects were screened and chosen for satiety scores determination. In that group of subjects, only 10 of them was selected for GI value test. The 10 subjects chosen for GI studies was based on the protocol from ISO26642:20108. The subjects must undergo a screening test before they were finally shortlisted. A questionnaire was used for the first screening test, to screen for subjects who has normal Body Mass Index (BMI) within 18.5 – 24.9 kg/m2 range from World Health Organisation (WHO)9 and be healthy, not smokers and does not have medical condition which can alter the subjects’ appetite. They also must have blood glucose level lower than 110 mg/dL (6.2 mmol/L) during fasting. The tests for GI value conducted in three sessions (one session for each sample), including the reference sample GlucolinTM glucose. Washout period is a week. All the subjects were required to fast for 10-12 hours the night before the tests were carried out.
Before the test, the subjects’ blood glucose level was obtained. The blood glucose level was obtained using finger pricks method with glucometer (ACCU-CHEK Advantage II, United States of America). The subjects were required to consume the sample within 15 minutes before the second measurements were taken. The blood glucose readings were taken at 0, 15, 30, 45, 60, 90, 120 minutes after the samples were served.
Incremental Area under Curve (iAUC) was calculated using the graph of blood glucose level (mmol/L) against time (min). The value obtained was averaged to determine the iAUC for each sample. The GI value of each subject was calculated using the formula below8.
GI value of each subject =[(iAuC of study sample)/(iAUC of reference sample)] x 100
The GI value of each sample was then calculated using the formula below.
GI value of each subject = (ꜪGI value of each subject)/10)
Measurement of Satiety Scores
Subjects were screened based on the criteria for glycemic index. These subjects were requested to answer Three Factor Eating Questionnaire by Stunkard and Messick10. Subjects need to have scores of <10 for restraint, <8 for disinhibition and <7 for hunger categories respectively to be eligible10.
There were three test sessions conducted for the determination of satiety scores, one session for the reference sample (glucose drink) and two sessions for the selected β-glucan containing beverage samples (BG22 and BG25). Subjects need to fill out a 24-hour dietary intake form in detail the day before the first study session. Then, the subjects are required to follow the 24-hour diet intake a day before test day in the subsequent tests. Subjects also need to fast for 10-12 hours at night prior to each test session.
During the study, the subjects were required to completely consume the reference food or the tested samples within the first 15 minutes before the second evaluation is recorded. The satiety evaluation on the labelled magnitude scale was taken at 0 minutes (before food intake). Satiety assessment for time intervals of 0, 15, 30, 45, 60, 90, 120, 150 and 180 minutes respectively after consumption of test beverages. All subjects were required to evaluate satiety perception on the labelled magnitude scales for each time intervals. Labelled magnitude satiety scale by Zalifah et al.11 was used to assess satiety levels at the various time intervals. A form with the scale (Figure 2) was given to each subject to describe how they felt after eating the test beverages. Subjects were required to mark an X on this scale based on their level of hunger and satiety. The subjects can mark anywhere along the line and not necessarily on the intervals with assigned phrases. The scale was marked every 15 minutes after the beverage sample was served for the first 60 minutes and every half hour until 180 minutes. Subjects were not allowed to refer to the previously rated perception on the scale so that the next rating is not influenced by the previous rating.
Wash out period is one week and the subjects are required to come for testing session once a week on the same day. In addition, the subjects must rest throughout the duration of the study which is 180 minutes and is only allowed to leave the test location after the last blood sample reading is taken. Data was collected by measuring the distance between the X mark to the “Neither hungry nor full” which was zero (Figure 1). Marks on the fullness scale were treated as positive values while marks on the hunger part of the scale were assigned as negative values. The data obtained were collected and the area under the curve (AUC) of each individual for each sample was calculated to determine the beverage with higher satiety or vice versa.
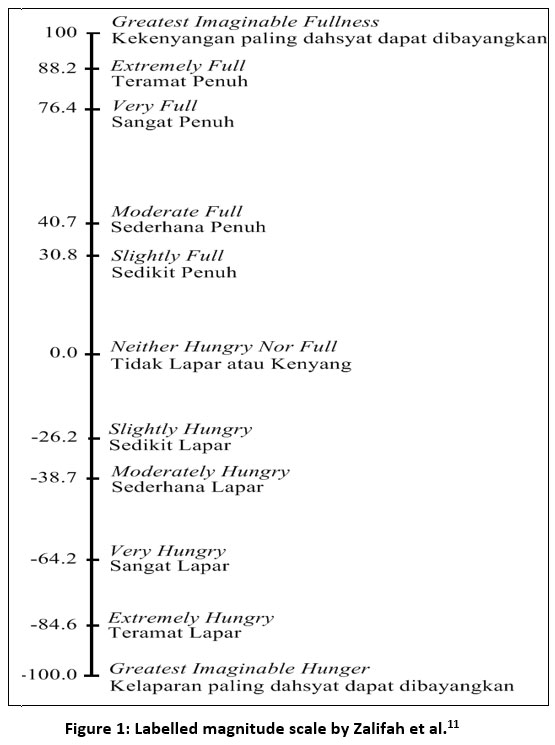 |
Figure 1: Labelled magnitude scale by Zalifah et al.11 |
Statistical analysis
All data obtained from physicochemical analysis, sensory evaluation, glycemic index and satiety scores were reported as mean + standard deviation (SD) and analysed using IBM SPSS Statistics version 21.0 software. Physicochemical analysis was done in triplicate. Other data were average of participating subjects’ evaluations. The statistical test used is an independent t-test for physicochemical analysis as well as sensory evaluation and Analysis of Variance (ANOVA), followed by Duncan Multiple Range Test This statistical analysis was used to determine if there was a significant difference in the two samples of beverage products containing β-glucan and the reference sample for satiety scores, determination of glycemic index values and daily food intake. The value of significant difference is based on the 95% confidence level (p<0.05). The mean and standard deviation of each data were determined.
Results and Discussion
Physical Analysis
The actual colour of both beverages are vanilla colour with very light tinge of tan colour. Colour analysis of the samples shows that there is a significant difference (p<0.05) between the samples. The L* parameter indicate the degree of lightness which range from 0 – 100, whereby 0 is the darkest and 100 is the lightest. The result shows that BG25 is darker compared to BG22 (Table 2). On the other hand, a* positive represent redness, while a* negative represents greenness. The BG25 sample appeared to be slightly greenish which the BG22 were reddish. The parameter b* represents yellowness if positive, and blueness if negative. The result shows that both samples are yellowish in colour because both and b* values are positive, with BG25 to be more yellow in colour compared to BG22.
Table 2: Data of colour analysis on the beverages containing β-Glucan.
| Samples | L* | a* | b* |
| BG25 | 52.64 ± 0.32b | -0.26 ± 0.05b | 6.92 ± 0.05a |
| BG22 | 54.01 ± 0.31a | 0.65 ± 0.17a | 6.15 ± 0.05b |
The data was shown as mean ± standard deviation. The different a-b symbol shows that there is a significant difference (p<0.05) between the samples for the items measured.
The viscosity of the samples was obtained by plotting the graphs of shear force against shear rate. The result on viscosity shows that BG25 (Figure 2a) is more viscous than BG22 (Figure 2b). β-glucan of oat has higher ratio of β-glycosidic (1,4) linkage compared to β-glycosidic (1,3) linkage, which will produce a larger molecule interaction and a more stable bonding between the β-glucan chain12. This will then cause a higher resistant and viscosity on the liquid produced. The BG25 is not as viscous compared to BG22 which form very thick porridge like consistency. This thus explained the higher shear force values in Figure 3(b).
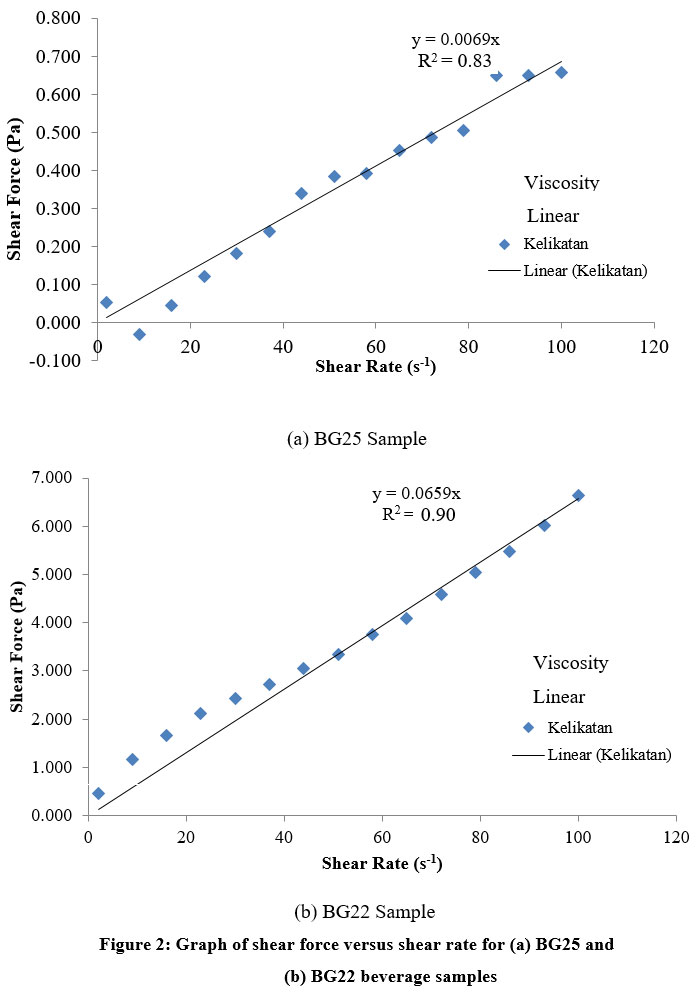 |
Figure 2: Graph of shear force versus shear rate for (a) BG25 and (b) BG22 beverage samples |
The total soluble solid of BG25 is higher than BG22 (Table 3). A higher brix value indicates a higher amount of total soluble solid, thus a higher content of simple sugars content in the product. Therefore, in both products, there is very low or no added sugar composition. Although these products contain carbohydrate, they could possibly be in the form of complex carbohydrate which was not captured in this text. However, the brix values of both products are low, indicating the samples do not contain added sugar and are both natural products. We did not perform sugar analysis on these samples as the values for total soluble solid is already very low.
Table 3: Data of total soluble solid on the beverages containing β-glucan
| Samples | °Brix |
| BG25 | 1.5 |
| BG22 | 0 |
Sensory Evaluation
The results of sensory testing are shown in Table 4. The t test conducted on the sensory test data shown that there were no significant differences (p>0.05) on the colour and taste attribute of the samples, while there are significant differences (p<0.05) on the viscosity, smell and overall acceptance of the samples. The score obtained for all the attribute are relatively low, this might be due to the products which were made from natural ingredients of oat and barley without added flavouring agent, are both plain very plain in term of taste. The colour of the samples make no significant difference to human sensory, although the colour analysis conducted shows a significant difference. The viscosity of BG25 is relatively lower than BG22, however is not preferred by the subjects. This does not comply with the statement of 13 which states that increase in viscosity, could increase the satiety score, but reduce the palatability of the food. Overall, BG22 is more accepted compared to BG25. This could be seen from the overall higher score of the other attribute tested. The attributes’ properties of a product are important because it will affect the overall acceptance of consumers toward the product 14.
Table 4: Data of hedonic test on the beverages containing β-Glucan
| Samples | Colour | Aroma | Viscosity | Taste | Overall Acceptance |
| BG25 | 4.0a(±1.5) | 3.5b(+1.4) | 3.4b(+1.3) | 3.2a(+1.4) | 3.1b(+1.5) |
| BG22 | 4.4a(+1.5) | 5.1a(+0.9) | 4.2a(+1.5) | 3.8a(+1.4) | 4.0a(+1.3) |
The data were shown as mean (standard deviation). The different a-b symbol shows that there is a significant difference (p<0.05) between the samples for the attributes measured.
Glycemic Index
Figure 3 shows that the concentration of blood glucose increased after consumption of samples served, but dropped after that. The blood glucose level normally increased 10 minutes after food consumption. This is caused by the digestion and absorption of carbohydrate in the body 15. The mean blood glucose level from 15 minutes to 60 minutes shows significant difference (p<0.05) between the samples tested. Blood glucose concentration profile is different for each sample. This is due to the rate of carbohydrate absorption, insulin secretion and glucagon, effect of glucose metabolism in the liver and peripheral tissue would give impact on the blood glucose level after meal 16. The rise in blood glucose level after having glucose drink is much drastic, which is 9.9 mmol/L at 30 minutes. The reason is because glucose is carbohydrate in the form of monosaccharide, which is very easy to be absorbed and turn to energy in the body 17. The β-glucan on the other hand is an active component which is responsible in reduction of blood glucose and it reduce the activity of insulin after having food with soluble dietary fibre.
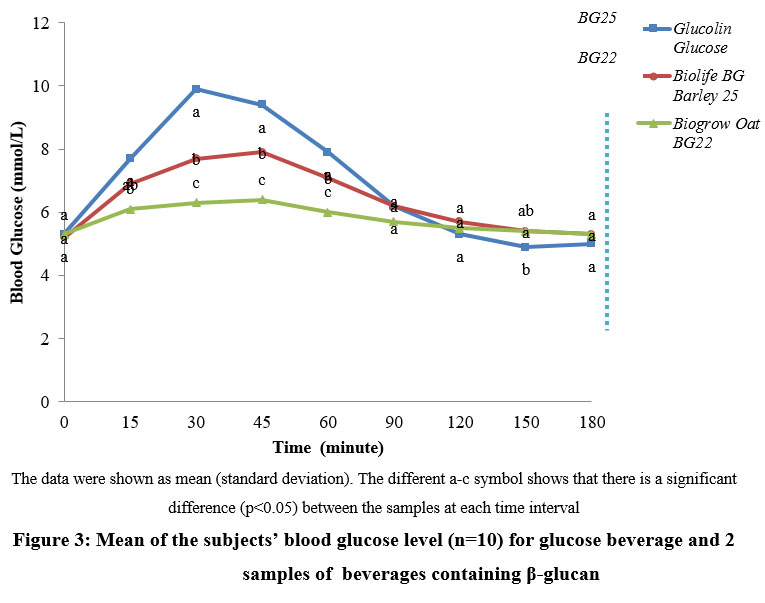 |
Figure 3: Mean of the subjects’ blood glucose level (n=10) for glucose beverage and 2 samples of beverages containing β-glucan |
On the other hand, the blood glucose level of subjects’ peaks at 45 minutes after having the beverages containing β-glucan. However, BG25 gives a higher peak at 7.9 mmol/L compared to BG22, which give its maximum blood glucose level at 6.4 mmol/L. The increase in viscosity in food will slow down glucose absorption 18,19. The BG22 has a higher viscosity compared to BG25. According to16, the blood glucose concentration will normally rise after meal up to 60 minutes, and will return to the state before having meal in 2-3 hours after meal. The result obtained shows that the mean glucose level value shows significant difference (p<0.05) when compared to samples until 60 minutes. However, the reference sample GlucolinTM glucose showed a blood glucose level significantly not different (p>0.05) at 90-120 minutes after having the drink. The mean glucose level dropped to a level lower than the state before meal, this might be due to the change in body metabolism after consumption of glucose drink containing only simple sugar. To determine GI value, iAUC has to be determined between 0-120 minutes. The result depicts that there is a significant difference between the samples in term of iAUC (Table 5).
Table 5: Area under the Curve (iAUC) of glucose beverage and 2 samples of beverages containing β-glucan
| Samples | iAUC (mean ± standard deviation) |
| GlucolinTM Glucose | 255.8 ± 40.2a |
| BG25 | 198.7 ± 25.0b |
| BG22 | 81.2 ± 17.6c |
The data were shown as mean + standard deviation. The different a-b symbol shows that there is a significant difference (p<0.05) between the samples for the calculated iAUC
The GI values of the samples were calculated from iAUC data using earlier mentioned formula (Table 6). Studies by 20 has shown that the rise in blood glucose after having product made from oat and barley is relatively lower compared to the rise in blood glucose after having glucose drink, due to the high β-glucan and amylose content. Therefore, the blood glucose levels after having β-glucan beverages are lower than glucose drink in this study.
Table 6 indicates BG 25 has a GI value of 73, which was classified as high GI food as classified by 8. However, BG22 was classified as low GI food according to both sources, with its GI value as 32. Oat and barley β-glucan are large polysaccharide which give high viscosity even at low concentration 21. By taking viscous polysaccharide could increase the viscosity of bolus formed in the stomach 22. Therefore, food digestion by enzyme could reduce in rate and slow down stomach emptying. Thus, this could reduce the rate of glucose absorption. Moreover, that viscosity of β-glucan beverages from oat is higher than of barley, due to the higher 3-O-β-cellotriosyl-D-glucose content in oat β-glucan12.
Table 6: Glycemic Index (GI) and classification of glucose beverage and 2 samples of beverages containing β-Glucan
| Samples | GI values (mean + SD) | Classification of GI19 |
| BG25 | 73 ± 11 | High |
| BG22 | 32 ± 6 | Low |
The data were shown as mean + standard deviation
Our findings showed that although the brand itself claims that there was not added sugar or low sugar product, it is very concerning to find the BG25 falls into the high GI category. Products such as these beverages should voluntarily do GI test before stating low sugar or no added sugar to the product itself. On the other hand, BG22 was found to be in low GI category which would be a product diabetics can consume regularly without any fear of blood sugar rise.
Perceived Satiety
The average satiety scores were averaged from scores of 30 subjects. Figure 4 showed no significant difference (p>0.05) between the samples at 0 minutes. This issue to the subjects complying with the study protocol, which is fasting for 10 to 12 hours the night before the study for each study session. The mean range of satiety score at 0 minutes is between -34.4 to -30.9, which showed that subjects feel “slightly hungry” to “moderately hungry” on the scale11 by after fasting.
The magnitude label scale was marked again by each subject at time intervals of 15, 30, 45, 60, 90, 120, 150 and 180 minutes respectively after the drink sample is served. Next, the satiety scores for each time interval were averaged. The results obtained showed that the average satiety scores for each time interval were significantly different (p<0.05) between the samples after taking for intervals of 15 to 180 minutes. The three study samples showed an increase after sampling and reached the optimum score at 15 minutes, then decreased with time (Figure 4). The BG22 sample achieved the highest optimal satiety score at 15 minutes, followed by BG25 and the glucose drink being the reference which was the least satiating. Based on Figure 4, the time for subjects to reach the level of neither hungry nor full (y=0) is different between both beverages. The glucose reference reached zero value the fastest at 46.2 minutes, followed by the BG25 and BG22 samples at 122.6 minutes and 156.6 minutes respectively. This shows that the BG22 sample provides a longer feeling of satiety compared to the BG25.
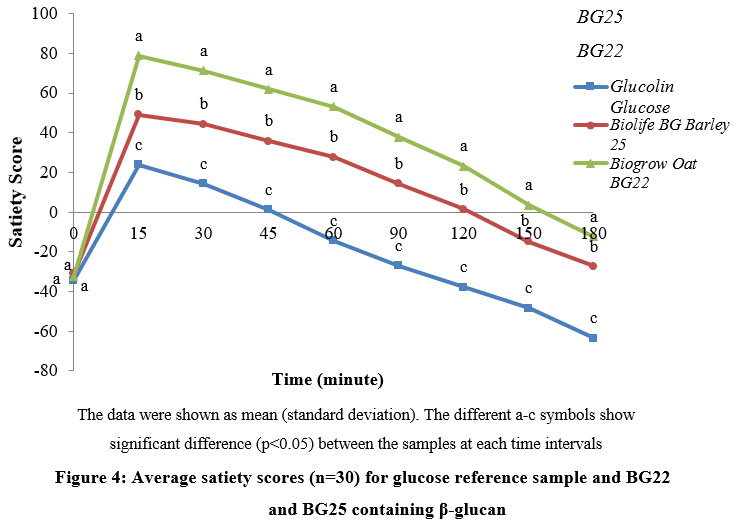 |
Figure 4: Average satiety scores (n=30) for glucose reference sample and BG22 and BG25 containing β-glucan. |
The most sated sample is determined by using the area under the curve (AUC) values. The results of the calculation showed that the AUC value for beverage is significantly different (p<0.05). Referring to Table 7, the BG22 sample is the most satiating sample compared to other samples. This is because the larger the AUC value, the longer the feeling of satiety can be maintained. On the other hand, the lowest AUC value for the glucose drink means that this sample only provides a feeling of satiety for a short period of time and causes hunger after three hours of the study.
Table 7: Area under curve (AUC) values for reference and beverages β-glucan
| Samples | AUC (mean ± std dev) |
| GlucolinTM Glucose | 720.8 ± 779.5c |
| BG25 | 3058.4 ± 1277.7b |
| BG22 | 6427.3 ± 2072.6a |
The data were shown as mean + standard deviation, the different a-c symbol shows that there is a significant difference (p<0.05) between the samples
Drinks containing β-glucan have a higher AUC value compared to glucose drinks due to the presence of β-glucan in the sample. In our study we also observed beverages β-glucan from different plant origin also showed different satiating capacity. Water-soluble fibers such as guar gum, pectin, psyllium and β-glucan have properties that produce viscosity and can reduce hunger and appetite compared to foods that are low or do not contain water-soluble fiber 21,22. This is because meals with high viscosity will delay gastric emptying 23,24,25 and delay digestion and absorption of nutrients due to the blocking of enzyme activities and mucosal absorption 26. With this, the feeling of satiety can be maintained for a longer period.
The AUC value of the BG22 sample is significantly higher (p<0.05) compared to the AUC value of BG25. This may be due to the quantity of samples prepared being different between the samples of drinks containing β-glucan. The sample weight required for BG22 to reach 25 g of available carbohydrates is 82.0 g which is higher than BG 25 (67.6 g). Additionally protein is the most satiating macronutrient followed by carbohydrates and fat 27. Therefore, the BG22 beverage which contains a higher protein which is 15.2 g compared to BG25 (9.6 g) causing Oat BG22 to be more filling and with higher AUC value. Based on our findings the physicochemical aspect of these two products does not significantly effect the sensorial perception. However, BG22 with lower GI is found to be more satiating then BG25.
Conclusion
Products BG25 and BG22 are yellowish in colour because they show a* positive b* value each at 6.92 and 6.15. The BG22 has a higher viscosity and contain no sugar compared to BG25. Both BG25 and BG22 were made with natural ingredients without added food additives was given a lower mean score for attribute colour, aroma, viscosity and overall acceptance in sensory test conducted. To improve the flavor of the product, it is advisable that the products were taken together with fruit juice, soy milk or cocoa with cold or warm water. The GI value of BG25 is 73 and was classified as high GI food according to 8 while BG22 was classified as low GI product with its GI recorded as 32.
Acknowledgement
We are grateful to Universiti Kebangsaan Malaysia (UKM) for the financial support (ST-2022-021 & ST-2022-061) and grant FRGS/1/2013/STWN04/UKM/02/1. We also like to express gratitude to the Department of Food Sciences, Faculty of Science and Technology, UKM Bangi for allowing this study to be carried out at the Pilot Plant.
Data Availability Statement
No data were used elsewhere to support this study and it was an entirely new set of data.
References
- Food Safety, Healthy Eating and Nutrition Information. International Food Information Council. http://ific.org/nutrition/functional/index.cfm. 2006. Accessed 4 Mei 2019.
- Hasler, C.M., Bloch, A.S., Thomson, C.A., Enrione, E. & Manning, C. Position of the American Dietetic Association: Functional Foods. Am. Diet Assoc. 2004; 104(5): 814-826.
CrossRef - Al Saqqa, G.S.R. Some functional foods and benefits of their bioactive components. Saudi Soc. Food Nutr. 2021; 14(1): 1-11.
CrossRef - Department of Statistics Malaysia. Death Statistics in Malaysia. Kuala Lumpur: Department of Statistics Malaysia Press 2021.
- Sharon, P.R.D. The Buzz on Beta Glucans. Virgo Publishing. http://www.foodproductdesign.com/articles/2006/05/the-buzz-on-betaglucans.aspx. 2006. Accessed 6 May 2021.
- Rahar, S., Swami, G., Nagpal, N., Nagpal, M.A. & Singh, G.S. Preparation, Characterization, and Biological Properties of β-glucan. Adv. Pharma. Tech. Res. 2011; 2(2): 94-103.
CrossRef - Giacomessi, R. Glucagel-key Health Benefits. DKSH Global. http://www.dksh.com/htm/1304/en/Satiety-and-weight-control.htm. 2012. Accessed 8 May 2021.
- Food Products-Determination of the Glycaemic Index (GI) and Recommendation for Food Classification (26642). Geneva: International Organization for Standardization. 2010.
- World Health Organsation (WHO). Appropriate body-mass index for Asian populations and its implications for policy and intervention strategies. Lancet. 2004; 363(9403): 157–163.
CrossRef - Stunkard, A.J. & Messick, S. The Three-Factor Eating Questionnaire to Measure Dietary Restraint, Disinhibition and Hunger. Psychosomatic Res. 1985; 29(1): 71-83.
CrossRef - Zalifah, M.K., Greenway, D.R., Caffin, N.A., D’arcy, B.R. & Gidley, M.J. Application of Labelled Magnitude Satiety Scale in a Linguistically-diverse Population. Food Qual. Prefer. 2008; 19: 574-578.
CrossRef - Ryu, J.H., Lee, S., You, S., Shim, J.H., & Yoo, S.H. Effects of Barley and Oat β-glucan Structures on their Rheological and Thermal Characteristics. Polym. 2012; 89(4): 1238-1243.
CrossRef - Mattes R.D. & Rothackerb D. Beverage Viscosity is Inversely Related to Postprandial Hunger in Humans. Behavior 2001; 74: 551–557.
CrossRef - Popper, R., Rosenstock, W., Schraidt, M., & Kroll, B. J. The Effect of Attribute Questions on Overall Liking Ratings. Food Qual. Prefer. 2004; 15(7): 853-858.
CrossRef - Jenkins, D.J., Wolever, T.M., Taylor, R.H., Barker, H., Fielden, H., Baldwin, J.M., Bowling, A.C., Newman, H.C., Jenkins, A.L. & Goff, D.V. Glycemic Index of Foods: A Physiological Basis for Carbohydrate Exchange. J. Clin. Nutr. 1981; 34(3): 362-366.
CrossRef - Barry, G.H. A Textbook for Science for the Health Professions. United Kingdom: Nelson Thornes Ltd. 2001.
- Braaten, J.T., Wood, P.J., Scott, F.W., Riedel, K.D., Poste, L.M. & Collins, M.W. Oat Gum Lowers Glucose and Insulin after an Oral Glucose Load. J. Clin. Nutr. 1991; 53(6): 1425–1430.
CrossRef - Brand-Miller, J.C., Stockmann, K., Atkinson, F., Petocz, P. & Denyer, G. Glycemic Index, Postprandial Glycemia, and the Shape of the Curve in Healthy Subjects: Analysis of a Database of More than 1000 Foods. J. Clin. Nutr. 2009; 89(1): 97–105.
CrossRef - Panahi, S., Ezatagha, A., Temelli, F., Vasanthan, T. & Vuksan, V. β-glucan from Two Sources of Oat Concentrates Affect Postprandial Glycemia in Relation to the Level of Viscosity. Am. Coll. Nutr. 2007; 26(6): 639–644.
CrossRef - Alminger, M., & Eklund-Jonsson, C. Whole-grain Cereal Products Based on a High-fibre Barley or Oat Genotype Lower Post-prandial Glucose and Insulin Responses in Healthy Humans. J. Nutr. 2008; 47(6): 294-300.
CrossRef - Ren, Y., Ellis, P.R., Ross-Murphy, S.B., Wang, Q. & Wood, P.J. Dilute and Semi-dilute Solution Properties of (1–3)(1–4)-β-D-glucan, the Endosperm Cell Wall Polysaccharide of Oats (Avena sativa). Carbohydr. Polym. 2003; 53(4): 401–408.
CrossRef - Marciani, L., Gowland, P.A., Spiller, R.C., Manoj, P., Moore, R.J., Young, P. & Fillery-Travis, A.J. Effect of Meal Viscosity and Nutrients on Satiety, Intragastric Dilution, and Emptying Assessed by MRI. J. Physio. Gastro Liver Physio. 2001; 280(6): G1227-G1233.
CrossRef - Dikeman, C.L. & Fahey, G.C. Viscosity as Related to Dietary Fiber: A Review. Rev. Food Sci. Nutr. 2006; 46(8): 649–663.
CrossRef - Darwiche, G., Björgell, O. & Almér, L.O. The Addition of Locust Bean Gum but Not Water Delayed the Gastric Emptying Rate of a Nutrient Semisolid Meal in Healthy Subjects. BMC Gasterol. 2003; 3(1): 12.
CrossRef - Rigaud, D., Paycha, F., Meulemans, A., Merrouche, M. & Mignon, M. Effect of Psyllium on Gastric Emptying, Hunger Feeling and Food Intake in Normal Volunteers: A Double Blind Study. J. Clin. Nutr. 1998; 52(4): 239–224.
CrossRef - Isaksson, G., Lundquist, I. & Ihse, I. Effect of Dietary Fiber on Pancreatic Enyzme in vitro. 1982; 82(5): 918–924.
CrossRef - Brennan, I.M., Feltrin, K.L., Nair, N.S., Hausken, T., Little, T.J., Gentilcore, D., Wishart, J.M., Jones, K.L., Horowitz, M. & Feinle-Bisset, C. Effects of the Phases of the Menstrual Cycle on Gastric Emptying, Glycemia, Plasma GLP-1 and Insulin, and Energy Intake in Health Lean Women. J. Physio. Gastro Liver Physio. 2009; 297(3): 602-610.
CrossRef
Accepted on: 30 Nov 2022
Second Review by: Suwanna Pichaiyongvongdee Thialand , Amany A. Salama Egypt
Final Approval by: Dr. Dariusz Dziki


Web of Science Coverage
Emerging Sources Citation Index (ESCI)
2024 Journal Impact Factor: 1.1
Scopus Journal Metrics
CiteScore 2025: 2.6
CiteScore Details
Sustainable Nutrition: Food Systems, Nutrient Retention, and Public Health Impact
![]()
This journal is a member of, and subscribes to the principles of, the Committee on Publication Ethics (COPE)


