The Developed Ready to Eat Meal affected to Blood Glucose and Insulin in Healthy Subjects: Glycemic Index Study
Nattira On-Nom
Rin Charoensiri, Ratchanee Kongkachuichai and Chaowanee Chupeerach* Institute of Nutrition, Mahidol University, Phutthamonthon 4 Rd., Salaya, Phutthamonthon, Nakhon Pathom, Thailand.
Corresponding Author Email: chaowanee.chu@mahidol.ac.th
DOI : http://dx.doi.org/10.12944/CRNFSJ.10.1.18
Download this article as:
![]()
The glycemic index (GI) rates carbohydrate-containing foods by how much they boost blood sugar. High GI foods increase the risk of non-communicable diseases, especially diabetes. The aim of the study was to develop the low and medium GI in ready to eat meal with consumer acceptance. The crossover design was use in this study and fourteen healthy participants consumed 25 g available carbohydrate. Blood samples were taken within 0-120 min after starting to eat the test meal. Glucose and insulin were measured by automated chemistry analyzer. Area under the curve of glucose was use for glycemic index calculation. For the five test meals, GI mean values and standard error of mean were as follows. Chicken basil fried rice (46.9±13.8), fried whole wheat pasta with chicken (53.1±8.7), and steamed minced chicken rice with seasoned shiitake mushrooms (37.6±6.3) in the low GI group, with pork fried rice (57.2±8.7) and minced chicken rice with sauce (57.6±6.8) meals in the medium GI group. Test meals contained high amount of dietary fiber which could affect to GI value and blood insulin. Soluble fiber as beta-glucans source in the developed to eat meal such as shitake mushroom and other vegetables might help to delay gastric emptying. Therefore glucose in the diet was absorbed more gradually, with decreased blood glucose levels and increased insulin response. Knowledge of GI values in these developed ready to eat meals can be used to guide food choices for individuals suffering from diabetes and obesity.
KEYWORDS:Diabetes; Dietary Fiber; Healthy Food; Obesity; Test Meal
Introduction
Changes in economic and social aspects, as well as advances in technology, medicine and public health, have led to lower birth and mortality rates with a longer average life span. As a result, Thailand has quickly become an aging society. The process of aging involves bodily changes as cell functions deteriorate. Aging populations are at greater risk of developing health problems, especially diabetes mellitus (DM). Globally, the prevalence of diabetes has increased by 125.4% from 211.2 million people in 1990 to 476.0 million in 2017. 1 The management goal of type 2 diabetes is to optimize glycemic control of the patients to prevent medical complications from hyperglycemia.2 Food is an important health factor, and eating healthy and nutritious meals improves the quality of life. Using medication alone may not be sufficient to restore normal bodily functions, with the possible induction of other diseases from drug side effects. The glycemic index (GI) value is a suitable tool for blood glucose management of diabetes patients. Consumption of low-medium GI foods improved blood glucose levels in people with diabetes.3-6 The GI value is defined as the incremental area under the blood glucose response curve of a 25 to 100 g carbohydrate portion of a test food expressed as a percent of the response to the same amount of carbohydrate from a standard food taken by the same subject.7-9 A high GI diet causes faster sugar digestion and absorption in the gastrointestinal tract. This mechanism increases the beta-cell workload with over secretion of the insulin hormone, whereas a lower GI diet improves insulin sensitivity.10-11 Low-medium GI foods promote weight loss, improve blood glucose and blood pressure, and control triglyceride levels.12-13 The aim of this study was to develop ready-to-eat meals and determine their GI values as therapeutic diets/disease-specific diets for people with diabetes and/or obesity. The five ready-to-eat meals included chicken basil fried rice, pork fried rice, fried whole wheat pasta with chicken, steamed minced chicken rice with seasoned shiitake mushrooms and minced chicken rice with sauce.
Materials and Methods
Raw Materials
Ingredients used for producing the control and developed ready to eat meals consisted of chicken breast, egg and pork tenderloin (Betagro Public Co., Ltd., Thailand), white rice and brown rice (Sandee Rice Co., Ltd., Thailand), pasta and whole wheat pasta (La Molisana) and white and brown sugar (Mitr Phol Group, Thailand), oyster sauce (Tramaekrua Co., Ltd., Thailand), soy sauce (Yanwalyun Co., Ltd., Thailand), sesame oil (Union Food Industry Co., Ltd., Thailand), canola oil (Lam Soon Public Co., Ltd., Thailand), tomato sauce (Hi-Q Food Products Co., Ltd., Thailand), salt (Prung Thip Co., Ltd., Thailand), white pepper powder and red bean (Raitip Co., Ltd., Thailand) and frozen pea, carrot and sweet corn (Makro Public Co., Ltd., Thailand). Straw mushrooms, oyster mushrooms, spring onion, celery, chili, carrot, sweet pea, baby corn, garlic, red basil and onion were purchased from Salaya Market, Nakhon Pathom, Thailand.
Development of Healthy Ready to Eat Meals
The five ready-to-eat meals (Table 2) were developed based on the control meal formula using INMUCAL-Nutrients V.4.0. This is a computer program consisting of a food composition database and used to calculate and formulate diets. The aim was to produce healthy ready-to-eat meals that contained 350-400 kcal of energy, not less than 1.5 g of fiber per 100 kcal and not more than 100 mg of cholesterol per serving. The healthy ready-to-eat meals were also designed to contain carbohydrates 45-50%, protein 15-25% and fat 30-35% of total energy intake according to healthy diets recommended by the WHO.14 Both the control and developed ready-to-eat meals were determined for proximate analysis, GI value and sensory evaluation.
Table 2: Composition of Five Developed Ready to Eat Meals.
| Food | Major Ingredients/Processing |
| Chicken basil fried rice | Brown rice, chicken, basil, garlic/fried |
| Pork fried rice | Brown rice, pork, egg, pea, carrot, corn /fried |
| Fried whole wheat pasta with chicken | Whole wheat pasta, chicken, pea carrot, corn, onion /fried |
| Steamed minced chicken rice with seasoned shiitake mushrooms | Brown rice, chicken, pea, carrot, long bean, shitake mushroom/steam chicken and vegetables |
| Minced chicken rice with sauce. | Brown rice, chicken, straw mushroom/grilled chicken and stir fried vegetables |
Sensory Acceptability Test
Sensory evaluation was conducted using 40 untrained panelists comprising faculty members, staff and graduate students of the Institute of Nutrition, Mahidol University (INMU), Thailand. Criteria for recruitment included ³ 20 years of age, regular ready to eat meal consumers and no history of allergy to ingredients used such as wheat flour, red bean, corn and pea. The panelists were educated on testing terminologies and requested to evaluate the various ready-to-eat meals as both the control and developed formulae, for appearance, color, odor, taste, texture and overall liking using a 9-point hedonic scale.15 Sensory evaluation tests were performed in individual testing booths under daylight-fluorescent lights of the sensory science laboratory at INMU. The samples were packed in plastic boxes and coded using random three-digit numbers. Samples were served (30 g) at 60-65°C in a random sequence. Panelists were instructed to rinse their palates with distilled water between samples. The experiment was designed as a completely randomized block (CRB). Samples with overall liking scores equal to or more than 7 were selected as developed formulae.
Proximate Analysis
Moisture content, ash, protein, fat, carbohydrate, total dietary fiber, and cholesterol were determined using the standard method of AOAC 2016 [16]. The energy/caloric value of each developed ready-to-eat meal was calculated by multiplying the protein content by 4, fat content by 9, and carbohydrate content by 4.
Determination of GI
Fourteen healthy subjects (7 males and 7 females) aged between 18 and 35 were recruited for this study. Inclusion criteria included body mass index (BMI) < 25 kg/m2, blood glucose < 5.6 mmol/L and HbA1c <5.7%. All participants gave their informed consent before participation. All protocols were approved by the Human Ethics Committee, Mahidol University Central Institutional Review Board (MU-IRB; COA. NO. 2019/202.191). Baseline characteristics of the fourteen subjects are shown in Table 4. The day before the study began, all subjects consumed a standard meal of similar serving size with water for dinner. They were prohibited from undertaking vigorous exercise, drinking caffeine, alcohol and smoking. All the subjects were asked to undergo an overnight fast for 8-12 hours.
Table 4: Anthropometric and Biochemical Characteristics of Fourteen Subjects.
| Parameters | Mean ±S.D |
| Age (years) | 26±3 |
| Systolic blood pressure (mmHg) | 115±8 |
| Diastolic blood pressure (mmHg) | 76±7 |
| Body mass index (BMI; kg/m2) | 22.37±2.86 |
| Waist circumference (cm) | 77.70±10.65 |
| Blood Chemistry | |
| HB1AC (%) | 5.2±0.3 |
| Blood glucose (mmol/L) | 4.71±0.30 |
| Triglycerides (mg/dL) | 73.71±30.20 |
| Total Cholesterol (mg/dL) | 199.07±23.11 |
| Cholesterol-high density lipoprotein (HDL) (mg/dL) | 70.00±19.06 |
| Cholesterol-low density lipoprotein (LDL) (mg/dL) | 113.86±18.30 |
| Kidney function | |
| Blood urea nitrogen (BUN) (mg/dL) | 11.38±1.80 |
| Creatinine (mg/dL) | 0.89±0.21 |
| Liver functions | |
| Aspartate aminotransferase (AST) (Unit/L) | 21.31±6.56 |
| Alanine transaminase (ALT) (Unit/L) | 14.77±3.81 |
| Alkaline Phosphatase (ALP) (Unit/L) | 57.85±23.78 |
Test Meals
The five test meals were served as 25 g portions containing available carbohydrates and compared with the reference food (25 g of glucose powder dissolved in 250 mL water). The test meals were consumed in random order during the reference food sessions, with at least 5 days of wash-out period.8-9,17
Blood Chemistry Determinations
Fasting blood glucose was taken after 8-12 h of overnight fasting and measured at 0 min before consumption of the reference food or test meal as a baseline. Subjects consumed the reference food or test meal within 15 min. Then, 5 mL of venous blood was taken from the scalp vein, and again at 15, 30, 45, 60, 90 and 120 min. All blood chemistry analyses were conducted using an automated analyzer at Bangkok Medical Lab Co., Ltd., Thailand. The GI value was described as the incremental area under the blood glucose response curve (IAUC) of a 25 g available carbohydrate portion of the test meal expressed as a percent of the response to the same amount of carbohydrate from the reference food taken by the same subject. The incremental area under the plasma glucose curve (IAUC) for each food was calculated for GI value. The GI value for each test meal was calculated as the ratio of the 2-h IAUC of the test meal divided by the IAUC of the reference food at 2-h and multiplied by 100.
Statistical Analysis
Statistical analysis was performed using SPSS 18 (Chicago, USA). Data were presented as means, standard deviations and standard errors of the mean. After testing data normality, ANOVA with the Bonferroni post hoc test was used to assess differences in blood glucose and insulin among the test meals. Statistical significance was set at p-value <0.05.
Results
Developed Ready to Eat Meals
Sensory Acceptability Test
Sensory attribute scores of the control and developed ready-to-eat meals are shown in Table 1. Results indicated that all sensory attribute scores as appearance, color, odor, taste, texture and overall liking of the developed ready-to-eat meals were lower than the control formula. Some ingredients and seasoning quantities were changed to obtain nutrient compositions following the WHO recommendations for a healthy diet.14 However, no significant differences were recorded between the control and developed ready-to-eat meals for all sensory attributes. Sensory attribute scores of the developed ready-to-eat meals were all higher than 7 (like moderately). Therefore, these five developed ready-to-eat meals were accepted by consumers used an average value of 6 (like slightly) in a 9-point hedonic scale as the acceptability limit for consumers liking the product.18-20
 |
Table 1: Sensory Evaluation of the Control and Developed Ready to Eat Meals.1 |
Composition of Developed Ready to Eat Meals
Major ingredients and processing of the five developed ready-to-eat meals are shown in Table 2 as rice, meat (chicken and pork), vegetables with different seasoning and processing methods, with proximate analyses shown in Table 3. Energy distribution in the meals ranged for carbohydrate: protein: fat ratio at about 55: 20: 25.
Table 3: The Proximate Analysis of the Developed Ready to Eat Foods.
| Nutrition Value (per 100 g) | M-1 | M-2 | M-3 | M-4 | M-5 |
| Energy (kcal) | 179 | 151 | 129 | 130 | 125 |
| Fat (g) | 5.21 | 4.46 | 3.59 | 3.84 | 3.43 |
| Saturated fat (g) | 1.42 | 0.81 | 0.45 | 0.63 | 0.99 |
| Cholesterol | 10.41 | 27.58 | 7.33 | 10.78 | 7.76 |
| Protein (g) | 8.76 | 7.8 | 6.33 | 6.46 | 6.35 |
| Carbohydrate (g) | 24.29 | 19.97 | 17.9 | 17.49 | 17.18 |
| Fiber (g) | 5 | 4.39 | 4.77 | 1.91 | 2.97 |
| Sugar (g) | 2.71 | 2.4 | 3.52 | 2.38 | 3.62 |
| Sodium (mg) | 259 | 217 | 147.15 | 170.64 | 212.67 |
| Vitamin A (µg) | 8 | 9 | 1.79 | 1.8 | ND |
| Vitamin B1 (mg) | 0.08 | 0.2 | 0.07 | 0.04 | 0.04 |
| Vitamin B2 (mg) | 0.04 | 0.04 | 0.03 | 0.05 | 0.04 |
| Calcium (mg) | 32 | 25 | 27.39 | 15.73 | 20.14 |
| Ferric (mg) | 1.96 | 0.93 | 0.97 | 0.53 | 0.66 |
| Ash (g) | 1.41 | 1.08 | 1.21 | 0.9 | 1.08 |
| Moisture (g) | 60.34 | 66.7 | 70.97 | 71.31 | 71.96 |
M-1; chicken basil fried rice, M-2; pork fried rice, M-3; fried whole wheat pasta with chicken, M-4; steamed minced chicken rice with seasoned shiitake mushrooms, M-5; minced chicken rice with sauce.
Glycemic Index Values of Developed Ready to Eat Meals
Anthropometric and biochemical characteristics of the subjects are shown in Table 4, with mean glucose and insulin responses displayed in Fig.1. The highest peak of glucose response at minute 30 for the reference food (glucose solution) was significantly higher than all test meals (p value<0.05). No significant difference was observed for insulin response; however, the trend of the peak for test meals was similar to glucose. Two hours after meal consumption, the incremental area under the curve (IAUC) of blood glucose and insulin were determined, as shown in Fig.2. The IAUC values of all developed ready-to-eat meals were significantly lower than the reference food (p value<0.05) but no differences were observed among developed ready-to-eat meals.
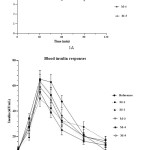 |
Figure 1: Mean and Standard Error of Mean for Glycemic (1A) and Insulin (1B) Response after Meal Consumption. |
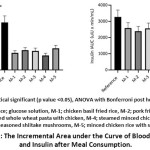 |
Figure 2: The Incremental Area under the Curve of Blood Glucose and Insulin after Meal Consumption. |
The percentage of blood glucose IAUC was compared between test meals and the reference food, with glycemic index values shown in Table 5. No significant difference in GI values was recorded among the developed ready-to-eat meals; however, the meals were classified into different GI groups. Chicken basil fried rice (M-1), fried whole wheat pasta with chicken (M-3), and steamed minced chicken rice with seasoned shiitake mushrooms (M-4) were in the low GI group, whereas pork fried rice (M-2) and minced chicken rice with sauce (M-5) were in the medium GI group. The test meal M-4 showed the lowest GI, blood glucose and insulin response (Table 2 and Fig.2).
Table 5: Glycemic Index (GI) Values of Five Developed Ready to Eat Meals.
| Food | Available Carbohydrate g/100 g |
Experimental portion (g) |
GI | GI classification | Serving size (g) |
|
| Mean | SEM | |||||
| Chicken basil fried rice | 19.29 | 129.6 | 46.9 | 13.8 | Low | 225 |
| Pork fried rice | 15.58 | 160.5 | 57.2 | 8.7 | Medium | 250 |
| Fried whole wheat pasta with chicken | 13.13 | 190.4 | 53.1 | 8.7 | Low | 250 |
| Steamed minced chicken rice with seasoned shiitake mushrooms | 15.58 | 160.4 | 37.6 | 6.3 | Low | 285 |
| Minced chicken rice with sauce. | 14.21 | 175.9 | 57.6 | 6.8 | Medium | 280 |
Discussion
Five healthy ready-to-eat meals were developed and their glycemic index values were investigated. Consumer acceptance and glycemic index testing were conducted by fourteen healthy subjects. The GI values of the five meals were split into low and medium GI groups. GI values of food are important indices that can be used to ameliorate the risk of diabetes, cardiovascular disease (CVD) and obesity.3-6,12,21-22 Therefore, the development of low-medium GI ready-to-eat meals as a healthy diet would be beneficial to consumers, and especially for those with health problems.
Many factors relating to food ingredients and human metabolism are known to affect blood glucose after food consumption. Macronutrients as carbohydrate, protein, fat and fiber content and processing methods can all impact the GI value.23-24 In this study, all developed ready-to-eat meals contained major ingredients as brown rice, vegetables, and meat with low-medium GI values. Rice is a staple food for people in many countries, with nutritive and GI values depending on amylose and dietary fiber content.25 Our findings for the five developed ready-to-eat meals concurred with other studies, suggesting that dietary fibers help to prolong the absorption of glucose in the gastrointestinal tract and improve insulin sensitivity.26-29 Whole grains, beans, mushrooms and vegetables were used as sources of dietary fiber to develop healthy food recipes and all developed ready-to-eat meals contained high amounts of dietary fibers (>5 g/serving). Bean products showed a GI lowering effect when consumed with a carbohydrate meal, while higher protein and fat contents demonstrated an increase in insulin secretion, which caused lower blood glucose response.25,28 The five developed ready-to-eat meals showed no significant differences in GI values since macronutrients in each meal and the balance of energy distribution in the formulation step were similar. Brown rice or whole wheat flour, mushrooms, vegetables, and meat all have low sodium and fat contents. Test meal, steamed minced chicken rice with seasoned shiitake mushrooms showed the lowest GI value, blood glucose and insulin value contained shitake mushrooms which are a good source of beta-glucans (soluble fiber). Previous studies demonstrated that beta-glucans contained in mushrooms helped to delay gastric emptying, thus glucose in the diet was absorbed more gradually, with decreased blood glucose levels and increased insulin response. Our findings were in agreement with other studies, which demonstrated that beta-glucans in shiitake mushrooms reduced hyperglycemia and induced insulin sensitivity.30-31
Conclusions
Knowledge of the GI values of foods can be used to increase menu choices and may have important implications for the prevention and treatment of type 2 diabetes, CVD and obesity. Consumers in Thailand often buy and consume ready-to-eat food due to the current behavior of consumers with no thought or consideration about health aspects. The development of nutritious food or a disease-specific diet would offer alternative healthy eating choices for patients or health-conscious people. The developed ready-to-eat meal with GI information could provide healthier food and convenient life. Moreover, this is a choice for the therapeutic diet that may suitable for diabetes patients.
Acknowledgments
This research was funded by the Agricultural research development agency (Public organization; ARDA) CRP6205012440.
Conflict of Interests
The authors declare no potential conflicts of interest.
Funding Source
This research was funded by the Agricultural research development agency (Public organization; ARDA) CRP6205012440.
References
- Lin, X., Xu, Y., Pan, X. et al. Global, regional, and national burden and trend of diabetes in 195 countries and territories: an analysis from 1990 to 2025. Sci Rep. 2020; 10: 14790. Doi: 10.1038/s41598-020-71908.
CrossRef - McGuire H, Longson D, Adler A, Farmer A, Lewin I. Guideline Development Group. Management of type 2 diabetes in adults: summary of updated NICE guidance. BMJ. 2016; 6:i1575. DOI: 10.1136/bmj.i1575.
CrossRef - Trinidad TP, Valdez DH, Loyola AS, Mallillin AC, Askali FC, Castillo JC, et al. Glycaemic index of different coconut (Cocos nucifera)-flour products in normal and diabetic subjects. Br J Nutr. 2003; 90: 551-6. DOI: 10.1079/bjn2003944.
CrossRef - Brand JC, Colagiuri S, Crossman S, Allen A, Roberts DC, Truswell AS. Low-glycemic index foods improve long-term glycemic control in NIDDM. Diabetes Care. 1991; 14(2):95-101. DOI: 10.2337/diacare.14.2.95.
CrossRef - Wolever TM, Jenkins DJ, Vuksan V, Jenkins AL, Wong GS, Josse RG. Beneficial effect of low-glycemic index diet in overweight NIDDM subjects. Diabetes Care. 1992; 15: 562-4. DOI: 10.2337/diacare.15.4.562.
CrossRef - Gilbertson HR, Brand-Miller JC, Thorburn AW, Evans S, Chondros P, Werther GA. The effect of flexible low glycemic index dietary advice versus measured carbohydrate exchange diets on glycemic control in children with type 1 diabetes. Diabetes Care. 2001; 24:1137-43. DOI: 10.2337/diacare.24.7.1137.
CrossRef - Wolever TM, Jenkins DJ, Jenkins AL, Josse RG. The glycemic index: methodology and clinical implications. Am J Clin Nutr. 1991; 54: 846-54. DOI: 10.1093/ajcn/54.5.846.
CrossRef - Carbohydrates in human nutrition. Report of a Joint FAO/WHO Expert Consultation. FAO Food Nutr Pap. 1998; 66:1-140.
- International Standards Organisation. Food Products-Determination of the Glycaemic Index (GI) and Recommendation for Food Classification; ISO 26642-2010; International Standards Organisation: Geneva, Switzerland, 2010.
- Liese AD, Schulz M, Fang F, Wolever TM, D’Agostino RB Jr, Sparks KC, et al. Dietary glycemic index and glycemic load, carbohydrate and fiber intake, and measures of insulin sensitivity, secretion, and adiposity in the Insulin Resistance Atherosclerosis Study. Diabetes Care. 2005; 28:2832-8. DOI: 10.2337/diacare.28.12.2832.
CrossRef - Hodge AM, English DR, O’Dea K, Giles GG. Glycemic index and dietary fiber and the risk of type 2 diabetes. Diabetes Care. 2004; 27: 2701-6. DOI: 10.2337/diacare.27.11.2701.
CrossRef - Radulian G, Rusu E, Dragomir A, Posea M. Metabolic effects of low glycaemic index diets. Nutr J. 2009;29: 5. DOI: 10.1186/1475-2891-8-5.
CrossRef - Nounmusig J, Kongkachuichai R, Sirichakwal PP, Yamborisut U, 1 Charoensiri R, Vanavichit A. The effect of low and high glycemic index based rice varieties in test meals on postprandial blood glucose, insulin and incretin hormones response in prediabetic subjects. International Food Research Journal. 2018 25: 835-41.
- World Health Organization (WHO). (2020). Healthy diet. Available online: https://www.who.int/news-room/fact-sheets/detail/healthy-diet. Accessed date: 1 May 2021.
- Meilgaard M, Civille GV, Carr BT. (1991). Sensory Evaluation Techniques. 3rd ed. Boca Raton: CRC Press. https://doi.org/10.1201/9781439832271.
CrossRef - (2016). Official Methods of Analysis of AOAC International, 20th ed. Gaithersburg, USA: AOAC.
- Wolever TM. Carbohydrate and the regulation of blood glucose and metabolism. Nutr Rev. 2003; 61(5 Pt 2):S40-8. DOI: 10.1301/nr.2003.may.S40-S48.
CrossRef - Gámbaro A, Giménez A, Ares G, Gilardi, V. Influence of enzymes on the texture of brown pan bread. Journal of Texture Studies. 2006; 37: 300–14.
CrossRef - Giménez A, Varela P, Salvador A, Ares G, Fiszman S, Garitta L. Shelf life estimation of brown pan bread: A consumer approach. Food Quality and Preference. 2007; 18: 196–204.
CrossRef - Giménez, A, Ares G, Gámbaro A. Survival analysis to estimate sensory shelf life using acceptability scores. Journal of Sensory Studies. 2008; 23: 571–82.
CrossRef - Liu S, Willett WC, Stampfer MJ, Hu FB, Franz M, Sampson L, et al. A prospective study of dietary glycemic load, carbohydrate intake, and risk of coronary heart disease in US women. Am J Clin Nutr. 2000; 71:1455-61. DOI: 10.1093/ajcn/71.6.1455.
CrossRef - Aziz A. The glycemic index: methodological aspects related to the interpretation of health effects and to regulatory labeling. J AOAC Int. 2009; 92: 879-87.
CrossRef - Arvidsson-Lenner R, Asp NG, Axelsen M, Bryngelsson S, Haapa E, Järvi A, et al. Glycaemic Index. Relevance for health, dietary recommendations and food labeling. Food & Nutrition Research. 2004; 48: 84-94. doi:10.3402/fnr.v48i2.1509.
CrossRef - Al Dhaheri AS, Henry CJK, Mohamad MN, Ohuma EO, Ismail LC, Al Meqbaali FT, et al. Glycaemic index and glycaemic load values of commonly consumed foods in the United Arab Emirates. Br J Nutr. 2017; 117: 1110-1117. DOI: 10.1017/S0007114517001027.
CrossRef - Sugiyama M, Tang AC, Wakaki Y, Koyama W. Glycemic index of single and mixed meal foods among common Japanese foods with white rice as a reference food. Eur J Clin Nutr. 2003; 57: 743-52. DOI: 10.1038/sj.ejcn.1601606.
CrossRef - Overby NC, Sonestedt E, Laaksonen DE, Birgisdottir BE. Dietary fiber and the glycemic index: a background paper for the Nordic Nutrition Recommendations 2012. Food Nutr Res. 2013;57. DOI: 10.3402/fnr.v57i0.20709.
CrossRef - Reynolds AN, Mann J, Elbalshy M, Mete E, Robinson C, Oey I, Silcock P, Downes N, Perry T, Te Morenga L. Wholegrain Particle Size Influences Postprandial Glycemia in Type 2 Diabetes: A Randomized Crossover Study Comparing Four Wholegrain Breads. Diabetes Care. 2020; 43:476-479. DOI: 10.2337/dc19-1466.
CrossRef - Hätönen KA, Virtamo J, Eriksson JG, Sinkko HK, Sundvall JE, Valsta LM. Protein and fat modify the glycaemic and insulinaemic responses to a mashed potato-based meal. Br J Nutr. 2011; 106: 248-53. doi: 10.1017/S0007114511000080.
CrossRef - Chettri P and Chandran SP. Role of dietary fibers in reducing the risk of type 2 diabetes. IJPESH. 2020; 7: 71-77.
CrossRef - Vandana Gulati, Mansi Dass Singh, Pankaj Gulati. Role of mushrooms in gestational diabetes mellitus. AIMS Medical Science. 2019: 6: 49 66. doi:3934/medsci.2019.1.49.
CrossRef - Lei H, Guo S, Han J, Wang Q, Zhang X, Wu W. Hypoglycemic and hypolipidemic activities of MT-α-glucan and its effect on immune function of diabetic mice. Carbohydr Polym. 2012; 89: 245-50. DOI: 10.1016/j.carbpol.2012.03.003.
CrossRef
Accepted on: 05 Mar 2022
Second Review by: Mala Rajendran India
Final Approval by: Dr. Mattia Di Nunzio


Web of Science Coverage
Emerging Sources Citation Index (ESCI)
2024 Journal Impact Factor: 1.1
Scopus Journal Metrics
CiteScore 2025: 2.6
CiteScore Details
Sustainable Nutrition: Food Systems, Nutrient Retention, and Public Health Impact
![]()
This journal is a member of, and subscribes to the principles of, the Committee on Publication Ethics (COPE)


