Equivalence Test on the Protein Content and Quality of Transgenic and Non-Transgenic Soybean Flour
Made Astawan1*
, Tutik Wresdiyati2, Sahrial3 and Mursyid3 1Department of Food Science and Technology, IPB University, Bogor, Darmaga Campus, Bogor, Jawa Barat, Indonesia.
2Department of Anatomy, Physiology and Pharmacology, Faculty of Veterinary Medicine, IPB University, Bogor, Darmaga Campus, Bogor, Jawa Barat, Indonesia.
3Department of Agricultural Technology, Faculty of Agriculture, Jambi University, Indonesia.
Corresponding Author Email: astawan@apps.ipb.ac.id
DOI : http://dx.doi.org/10.12944/CRNFSJ.10.1.19
Download this article as:
![]()
The annual soybean demand in Indonesia reaches 3.09 million ton, with 81% of which are fulfilled through import that mostly consist of transgenic soybean. This condition has become a food safety issue, especially related to the protein content and quality. The purpose of this study was to evaluate the equivalence of protein content and quality of Grobogan local soybean flour (GLSF) compared to transgenic imported soybean flour (TISF) and non-transgenic imported soybean flour (NTSF). The research design was using completely randomized design with 5 replicates (rats) for each treatments. The protein content equivalence test was carried out using the Kjeldhal method, while the protein quality equivalence test was carried out with experimental rats, namely based on the growth method and the nitrogen balance method. Five groups of Sprague Dawley male albino rats, each consisted of 5 rats, were given feeds which contained 10% protein respectively from GLSF, TISF, NTSF, casein as control and a non-protein group. The observationt was carried out for 28 days. The results showed that GLSF had the highest protein content (49.7%db). The equivalence test of protein quality based on growth method showed no significant difference (p>0.05) in feed conversion efficiency, protein efficiency ratio and net protein ratio parameters. The similar test which was based on nitrogen balance method also showed no significant difference (p>0.05) in true protein digestibility, biological value and net protein utilisation parameters between the types of soybean flour. It can be concluded that although the highest protein content was found in GLSF, the three soybean flour types are equivalent in terms of protein quality.
KEYWORDS:Protein Quality; Soybean; Substantial Equivalence; Transgenic
Introduction
Soybean (Glycine max) has nutritional compounds such as carbohydrate (~30%),1 protein (~35%), edible oil (~20%), fibre, vitamins and minerals.2 Soybean is classified as legumes which known for the high-quality protein that is comparable to animal-based protein.3 In addition, soybean also contains isolflavones, which is a secondary metabolite compound with high antioxidant activity that can inhibit free radical activities which cause various degenerative diseases.4 In Indonesia, around 90% soybean are utilised as food material.5 As a food material, soybean is mostly processed into tempe (50%), tofu (35%) and other processed food (15%). In 2020 the total soybean consumption in Indonesia increased by 0.38%.5 which is due to increase in tempe and tofu consumption. The average of tempe and tofu consumption in Indonesia are 7.49 and 7.41 kg/capita/year, respectively.6
Local soybean production yield in Indonesia remains low with 0.6 million ton per year, while the demand reaches 3.09 million ton per year7. One of the solutions that is offered by the government is to increase the local soybean variety production. There are 84 superior local soybean varieties that have been successfully developed, but the production yield remains low.8 Soybean crops grow well in subtropical climate regions, but Indonesia has tropical climate. This condition causes 81% of total soybean demand needs to be fulfilled through import from various countries, such as the United States of America, Brazil and Argentina.9 Imported soybean are widely utilised by industries due to better quality compared to local soyebean as well as cheaper in cost.7
Majority of imported soybean are transgenic product, specifically soybean produced using genetic modification. The genetic modification technique causes in increase of soybean production yield, due the soybean crops are inserted with pest and disease resistant genes.10 The regulations for genetically modified crops in Indonesia have been regulated by several bodies which refers to Government Regulation Number 21 of 2005. Although there are benefits and guarantees from the government, the presence of transgenic soybean remains an issue for most Indonesian. These issues consist of possibility in new allergen emergence, changes in the balance of original nutritional value, alteration of protein quality, halalness, as well as antibiotic and pesticide resistances.11 Therefore, the purpose of this study was to analyse the equivalence of protein content and quality of soybean flours made from local soybean (non-transgenic) and imported soybean (transgenic and non-transgenic).
Materials and Methods
Materials
The main materials used in this study were local soybean (Glycine max) Grobogan variety obtained from soybean farmers in Grobogan District, East Java Province, Indonesia and imported soybean US Origin (transgenic and non-transgenic) obtained from the Indonesian Tofu and Tempe Cooperative (KOPTI Bogor, Bogor, Indonesia). The imported transgenic soybean had distribution permit letter which referred to the Head of Indonesian FDA Decree No. HK.04.1.52.04.11.03588 of 2011 concerning the Distribution Permit for Genetically Modified Soybean Food Commodity Event 40-3-2. Sprague Dawley male albino rats with weaning age of 28 days were used as experimental animals and obtained from the Indonesian FDA.
Soybean Flour Production
The soybean flour production process referred to procedure developed by Astawan et al.12 which consist of sortation, first stage washing, soaking, second stage washing, boiling, skin peeling, draining, drying, milling and 60-mesh sieving.
Yield
The yield of soybean flour was calculated using formula as followed:
![]()
Chemical Analysis
Water, ash, crude fibre, fat and protein contents analysis and carbohydrate by difference were performed and determined using AOAC.13
Feed Formulation
The feed consisted of protein source, corn oil, water, cellulose, mineral mixture, vitamin mixture and corn starth. It was formulated to achieve 10% protein content, in accordance to AOAC.14
Preparation of Experimental Rats
This study complied with the European Union guidelines for animal care and protection and was approved by the Ethics Committee of the Bogor Agricultural University (Bogor, Indonesia) with approval number 146-2019 IPB. The preparation of experimental rats referred to procedure by Astawan et al.15 The experimental rats used in this study were 28 days old Sprague Dawley male albino rats and off from weaning. There were 25 experimental rats used in this study and were divided into five groups based on the given protein sources, namely: (1) Grobogan local soybean flour (GLSF) group, (2) transgenic imported soybean flour (TISF) group, (3) non-transgenic imported soybeans flour (NTSF) group, (4) casein as control group and (5) non-protein group. The rats were individually placed in metabolic cage to obtain the faeces and urine separately. The cage was made from perforated stainless steel with size of 17.5 x 23.75 x 17.5 cm. The environmental conditions were laboratory temperature at 22–24°C, 50–60% humidity, sufficient ventilation, free from noises, pollutants, easy to clean and sanitise.
The adaptation period for the experimental rats was performed for one week. Then, selection and grouping were done based on the types of feed treatment, with each five rats per group. The weight variation between rats in one group should not exceed 10 grams and the average weight variation between groups should not exceed 5 grams.
Experiment Period
The experiment on animal (rat) was carried out for 28 days. Faeces and urine collection were done during the first 10 days. For urine collection, a bottle added with ±1 mL of 5% H2SO4 solution to prevent ammoniac evaporation was used. During the experiment, urine and faeces collection was collected separately for individual rat, then stored in a refrigerator until ready to be analysed. The calculation of consumed feed was done daily and weighing was done for every two days. Feed and drinking water were provided ad libitum.
Faeces and Urine Nitrogen Analysis
Nitrogen content analysis in the faeces and urine was carried using Kjeldahl method.13 The analysed faeces were dried in oven and made floured initially. The total faeces nitrogen was obtained by multiplying the faeces nitrogen content with faeces weight. Meanwhile, the total urine nitrogen was obtained by multiplying utine nitrogen content with urine volume.
Measurement of Protein Quality based on Growth Method
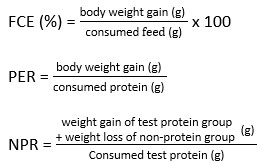
The protein quality based on growth method was measured with several parameters, namely FCE (Feed Convertion Efficiency), PER (Protein Efficiency Ratio) and NPR (Net Protein Ratio). These parameters were calculated with following equations.15
Measurement of Protein Quality Based on Nitrogen Balance Method
Protein quality based on growth method was measured with several parameters, such as TD (True Protein Digestibility), BV (Biological Value) and NPU (Net Protein Utilisation). These parameters were calculated with following equations.16
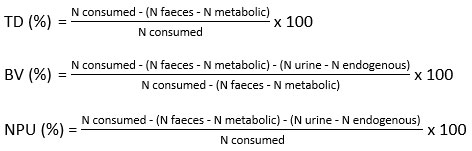
N metabolic = Total of N in faeces of rat group with non-protein feed treatment
N endogenous = Total of N in urine of rat group with non-protein feed treatment
Data analysis
The results were expressed as a mean + SD. Analysis of variance (ANOVA) was performed using SPSS 26 (IBM® SPSS Statistics 26) to determine the significance of the treatments. The treatments with significant results were analysed using Duncan’s Multiple Range Test (DMRT) to determine which treatments significantly differed at a 95% significance level.
Results and Discussion
Soybean Flour
Soybean as food material is generally not consumed raw. Soybean undergoes processing, with minimum are soaking and boiling. The purpose of soaking is to dissolve water-soluble antinutrient compounds and to soften the soybean, so the process of skin peeling is easier to be done.17 Vagadia et al.18 explained that soaking can reduce antiprotease and other unwanted factors, such as undigestible carbohydrates. Boiling is one of thermal process which categorised as moist heat processing due to utilisation of water as heat medium in this process.19 The purpose of boiling is to reduce antinutrient activities, such as antitrypsin.20
The drying method was performed to obtain soybean in flour form. In addition, drying at 60⁰C was done after the boiling to reduce protease inhibitor activity.21 In this study, cabinet dryer was chosen due to its better drying rate, thus the resulted moisture content and water activity would be lower compared to hot oven drying method.22 The result of soybean flour yield analysis is shown in Table 1. The analysis of variance showed that types of soybeans had no significant difference (p>0.05) in the resulted soybean flour yield.
Table 1: The yield of soybean flour based on the type of soybean used.
| Type of soybean flour | Yield (%) |
| Transgenic imported soybeans flour (TISF) | 62.7 ± 1.8a |
| Non-transgenic imported soybeans flour (NTSF) | 64.9 ± 2.5a |
| Grobogan local soybeans flour (GLSF) | 64.5 ± 2.4a |
Notes: values followed by same letters indicate no significant differences (p>0.05), n=2
Proximate Analysis
The proximate analysis was done to determine the chemical composition comparison between samples which would be used as reference in formulating feed for experimental rats in accordance with AOAC formula (AOAC 2012b). The result of sample proximate analysis is shown in Table 2.
Table 2: The proximate composition of soybean flour and casein.
| Composition | Transgenic imported soybeans flour (TISF) | Non-transgenic imported soybeans flour (NTSF) | Grobogan local soybeans flour (GLSF) | Casein |
| Moisture (%bb) | 3.4±0.0a* | 4.2±0.0b | 4.0±0.1b | 4.2±0.0 |
| Ash (%db) | 3.6±0.1a* | 3.7±0.1a | 3.2±0.0a* | 4.2±0.1 |
| Protein (%db) | 48.5±0.4b* | 43.8±0.6a* | 49.7±0.5c* | 79.2±0.5 |
| Fat (%db) | 31.1±0.2b* | 29.8±0.2b* | 26.4±0.9a* | 0.2±0.0 |
| Carbohydrate (%db) | 16.8±0.3a | 22.7±0.9b* | 20.7±1.3b* | 16.4±0.4 |
| Crude fiber (%db) | 7.8±0.1a* | 7.8±0.3a* | 7.6±0.1a* | 0.4±0.0 |
Notes: Values followed by different letters in the same row indicate significant differences (p<0.05) between soybean flour with DMRT follow-up test; the value followed by * indicates a significant difference (p<0.05) against casein based on the T-test, n=2
The analysis of variance showed that soybean flour types had significant differences (p<0.05) in moisture, protein, fat and carbohydrate contents. It had no significant difference (p>0.05) in crude fibre content. Table 2, showed that Grobogan local soybean flour (GLSF) had the highest protein content and was significantly different compared to transgenic imported soybean flour (TISF) and non-transgenic imported soybean flour (NTSF), which were 49.7, 48.5 and 43.8%db, respectively.
Table 2, also showed that GLSF, TISF and NTSF had moisture content which fulfilled the required standard, with maximum moisture content of 12%.23 In addition, GLSF, TISF and NTSF had acceptable ash, protein and fat contents according to Gandhi24 which stated that a good soybean flour has maximum ash content of 6.5%, minimum protein content of 35% and minimum fat content of 18%.
The results of DMRT analysis showed that GLSF and NTSF moisture content which were not different from one another, while TISF moisture content was lower compared to other flour types. The differences in moisture content were caused by environmental relative humidity.25 GLSF, TISF and NTSF had ash content that were not different from one another. Fat content of TISF and NTSF were also not different from one another, but both had higher fat content compared to GLSF fat content. Generally, for every 1% protein increase is followed by 0.5% fat content decline.26 This supports the notion that GLSF has the highest protein content as well as the lowest fat content.
Consumed Feed and Body Weight Gain
Total consumed feed, protein intake and body weight changes during 28 days of observation is shown in Table 3. Analysis of variance showed that types of feed had significant difference (p<0.05) to total consumed feed and total protein intake. Nogi et al.27 explained that rats have olfactory system, which is a system that regulates or influences the behaviour of rats in accepting stimuli, namely feed. In addition, hypothalamus synthesises corticotropin releasing factor receptor (CRF2) which regulates appetite.28 This reason contributes in the amount of feed consumed by the experimental rats.
The result of DMRT test showed that the total consumed feed and total protein intake in rats group which were given TISF feed was not difference to other treatments (NTSF and GLSF). These results were in accordance with study findings of Qi et al.29 which stated that rat group which were given HOA-HT (transgenic) soybean feed and JACK (non-transgenic) soybean feed had no differences in terms of body weight, feed consumption, body weight gain and nutrition absorption.
The analysis of variance showed that types of treatment had no significant effect (p>0.05) to gain the body weight. This showed that despite GLSF rat group had the lowest consumed total feed, it resulted in body weight gain which was insignificant to other feed groups. According to this finding, it can be stated that GLSF had protein quality that is equivalent to other soybean flour types (NTSF and TISF).
Table 3: Total feed consumption, protein intake and weight gain for 28 days
| Type of feed | Total feed consumption (g) | Total protein intake (g) | Weight gain (g) |
| Transgenic imported soybeans flour (TISF) | 574.1±49.3ab | 57.4±4.9ab | 102.4±23.9a |
| Non-transgenic imported soybeans flour (NTSF) | 587.6±18.9b | 58.8±1.9b | 107.0±10.9a |
| Grobogan local soybeans flour (GLSF) | 523.1±13.9a | 52.3±1.4a | 93.2±6.4a |
| Casein | 627.6±27.5b | 62.8±2.7b | 115.2±16.2a |
Note: Values followed by different letters in the same column are significantly different (p<0.05) with DMRT follow-up test, n=5
The body weight increase during 28 days observation is illustrated in Figure 1. Experiment groups which were given GLSF, TISF, NTSF and casein feeds, each experienced body weight gain, while the group which was given non-protein feed experienced body weight loss. This result showed that protein intake is directly proportional with the weight gain of experimental rats. Protein intake deficiency causes disturbance in nutrition absorption and transportation30; thus, it affects the consumed feed to be incapable in increasing the muscle mass, even the opposite.31
Protein Quality Based on Growth Method
The comparison of FCE, corrected PER and NPR values is shown in Table 4. FCE value shows the correlation between body weight changes in rats to the amount of consumed feed (gram) during the experiment period. The higher FCE value, the more efficient the given feed to increase the body weight of experimental rats.32 The analysis of variance showed that FCE value in each feed treatments were not significantly different (p>0.05). This result showed that GLSF, TISF, NTSF and casein had equivalent FCE values.
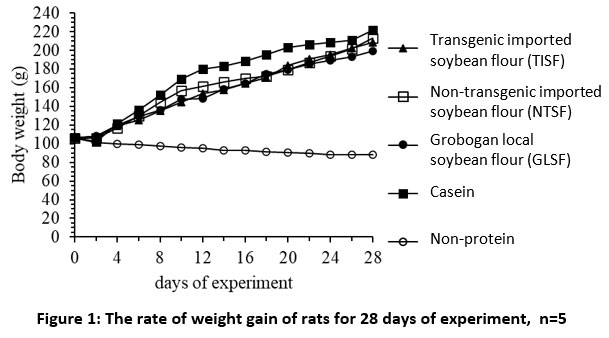 |
Figure 1: The rate of weight gain of rats for 28 days of experiment, n=5 |
The PER value shows that the protein intake which is only utilised for body growth.33 The PER value determines protein effectivity through measuring the growth of the experimental rats.34 The higher the PER value, the more efficient the protein in the feed increasing the body weight of experimental rats. All of the sample test PER values were corrected since casein that was used as standard protein sample in this study was not ANRC (Animal Nutrition Research Council) casein.
The analysis of variance showed that corrected PER value from the types of feeds were not significantly different (p>0.05). Although PER values of GLSF, TISF and NTSF were not higher compared to standard casein,35 which was 2.5 but PER value from GLSF, TISF and NTSF which were close to PER standard casein value, thus it can be considered to have acceptable PER values. Mansilla et al.36 also explained that corrected PER value above 2.0 (80% of 2.5 casein standard value) is considered to be acceptable. This implies that GLSF, TISF, NTSF and casein have equivalent PER values.
Table 4: The protein quality based on growth method.
| Treatment Group | Feed Convertion Effeciency (%) | Corrected Protein Efficiency Ratio | Net Protein Ratio |
| Transgenic imported soybeans flour (TISF) | 17.7±2.7a | 2.4±0.4a | 2.5±0.4a |
| Non-transgenic imported soybeans flour (NTSF) | 18.2±1.4a | 2.5±0.2a | 2.9±0.3ab |
| Grobogan local soybeans flour (GLSF) | 17.8±0.9a | 2.4±0.1a | 2.8±0.3ab |
| Casein | 18.3±2.0a | 2.5±0.0a | 3.4±0.3b |
Notes: Values followed by different letters in the same column are significantly different (p<0.05) with the DMRT follow-up test, n=5.
The protein consumed by the experimental rats is not only utilised for growth, which as explained on the concept of PER value, but it is also used for body maintenance.33 To resolve issue in PER, NPR parameter is used by adding one group of non-protein.37 The analysis of variance showed that feed treatments had significant effect (p<0.05) to NPR value. The DMRT test showed that only rat group which was given TISF feed had lower NPR value compared to casein group. However, GLSF, TISF, NTSF had NPR values that were not significantly different from one another. This implies that GLSF, TISF, NTSF and casein have equivalent NPR values.
Protein Quality Based on Nitrogen Balance Method
Protein digestibility is a fraction of nitrogen that comes from food material which can be digested by the body. These nitrogen factions are obtained from protein which are hydrolysed by digestive enzymes into amino acids. Not all consumed protein can be hydrolysed by digestive enzymes into amino acids. Protein digestibility determines the biological availability of amino acids.33 This value determines the protein quality in a food. The comparison of TD, BV and NPU values are shown in Table 5.
True protein digestibility (TD) value is an indicator of nitrogen amount or protein that are absorbed by the body.38 Analysis of variance showed that treatment types had no significant effect (p>0.05) to TD value. TD values of all feed types are equivalent to each other, with each higher than 99%, thus it can be considered as exceptional. This showed that more than 99% protein in each sample were able to be digested by the experimental rats.
Table 5: The protein quality based on nitrogen balance method.
| Treatment Group | True Digestibility (%) | Biological Value (%) | Net Protein Utilization (%) |
| Transgenic imported soybeans flour (TISF) | 99.2±0.1a | 99.7±0.2a | 98.9±0.2a |
| Non-transgenic imported soybeans flour (NTSF) | 99.3±0.0a | 99.3±0.1a | 98.6±0.1a |
| Grobogan local soybeans flour (GLSF) | 99.2±0.0a | 99.6±0.3a | 98.7±0.2a |
| Casein | 99.3±0.1a | 99.2±0.2a | 98.5±0.2a |
Notes: Values followed by same letters in the same column are not significantly different (p>0.05), n=5.
Biological value (BV) shows the measurement on how efficient the body in utilising the consumed protein which comes from the diet.39 The more protein retained in the body, the higher the biological value. The analysis of variance showed that types of feed treatment had no significant effect (p>0.05) to BV. Astawan et al.16 explained that BV of soybean flour is comparable to casein standard and not significantly different, which shows a highly exceptional protein quality. This implies that GLSF, TISF and NTSF have equivalent biological values.
The calculation of BV value also showed that GLSF, TISF, NTSF and casein had BV value >99%. According to Ijarotimi and Keshinro,40 food which has biological value ≥70% is categorized as high BV food, which is considered able to provide growth if consumed in adequate amount and balanced with sufficient energy amount. This shows that GLSF, TISF, NTSF and casein have exceptional BV that contributed in the growth of the experimental rats.
Net Protein Utilisation (NPU) is an approach to measure the protein quality by calculating the protein digestibility.41 Amino acids that enter the cell will be modified into protein macromolecules that are neded by the cells.42 The higher the NPU of a food, the higher the nitrogen from the food that can be digested by the body. The analysis of variance showed that types of feeds had no significant effect (p>0.05) to NPU values. Thus, NPU value of Grobogan local soybean flour (GLSF) is equivalent to transgenic imported soybean flour (TISF), non-transgenic imported soybean flour (NTSF) and casein.
Conclusion
Grobogan local soybean variety and imported soybean (transgenic and non-transgenic) could be processed into flour with insignificant yield, with range of 62.7-64.9%. Grobogan local soybean flour (GLSF) has higher protein content compared to transgenic imported soybean flour (TISF) and non-transgenic imported soybean flour (NTSF), which were 49.7, 48.5 and 43.8%db, respectively.
The bioassay analysis with experimental rats shows there are equivalence in protein quality from GLSF with protein from TISF and NTSF. This is shown by the absence of protein quality differences, which were both measured using growth method (feed conversion efficiency, protein efficiency ratio and net protein ratio) and nitrogen balance method (true protein digestibility, biological value and net protein utilisation). The three soybean flour types also have protein quality which are not significantly different to casein (as control).
Acknowledgement
Authors would like to thank from Directorate General of Higher Education, Research, and Technology; Ministry of Education, Culture, Research and Technology of the Republic of Indonesia.
Conflict of Interest
The authors declare no conflict of interest
Funding Sources
The authors are very grateful for financial support from Directorate General of Higher Education, Research, and Technology; Ministry of Education, Culture, Research and Technology of the Republic of Indonesia and also from the Collaborative Research scheme between IPB University and Jambi University, 2022.
References
- Al Loman A. and Ju L.K. Enzyme-based processing of soybean carbohydrate: Recent developments and future prospects. Enzyme Microb. Technol. 2017; 106: 35-47.
CrossRef - Sharma S., Kaur M., Goyal R. and Gill B.S. Physical characteristics and nutritional composition of some new soybean (Glycine max (L.) Merrill) genotypes. Food Sci. Technol. 2014; 51(3): 551-557.
CrossRef - Qin P., Wang T. and Luo Y. A review on plant-based proteins from soybean: Health benefits and soy product development. Agric. Food Inf. 2022; 100265.
CrossRef - Astawan M., Rahmawati I. S., Cahyani A. P., Wresdiyati T., Putri S. P. and Fukusaki E. Comparison between the potential of tempe flour made from germinated and nongerminated soybeans in preventing diabetes m Hayati. 2020; 27(1): 17-23.
CrossRef - Badan Pusat Statistik. Survei Sosial Ekonomi Nasional, Pengeluaran untuk Konsumsi Penduduk Indonesia Tahun 2020. Jakarta: Badan Pusat Statistik; 2021.
- Ministry of Agriculture Republic Indonesia. Buletin Konsumsi Pangan Tahun 2021. Jakarta: Ministry of Agriculture Republic Indonesia; 2021.
- Sabarella, Komalasari, Wahyuningsih S., Manurung M., Sehusman, Rinawati, Supriyati. Buletin Konsumsi Pangan Tahun 2021. Jakarta: Kementrian Pertanian; 2021. 32–42.
- Yudiono K. Peningkatan daya saing kedelai lokal terhadap kedelai impor sebagai bahan baku tempe melalui pemetaan fisiko-kimia. 2020; 14(1): 57-66.
CrossRef - Ministry of Agriculture Republic Indonesia. Outlook Kedelai Tahun 2020. Jakarta: Ministry of Agriculture Republic Indonesia; 2021.
- Ainsworth E.A., Yendrek C.R., Skoneczka J.A. and Long S.P. Accelerating yield potential in soybean: potential targets for biotechnological improvement. Plant Cell Environ. 2012; 35(1): 38-52.
CrossRef - Alhariri M. Halal and Genetically Modified Ingredients. The Halal Food Handbook; 2020: 169-182.
CrossRef - Astawan M., Wresdiyati T., Purnomo E. H., Purwanto A. Equivalence test between the physicochemical properties of transgenic and non-transgenic soy flour. Nutr. Sci. Vitaminol. 2020; 66(Supp.) S286-294.
CrossRef - Analysis of Official Analytical Chemistry Methods 19th Ed. Marryland: AOAC: AOAC International; 2012.
- Analysis of Official Analytical Chemistry Methods 18th Ed. Washington DC: AOAC International; 2012.
- Astawan M., Wresdiyati T., Asyaifullah K. Calcium bioavailability of tempe and boiled soybean flours and its effect on osfemurs in experimental rats Nutr. Sci. Vitaminol. 2020;66 (Supp.):S314-319.
CrossRef - Astawan M., Wresdiyati T. and Saragih A.M. Evaluasi mutu protein tepung tempe dan tepung kedelai rebus pada tikus percobaan. Jurnal Mutu Pangan: Indonesian Journal of Food Quality.2015; 2(1): 11-17.
- Cempaka L., Casa N. and Asiah N. Chemical composition and sensory analysis of simulated chips-based rice bran tempe flour. Res. Nutr. Food Sci. 2018;6(3): 826-834.
CrossRef - Vagadia B.H., Vanga S.K. and Raghavan V. Inactivation methods of soybean trypsin inhibitor–A review. Trends Food Sci Technol. 2017; 64: 115-125.
CrossRef - Vanga S.K., Singh A., Raghavan V. Review of conventional and novel food processing methods on food allergens. Crit Rev Food Sci Nutr. 2017;57(10): 2077–2094.
CrossRef - Cipollone M.A. and Tironi V.A. Yellow pea flour and protein isolate as sources of antioxidant peptides after simulated gastrointestinal digestion. 2020; 2(4): e59.
CrossRef - Vagadia B.H., Vanga S.K., Singh A., Gariepy Y. and Raghavan V. Comparison of conventional and microwave treatment on soymilk for inactivation of trypsin inhibitors and in vitro protein digestibility. Foods. 2018; 7(1): 6.
CrossRef - Puteri N. E., Astawan M., Palupi N. S., Wresdiyati T., Takagi Y. Chacterization of biochemical and functional properties of water-soluble tempe f J. Food Sci. Technol. 2018;38(Suppl. 1):147-153.
CrossRef - National Oil Producers Association. Soybean Meal Trading Rules-updated November 2012. In: Van Eys J.E., editor. Manual of Quality Analyses for Soybean Products in Feed Industry 2nd Edition. Saint Louis: US Soybean Export Council; 2011. F-3.
- Gandhi A. Development of HACCP procedure for the production of full fat soy flour. Int. Food Res. J. 2008;15(2):141–154.
- Pratiwi C., Rahayu W.P., Lioe H.N., Herawati D., Broto W. and Ambarwati, S. The effect of temperature and relative humidity for Aspergillus flavus BIO 2237 growth and aflatoxin production on soybeans. Food Res. J.2015; 22(1).
- Xu M., Jin Z., Simsek S., Hall C., Rao J. and Chen B., Effect of germination on the chemical composition, thermal, pasting, and moisture sorption properties of flours from chickpea, lentil, and yellow pea. Food Chem.2019; 295: 579-587.
CrossRef - Nogi Y., Ahasan M.M., Murata Y., Taniguchi M., Sha M.F.R., Ijichi C. and Yamaguchi M. Expression of feeding-related neuromodulatory signalling molecules in the mouse central olfactory system. Rep.2020; 10(1): 1-14.
CrossRef - Gotoh K., Masaki T., Chiba S., Ando H., Fujiwara K., Shimasaki T., Mitsutomi K., Katsuragi I., Kakuma T., Sakata T. and Yoshimatsu,H. Brain‐derived neurotrophic factor, corticotropin‐releasing factor, and hypothalamic neuronal histamine interact to regulate feeding behavior. Neurochem. 2013; 125(4): 588-598.
CrossRef - Qi X., He X., Luo Y., Li S, Zou S., Cao S., Tang M., Delaney B., Xu W., Huang K. Subchronic feeding study of stacked trait genetically-modified soybean (3ᴓ5423 x 40-3-2) in sprague dawley rats. Food Chem. Toxicol. 2012;50: 3256–3263.
CrossRef - Kiela P.R. and Ghishan F.K. Physiology of intestinal absorption and secretion. Best Pract. Res. Clin. Gastroenterol. 2016; 30(2): 145-159.
CrossRef - Salgado-Ismodes A., Taipale S. and Pirhonen J. Effects of progressive decrease of feeding frequency and re-feeding on production parameters, stomach capacity and muscle nutritional value in rainbow trout (Oncorhynchus mykiss). Aquaculture.; 519: 734919.
CrossRef - Meale S.J., Morgavi D.P., Cassar-Malek I., Andueza D., Ortigues-Marty I., Robins R.J., Schiphorst A.M., Laverroux S., Graulet B., Boudra H. and Cantalapiedra-Hijar G. Exploration of biological markers of feed efficiency in young bulls. Agric. Food Chem. 2017; 65(45): 9817-9827.
CrossRef - Ytrestøyl T., Aas T.S. and Åsgård T. Utilisation of feed resources in production of Atlantic salmon (Salmo salar) in Norway. Aquaculture. 2015; 448: 365-374.
CrossRef - Nosworthy M.G., Medina G., Franczyk A.J., Neufeld J., Appah P., Utioh A., Frohlich P. and House J.D. Effect of processing on the in vitro and in vivo protein quality of beans (Phaseolus vulgaris and Vicia faba). Nutrients. 2018; 10(6): 671.
CrossRef - Guillin F.M., Gaudichon C., Guérin-Deremaux L., Lefranc-Millot C., Azzout-Marniche D., Khodorova N. and Calvez J. Multi-criteria assessment of pea protein quality in rats: a comparison between casein, gluten and pea protein alone or supplemented with methionine. J. Nutr. 2021; 125(4): 389-397.
CrossRef - Mansilla W.D., Marinangeli C.P., Cargo-Froom C., Franczyk A., House J.D., Elango R., Columbus D.A., Kiarie E., Rogers M. and Shoveller A.K. Comparison of methodologies used to define the protein quality of human foods and support regulatory claims. Appl Physiol Nutr Metab. 2020; 45(9): 917-926.
CrossRef - Mursyid, Astawan M., Muchtadi D., Wresdiyati T., Widowati S., Bintari S.H., Suwarno M. Evaluasi nilai gizi protein tempe yang terbuat dari varietas kedelai impor dan lokal. Jurnal Pangan. 2013;23(1):100–107.
- Boye J., Wijesinha-Bettoni R. and Burlingame B. Protein quality evaluation twenty years after the introduction of the protein digestibility corrected amino acid score method. J. Nutr. 2012; 108(S2): S183-S211.
CrossRef - Adejuwo, K.P., Osundahunsi O.F., Akinola S.A., Oluwamukomi M.O. and Mwanza M.,. Effect of fermentation on nutritional quality, growth and hematological parameters of rats fed sorghum‐soybean‐orange flesh sweet potato complementary diet. Food Sci. Nutr. 2021; 9(2): 639-650.
CrossRef - Ijarotimi O.S. and Keshinro O.O. Formulation and nutritional quality of infant formula produced from germinated popcorn, Bambara groundnut and African locust bean flour. Microbiol. Biotechnol. 2021; 2021: 1358-1388.
- Sá A.G.A., Moreno Y.M.F. and Carciofi B.A.M. Food processing for the improvement of plant proteins digestibility. Crit Rev Food Sci Nutr. 2020; 60(20): 3367-3386.
CrossRef - Paul I., White C., Turcinovic I. and Emili A. Imaging the future: the emerging era of single‐cell spatial proteomics. FEBS Lett.. 2021; 288(24): 6990-7001.
CrossRef
Scopus Citation(s): 9
Accepted on: 31 Mar 2022
Second Review by: Veenu Chandraker India
Final Approval by: Dr. Vikas Kumar


Web of Science Coverage
Emerging Sources Citation Index (ESCI)
2024 Journal Impact Factor: 1.1
Scopus Journal Metrics
CiteScore 2025: 2.6
CiteScore Details
Sustainable Nutrition: Food Systems, Nutrient Retention, and Public Health Impact
![]()
This journal is a member of, and subscribes to the principles of, the Committee on Publication Ethics (COPE)


